Rio Blanco County, Colorado
| Rio Blanco County, Colorado | |
|---|---|
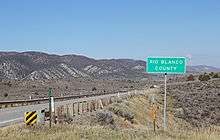 Entering the county from the south on State Highway 13. | |
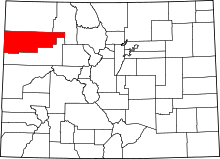 Location in the U.S. state of Colorado | |
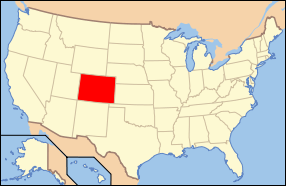 Colorado's location in the U.S. | |
| Founded | March 25, 1889 |
| Named for | White River |
| Seat | Meeker |
| Largest town | Meeker |
| Area | |
| • Total | 3,223 sq mi (8,348 km2) |
| • Land | 3,221 sq mi (8,342 km2) |
| • Water | 1.9 sq mi (5 km2), 0.06% |
| Population (est.) | |
| • (2015) | 6,571 |
| • Density | 2.1/sq mi (0.8/km2) |
| Congressional district | 3rd |
| Time zone | Mountain: UTC−7/−6 |
| Website |
www |
Rio Blanco County is one of the 64 counties of the U.S. state of Colorado. As of the 2010 census, the population was 6,666.[1] The county seat is Meeker.[2] The name of the county is the Spanish language name for the White River which runs through it.
Geography
According to the U.S. Census Bureau, the county has a total area of 3,223 square miles (8,350 km2), of which 3,221 square miles (8,340 km2) is land and 1.9 square miles (4.9 km2) (0.06%) is water.[3]
Adjacent counties
- Moffat County - north
- Routt County - northeast
- Garfield County - south
- Uintah County, Utah - west
National protected areas
Scenic byways
- Dinosaur Diamond Prehistoric Highway National Scenic Byway
- Flat Tops Trail Scenic Byway
State parks and wildlife areas
Demographics
| Historical population | |||
|---|---|---|---|
| Census | Pop. | %± | |
| 1890 | 1,200 | — | |
| 1900 | 1,690 | 40.8% | |
| 1910 | 2,332 | 38.0% | |
| 1920 | 3,135 | 34.4% | |
| 1930 | 2,980 | −4.9% | |
| 1940 | 2,943 | −1.2% | |
| 1950 | 4,719 | 60.3% | |
| 1960 | 5,150 | 9.1% | |
| 1970 | 4,842 | −6.0% | |
| 1980 | 6,255 | 29.2% | |
| 1990 | 5,972 | −4.5% | |
| 2000 | 5,986 | 0.2% | |
| 2010 | 6,666 | 11.4% | |
| Est. 2016 | 6,545 | [4] | −1.8% |
| U.S. Decennial Census[5] 1790-1960[6] 1900-1990[7] 1990-2000[8] 2010-2015[1] | |||
As of the census[9] of 2000, there were 5,986 people, 2,306 households, and 1,646 families residing in the county. The population density was 2 people per square mile (1/km²). There were 2,855 housing units at an average density of 1 per square mile (0/km²). The racial makeup of the county was 95.01% White, 0.18% Black or African American, 0.77% Native American, 0.28% Asian, 2.02% from other races, and 1.74% from two or more races. 4.94% of the population were Hispanic or Latino of any race.
There were 2,306 households out of which 35.60% had children under the age of 18 living with them, 60.10% were married couples living together, 7.80% had a female householder with no husband present, and 28.60% were non-families. 24.80% of all households were made up of individuals and 8.70% had someone living alone who was 65 years of age or older. The average household size was 2.50 and the average family size was 2.98.
In the county, the population was spread out with 26.50% under the age of 18, 9.20% from 18 to 24, 27.50% from 25 to 44, 25.60% from 45 to 64, and 11.20% who were 65 years of age or older. The median age was 38 years. For every 100 females there were 101.90 males. For every 100 females age 18 and over, there were 101.60 males.
The median income for a household in the county was $37,711, and the median income for a family was $44,425. Males had a median income of $38,125 versus $19,940 for females. The per capita income for the county was $17,344. About 6.70% of families and 9.60% of the population were below the poverty line, including 11.60% of those under age 18 and 10.40% of those age 65 or over.
Politics
Rio Blanco is an overwhelmingly Republican county in Presidential elections. It was along with Clark County, Idaho and Kane County, Utah one of only three counties west of the Continental Divide to vote for Alf Landon over Franklin Delano Roosevelt in 1936. In that election Rio Blanco was Landon’s strongest county in the eleven western states, marginally shading normal Republican “banner county” Kane. Since that time only two Democrats – Harry S. Truman in 1948 and Lyndon Johnson who narrowly carried the county in 1964 – have obtained over forty percent of the county’s vote. In fact, since 1968 only one Democratic Presidential candidate, Michael Dukakis in 1988, and him only very marginally, has topped thirty percent of Rio Blanco County’s ballots.
| Year | Republican | Democratic | Others |
|---|---|---|---|
| 2016 | 80.9% 2,791 | 12.6% 436 | 6.5% 223 |
| 2012 | 80.9% 2,724 | 16.9% 568 | 2.3% 77 |
| 2008 | 77.4% 2,437 | 20.8% 655 | 1.8% 55 |
| 2004 | 80.0% 2,403 | 18.9% 566 | 1.1% 34 |
| 2000 | 76.5% 2,185 | 19.0% 543 | 4.5% 127 |
| 1996 | 62.5% 1,697 | 26.9% 731 | 10.6% 287 |
| 1992 | 43.2% 1,231 | 27.3% 778 | 29.5% 841 |
| 1988 | 68.4% 1,821 | 30.2% 803 | 1.4% 38 |
| 1984 | 80.8% 2,131 | 18.4% 484 | 0.8% 22 |
| 1980 | 74.5% 1,971 | 17.5% 462 | 8.1% 214 |
| 1976 | 67.2% 1,439 | 29.3% 627 | 3.5% 74 |
| 1972 | 77.3% 1,586 | 20.2% 414 | 2.6% 53 |
| 1968 | 64.6% 1,294 | 25.1% 502 | 10.3% 207 |
| 1964 | 47.2% 1,015 | 52.7% 1,134 | 0.1% 3 |
| 1960 | 63.6% 1,391 | 36.3% 794 | 0.1% 3 |
| 1956 | 71.5% 1,593 | 28.5% 635 | 0.0% 1 |
| 1952 | 71.4% 1,612 | 28.1% 633 | 0.5% 12 |
| 1948 | 56.0% 981 | 43.0% 752 | 1.0% 18 |
| 1944 | 65.9% 881 | 33.7% 451 | 0.4% 5 |
| 1940 | 65.5% 1,021 | 34.0% 530 | 0.5% 8 |
| 1936 | 55.8% 830 | 39.5% 587 | 4.8% 71 |
| 1932 | 44.5% 687 | 53.5% 826 | 2.1% 32 |
| 1928 | 65.5% 860 | 32.7% 429 | 1.8% 24 |
| 1924 | 60.8% 766 | 32.3% 407 | 6.8% 86 |
| 1920 | 62.2% 793 | 35.7% 455 | 2.0% 26 |
| 1916 | 39.5% 468 | 59.2% 702 | 1.4% 16 |
| 1912 | 33.2% 372 | 48.1% 538 | 18.7% 209 |
In other statewide elections, Rio Blanco County also leans Republican, although it was carried by Democrat Roy Romer in 1990[11] – when he carried all but four counties statewide – and by Constitution Party candidate Tom Tancredo in 2010.[12] Rio Blanco County was also carried by Democratic Senatorial candidate “Nighthorse” Campbell in 1992,[13] although since then no Democratic candidate for this office has passed thirty percent either.
Communities
See also
References
- 1 2 "State & County QuickFacts". United States Census Bureau. Retrieved February 11, 2014.
- ↑ "Find a County". National Association of Counties. Retrieved 2011-06-07.
- ↑ "US Gazetteer files: 2010, 2000, and 1990". United States Census Bureau. 2011-02-12. Retrieved 2011-04-23.
- ↑ "Population and Housing Unit Estimates". Retrieved June 9, 2017.
- ↑ "U.S. Decennial Census". United States Census Bureau. Retrieved June 11, 2014.
- ↑ "Historical Census Browser". University of Virginia Library. Retrieved June 11, 2014.
- ↑ "Population of Counties by Decennial Census: 1900 to 1990". United States Census Bureau. Retrieved June 11, 2014.
- ↑ "Census 2000 PHC-T-4. Ranking Tables for Counties: 1990 and 2000" (PDF). United States Census Bureau. Retrieved June 11, 2014.
- ↑ "American FactFinder". United States Census Bureau. Retrieved 2011-05-14.
- ↑ Leip, David. "Dave Leip's Atlas of U.S. Presidential Elections". uselectionatlas.org. Retrieved May 26, 2017.
- ↑ Dave Leip’s U.S. Election Atlas; 1990 Gubernatorial General Election Results – Colorado
- ↑ Dave Leip’s U.S. Election Atlas; 2010 Gubernatorial General Election Results – Colorado
- ↑ Dave Leip’s U.S. Election Atlas; 1992 Senatorial General Election Results – Colorado
External links
| Wikimedia Commons has media related to Rio Blanco County, Colorado. |
- Rio Blanco County Government website
- Colorado County Evolution by Don Stanwyck
- Colorado Historical Society
Places adjacent to Rio Blanco County, Colorado | ||||||||||
|---|---|---|---|---|---|---|---|---|---|---|
| ||||||||||
Municipalities and communities of Rio Blanco County, Colorado, United States | ||
|---|---|---|
| Towns | | |
| Unincorporated community | ||