Greenlee County, Arizona
| Greenlee County, Arizona | ||
|---|---|---|
 | ||
| ||
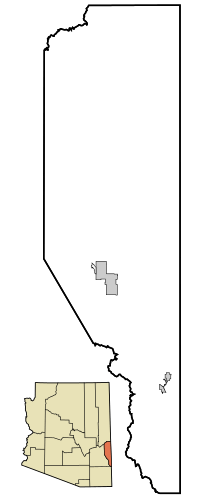
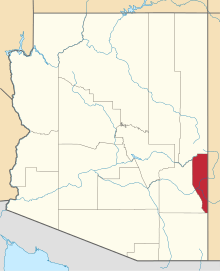 Location in the U.S. state of Arizona | ||
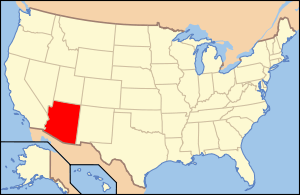 Arizona's location in the U.S. | ||
| Founded | March 10, 1909 | |
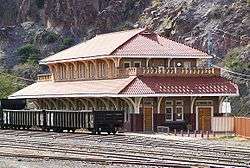
| Seat | Clifton | |
| Largest town | Clifton | |
| Area | ||
| • Total | 1,848 sq mi (4,786 km2) | |
| • Land | 1,843 sq mi (4,773 km2) | |
| • Water | 5.3 sq mi (14 km2), 0.3% | |
| Population (est.) | ||
| • (2017) | 9,455 | |
| • Density | 5.1/sq mi (2.0/km2) | |
| Congressional district | 1st | |
| Time zone | Mountain: UTC−7 | |
| Website |
www | |

Greenlee County is a county located in the southeastern part of the U.S. state of Arizona. As of the 2010 census its population was 8,437,[1] making it the least populous county in Arizona. The county seat is Clifton.
The economy of Greenlee County is dominated by the Morenci Mine, the largest copper mining operation in North America, and one of the largest copper mines in the world. As of 2008, the mine complex, owned by Freeport-McMoRan, had about 4,000 employees.
History
Greenlee County was created in 1909 and named for Mason Greenlee who was an early settler in the Clifton area. It was Arizona's 14th county and formed from part of Graham County, which opposed the formation because Graham County would lose considerable revenue. Clifton has always been the county seat.
Geography
According to the U.S. Census Bureau, the county has a total area of 1,848 square miles (4,790 km2), of which 1,843 square miles (4,770 km2) is land and 5.3 square miles (14 km2) (0.3%) is water.[2] It is the second-smallest county by area in Arizona.
Adjacent counties
- Cochise County - south
- Graham County - west
- Apache County - north
- Catron County, New Mexico - east
- Grant County, New Mexico - east
- Hidalgo County, New Mexico - southeast
National protected areas
Major Highways
Demographics
| Historical population | |||
|---|---|---|---|
| Census | Pop. | %± | |
| 1920 | 15,362 | — | |
| 1930 | 9,886 | −35.6% | |
| 1940 | 8,698 | −12.0% | |
| 1950 | 12,805 | 47.2% | |
| 1960 | 11,509 | −10.1% | |
| 1970 | 10,330 | −10.2% | |
| 1980 | 11,406 | 10.4% | |
| 1990 | 8,008 | −29.8% | |
| 2000 | 8,547 | 6.7% | |
| 2010 | 8,437 | −1.3% | |
| Est. 2017 | 9,455 | [3] | 12.1% |
| U.S. Decennial Census[4] 1790–1960[5] 1900–1990[6] 1990–2000[7] 2010–2017[1] | |||
2000 census
As of the census[8] of 2000, there were 8,547 people, 3,117 households, and 2,266 families residing in the county. The population density was 5 people per square mile (2/km²). There were 3,744 housing units at an average density of 2 per square mile (1/km²). The racial makeup of the county was 74.17% White, 0.51% Black or African American, 1.66% Native American, 0.15% Asian, 0.04% Pacific Islander, 20.02% from other races, and 3.45% from two or more races. 43.07% of the population were Hispanic or Latino of any race. 25.19% reported speaking Spanish at home .
There were 3,117 households out of which 39.20% had children under the age of 18 living with them, 58.30% were married couples living together, 9.00% had a female householder with no husband present, and 27.30% were non-families. 24.50% of all households were made up of individuals and 7.30% had someone living alone who was 65 years of age or older. The average household size was 2.73 and the average family size was 3.26.
In the county, the population was spread out with 31.70% under the age of 18, 7.50% from 18 to 24, 28.20% from 25 to 44, 22.60% from 45 to 64, and 9.90% who were 65 years of age or older. The median age was 34 years. For every 100 females, there were 109.20 males. For every 100 females age 18 and over, there were 108.00 males.
The median income for a household in the county was $39,384, and the median income for a family was $43,523. Males had a median income of $38,952 versus $23,333 for females. The per capita income for the county was $15,814. About 8.00% of families and 9.90% of the population were below the poverty line, including 11.10% of those under age 18 and 8.70% of those age 65 or over.
2010 census
As of the 2010 United States Census, there were 8,437 people, 3,188 households, and 2,152 families residing in the county.[9] The population density was 4.6 inhabitants per square mile (1.8/km2). There were 4,372 housing units at an average density of 2.4 per square mile (0.93/km2).[10] The racial makeup of the county was 77.2% white, 2.3% American Indian, 1.1% black or African American, 0.5% Asian, 0.1% Pacific islander, 15.0% from other races, and 3.8% from two or more races. Those of Hispanic or Latino origin made up 47.9% of the population.[9] In terms of ancestry, 12.9% were English, 12.1% were German, 10.6% were Irish, and 1.6% were American.[11]
Of the 3,188 households, 37.5% had children under the age of 18 living with them, 49.5% were married couples living together, 9.6% had a female householder with no husband present, 32.5% were non-families, and 27.8% of all households were made up of individuals. The average household size was 2.64 and the average family size was 3.21. The median age was 34.8 years.[9]
The median income for a household in the county was $48,696 and the median income for a family was $51,729. Males had a median income of $50,446 versus $34,171 for females. The per capita income for the county was $21,281. About 9.4% of families and 13.5% of the population were below the poverty line, including 17.8% of those under age 18 and 13.2% of those age 65 or over.[12]
Politics
Greenlee County used to be the most reliably Democratic county in Arizona. It voted for the Democratic presidential candidate in every election from 1912 to 1996, being one of only seven Mountain State counties to support George McGovern.[lower-alpha 1] However, it has supported the Republican candidate in each of the five most recent presidential elections.
| Year | Republican | Democratic | Others |
|---|---|---|---|
| 2016 | 57.3% 1,892 | 33.1% 1,092 | 9.6% 316 |
| 2012 | 53.3% 1,592 | 43.9% 1,310 | 2.8% 84 |
| 2008 | 58.6% 1,712 | 39.9% 1,165 | 1.5% 43 |
| 2004 | 61.9% 1,899 | 37.4% 1,146 | 0.7% 22 |
| 2000 | 54.7% 1,619 | 41.1% 1,216 | 4.2% 125 |
| 1996 | 34.2% 1,159 | 51.7% 1,755 | 14.1% 479 |
| 1992 | 36.3% 1,451 | 42.5% 1,695 | 21.2% 847 |
| 1988 | 46.2% 1,526 | 52.5% 1,733 | 1.3% 43 |
| 1984 | 47.6% 1,801 | 51.9% 1,963 | 0.6% 21 |
| 1980 | 40.6% 1,537 | 54.0% 2,043 | 5.3% 202 |
| 1976 | 36.1% 1,532 | 61.2% 2,601 | 2.7% 114 |
| 1972 | 45.6% 1,758 | 52.2% 2,013 | 2.3% 87 |
| 1968 | 27.4% 1,026 | 64.9% 2,434 | 7.8% 291 |
| 1964 | 26.5% 1,132 | 73.6% 3,147 | |
| 1960 | 29.9% 1,313 | 70.0% 3,069 | 0.1% 4 |
| 1956 | 39.7% 1,784 | 60.3% 2,711 | |
| 1952 | 31.3% 1,377 | 68.7% 3,019 | |
| 1948 | 23.0% 680 | 69.9% 2,069 | 7.2% 212 |
| 1944 | 27.3% 739 | 72.3% 1,956 | 0.3% 9 |
| 1940 | 22.1% 619 | 77.6% 2,175 | 0.3% 9 |
| 1936 | 12.3% 218 | 86.2% 1,526 | 1.5% 27 |
| 1932 | 19.3% 377 | 79.7% 1,558 | 1.0% 19 |
| 1928 | 42.1% 685 | 57.4% 935 | 0.5% 8 |
| 1924 | 30.0% 404 | 57.0% 768 | 13.1% 176 |
| 1920 | 44.5% 905 | 55.6% 1,131 | |
| 1916 | 28.8% 672 | 63.9% 1,492 | 7.3% 170 |
| 1912 | 9.3% 109 | 55.5% 652 | 35.2% 413 |
The county is located in Arizona's 1st congressional district, which has a Cook Partisan Voting Index of R+2 and is represented by Democratic Congressman Tom O'Halleran. In the Arizona House of Representatives it is represented by Republican Becky Nutt and Republican Drew John.[15] In the Arizona Senate it is represented by Republican Gail Griffin.[16]
Communities
Towns
Ghost Towns in this County
Census-designated places
Other communities
- Blue
- Blue Vista
- Hannagan Meadow
- Loma Linda
- Sheldon
- Three Way
- Verde Lee
County population ranking
The population ranking of the following table is based on the 2010 census of Greenlee County.[17][18]
† county seat
| Rank | City/Town/etc. | Population (2010 Census) | Municipal type | Incorporated |
|---|---|---|---|---|
| 1 | † Clifton | 3,311 | Town | |
| 2 | Morenci | 1,489 | CDP | |
| 3 | Duncan | 696 | Town | 1938 |
| 4 | York | 557 | CDP | |
| 5 | Franklin | 92 | CDP |
See also
References
- 1 2 "State & County QuickFacts". United States Census Bureau. Archived from the original on July 11, 2011. Retrieved May 18, 2014.
- ↑ "2010 Census Gazetteer Files". United States Census Bureau. August 23, 2012. Retrieved August 23, 2015.
- ↑ "Population and Housing Unit Estimates". Retrieved June 9, 2017.
- ↑ "U.S. Decennial Census". United States Census Bureau. Archived from the original on May 12, 2015. Retrieved May 18, 2014.
- ↑ "Historical Census Browser". University of Virginia Library. Retrieved May 18, 2014.
- ↑ "Population of Counties by Decennial Census: 1900 to 1990". United States Census Bureau. Retrieved May 18, 2014.
- ↑ "Census 2000 PHC-T-4. Ranking Tables for Counties: 1990 and 2000" (PDF). United States Census Bureau. Retrieved May 18, 2014.
- ↑ "American FactFinder". United States Census Bureau. Archived from the original on 2013-09-11. Retrieved 2011-05-14.
- 1 2 3 "DP-1 Profile of General Population and Housing Characteristics: 2010 Demographic Profile Data". United States Census Bureau. Retrieved 2016-01-20.
- ↑ "Population, Housing Units, Area, and Density: 2010 - County". United States Census Bureau. Retrieved 2016-01-20.
- ↑ "DP02 SELECTED SOCIAL CHARACTERISTICS IN THE UNITED STATES – 2006-2010 American Community Survey 5-Year Estimates". United States Census Bureau. Retrieved 2016-01-20.
- ↑ "DP03 SELECTED ECONOMIC CHARACTERISTICS – 2006-2010 American Community Survey 5-Year Estimates". United States Census Bureau. Retrieved 2016-01-20.
- ↑ "Dave Leip's Atlas of United States Presidential Elections". Retrieved 2011-06-11.
- ↑ Scammon, Richard M. (compiler); America at the Polls: A Handbook of Presidential Election Statistics 1920-1964; pp. 487-489 ISBN 0405077114
- ↑ Member Roster at Arizona Legislature
- ↑ Member Roster for Arizona Senate
- ↑ "Archived copy". Archived from the original on 2013-12-21. Retrieved 2013-02-10.
- ↑ https://www.census.gov/geo/maps-data/maps/block/2010/
Notes
- ↑ The others were Deer Lodge and Silver Bow in Montana, Costilla and Pitkin in Colorado, plus San Miguel and Rio Arriba in New Mexico
External links
Coordinates: 33°06′06″N 109°16′07″W / 33.10167°N 109.26861°W
Places adjacent to Greenlee County, Arizona | ||||||||||
|---|---|---|---|---|---|---|---|---|---|---|
| ||||||||||
| Wikimedia Commons has media related to Greenlee County, Arizona. |
Municipalities and communities of Greenlee County, Arizona, United States | ||
|---|---|---|
| Towns | | |
| CDPs | ||
| Populated places | ||