Santa Cruz County, Arizona
| Santa Cruz County, Arizona | ||
|---|---|---|
 Santa Cruz County Courthouse | ||
| ||
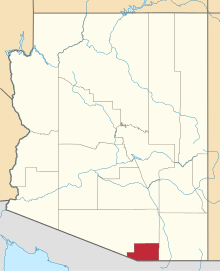 Location in the U.S. state of Arizona | ||
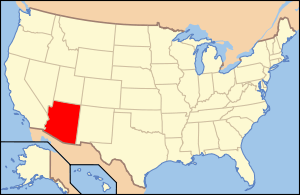 Arizona's location in the U.S. | ||
| Founded | March 15, 1899 | |
| Seat | Nogales | |
| Largest city | Nogales | |
| Area | ||
| • Total | 1,238 sq mi (3,206 km2) | |
| • Land | 1,237 sq mi (3,204 km2) | |
| • Water | 1.2 sq mi (3 km2), 0.1% | |
| Population (est.) | ||
| • (2017) | 46,212 | |
| • Density | 38/sq mi (15/km2) | |
| Congressional district | 3rd | |
| Time zone | Mountain: UTC−7 | |
| Website |
www | |

Santa Cruz is a county in southern Arizona. As of the 2010 census, its population is 47,420.[1] The county seat is Nogales.[2] The county was established in 1899. It borders Pima County to the north and west, Cochise County to the east, and the Mexican state of Sonora to the south.
Santa Cruz County includes the Nogales, Arizona Micropolitan Statistical Area, which is also included in the Tucson-Nogales, Arizona Combined Statistical Area.
History
Santa Cruz County, formed on March 15, 1899, out of what was then Pima County, is named after the Santa Cruz River, which was named in the late 17th century by Father Kino. Santa Cruz means "holy cross" in Spanish. After that Father Kino built the famous mission which still stands today at the Tumacácori National Historical Park.[3][4]
Geography
According to the U.S. Census Bureau, the county has a total area of 1,238 square miles (3,210 km2), of which 1,237 square miles (3,200 km2) is land and 1.2 square miles (3.1 km2) (0.1%) is water.[5] It is the smallest county by area in Arizona.
Adjacent counties and municipalities
- Pima County - west, north
- Cochise County - east
- Nogales, Sonora, Mexico - south
- Santa Cruz, Sonora, Mexico - south
- Sáric, Sonora, Mexico - southwest
Major highways
National protected areas
Demographics
| Historical population | |||
|---|---|---|---|
| Census | Pop. | %± | |
| 1900 | 4,545 | — | |
| 1910 | 6,766 | 48.9% | |
| 1920 | 12,689 | 87.5% | |
| 1930 | 9,684 | −23.7% | |
| 1940 | 9,482 | −2.1% | |
| 1950 | 9,417 | −0.7% | |
| 1960 | 10,808 | 14.8% | |
| 1970 | 13,966 | 29.2% | |
| 1980 | 20,459 | 46.5% | |
| 1990 | 29,676 | 45.1% | |
| 2000 | 38,381 | 29.3% | |
| 2010 | 47,420 | 23.6% | |
| Est. 2017 | 46,212 | [6] | −2.5% |
| U.S. Decennial Census[7] 1790–1960[8] 1900–1990[9] 1990–2000[10] 2010–2017[1] | |||
2000 census
As of the 2000 census, there were 38,381 people, 11,809 households, and 9,506 families residing in the county. The population density was 31 people per square mile (12/km²). There were 13,036 housing units at an average density of 10 per square mile (4/km²). The racial makeup of the county was 76.00% White, 0.38% Black or African American, 0.65% Native American, 0.52% Asian, 0.09% Pacific Islander, 19.73% from other races, and 2.63% from two or more races. 80.78% of the population were Hispanic or Latino of any race. 79.71% of the population reported speaking Spanish at home, while 19.51% speak English .
There were 11,809 households, of which 45.60% had children under the age of 18 living with them, 61.30% were married couples living together, 15.40% had a female householder with no husband present, and 19.50% were non-families. 16.50% of all households were made up of individuals and 7.10% had someone living alone who was 65 years of age or older. The average household size was 3.23 and the average family size was 3.66.
In the county, the population was spread out with 33.60% under the age of 18, 8.20% from 18 to 24, 26.60% from 25 to 44, 20.80% from 45 to 64, and 10.70% who were 65 years of age or older. The median age was 32 years. For every 100 females there were 91.70 males. For every 100 females age 18 and over, there were 86.20 males.
The median income for a household in the county was $29,710, and the median income for a family was $32,057. Males had a median income of $27,972 versus $21,107 for females. The per capita income for the county was $13,278. About 21.40% of families and 24.50% of the population were below the poverty line, including 29.70% of those under age 18 and 23.20% of those age 65 or over.
2010 census
As of the 2010 United States Census, there were 47,420 people, 15,437 households, and 11,992 families residing in the county.[11] The population density was 38.3 inhabitants per square mile (14.8/km2). There were 18,010 housing units at an average density of 14.6 per square mile (5.6/km2).[12] The racial makeup of the county was 73.5% white, 0.7% American Indian, 0.5% Asian, 0.4% black or African American, 22.9% from other races, and 2.0% from two or more races. Those of Hispanic or Latino origin made up 82.8% of the population.[11]
The largest ancestry groups were:[13]
Of the 15,437 households, 45.6% had children under the age of 18 living with them, 55.7% were married couples living together, 17.1% had a female householder with no husband present, 22.3% were non-families, and 19.0% of all households were made up of individuals. The average household size was 3.05 and the average family size was 3.51. The median age was 35.6 years.[11]
The median income for a household in the county was $36,519 and the median income for a family was $40,933. Males had a median income of $30,666 versus $25,135 for females. The per capita income for the county was $16,209. About 20.6% of families and 25.2% of the population were below the poverty line, including 36.8% of those under age 18 and 15.7% of those age 65 or over.[14]
Communities
City
- Nogales (county seat)
Towns
Ghost towns
Census-designated places
Unincorporated communities
County population ranking
The population ranking of the following table is based on the 2010 census of Santa Cruz County.[15][16]
† county seat
| Rank | City/Town/etc. | Population (2010 Census) | Municipal type | Incorporated |
|---|---|---|---|---|
| 1 | † Nogales | 20,837 | City | |
| 2 | Rio Rico | 18,962 | CDP | |
| 3 | Tubac | 1,191 | CDP | |
| 4 | Patagonia | 913 | Town | |
| 5 | Sonoita | 818 | CDP | |
| 6 | Tumacacori-Carmen | 393 | CDP | |
| 7 | Amado | 295 | CDP | |
| 8 | Beyerville | 177 | CDP | |
| 9 | Elgin | 161 | CDP | |
| 10 | Kino Springs | 136 | CDP |
Politics
Owing to its border location and Hispanic majority population, Santa Cruz is a strongly Democratic county. The last Republican to win the county was George Bush senior in 1988, and although the Republicans won the county in six consecutive election from 1968 to 1988, three of these wins were by very narrow margins. Increasing immigration and fear of Republican opposition thereto has turned it even more solidly blue: in 2016 Hillary Clinton won over 70 percent of the county’s vote, approaching figures typical of long-time Democratic strongholds in South Texas. In the process it took over from Apache County as the most Democratic of the state’s counties.
| Year | Republican | Democrat | Others |
|---|---|---|---|
| 2016 | 23.7% 3,897 | 71.1% 11,690 | 5.2% 846 |
| 2012 | 30.4% 4,235 | 68.2% 9,486 | 1.4% 190 |
| 2008 | 33.9% 4,518 | 65.1% 8,683 | 1.1% 143 |
| 2004 | 39.9% 4,668 | 59.1% 6,909 | 1.0% 112 |
| 2000 | 37.6% 3,344 | 58.8% 5,233 | 3.6% 316 |
| 1996 | 27.6% 2,256 | 64.2% 5,241 | 8.2% 670 |
| 1992 | 37.4% 3,024 | 43.5% 3,512 | 19.1% 1,544 |
| 1988 | 49.6% 3,320 | 48.9% 3,268 | 1.5% 102 |
| 1984 | 60.3% 3,855 | 38.6% 2,463 | 1.1% 71 |
| 1980 | 50.1% 2,674 | 39.1% 2,089 | 10.8% 577 |
| 1976 | 48.8% 2,312 | 47.8% 2,265 | 3.4% 161 |
| 1972 | 52.4% 2,137 | 45.8% 1,866 | 1.9% 76 |
| 1968 | 48.2% 1,702 | 44.1% 1,557 | 7.8% 274 |
| 1964 | 43.4% 1,503 | 56.5% 1,955 | 0.1% 2 |
| 1960 | 40.4% 1,265 | 59.6% 1,868 | 0.1% 2 |
| 1956 | 59.3% 1,646 | 40.7% 1,131 | 0.0% 1 |
| 1952 | 55.7% 1,716 | 44.3% 1,365 | |
| 1948 | 42.0% 1,058 | 56.5% 1,424 | 1.5% 37 |
| 1944 | 36.0% 727 | 63.9% 1,291 | 0.2% 4 |
| 1940 | 38.9% 978 | 61.1% 1,536 | 0.1% 2 |
| 1936 | 29.3% 742 | 68.3% 1,729 | 2.3% 59 |
| 1932 | 27.7% 625 | 71.1% 1,606 | 1.3% 29 |
| 1928 | 48.8% 919 | 51.1% 962 | 0.2% 3 |
| 1924 | 39.9% 579 | 46.4% 673 | 13.7% 198 |
| 1920 | 54.6% 850 | 45.4% 706 | |
| 1916 | 46.2% 666 | 50.4% 726 | 3.5% 50 |
| 1912 | 11.9% 56 | 53.3% 250 | 34.8% 163 |
See also
| Wikimedia Commons has media related to Santa Cruz County, Arizona. |
References
- 1 2 "State & County QuickFacts". United States Census Bureau. Retrieved May 18, 2014.
- ↑ "Find a County". National Association of Counties. Retrieved 2011-06-07.
- ↑ "History: Pima County". Pima County Justice Court. September 27, 2000. Archived from the original on May 27, 2010. Retrieved 2009-09-30.
- ↑ "Santa Cruz County". Arizona State Library Archives and Public Records: Arizona History and Archives Division. August 4, 2009. Archived from the original on September 15, 2009. Retrieved 2009-09-30.
- ↑ "2010 Census Gazetteer Files". United States Census Bureau. August 23, 2012. Retrieved August 23, 2015.
- ↑ "Population and Housing Unit Estimates". Retrieved June 9, 2017.
- ↑ "U.S. Decennial Census". United States Census Bureau. Retrieved May 18, 2014.
- ↑ "Historical Census Browser". University of Virginia Library. Retrieved May 18, 2014.
- ↑ "Population of Counties by Decennial Census: 1900 to 1990". United States Census Bureau. Retrieved May 18, 2014.
- ↑ "Census 2000 PHC-T-4. Ranking Tables for Counties: 1990 and 2000" (PDF). United States Census Bureau. Retrieved May 18, 2014.
- 1 2 3 "DP-1 Profile of General Population and Housing Characteristics: 2010 Demographic Profile Data". United States Census Bureau. Retrieved 2016-01-20.
- ↑ "Population, Housing Units, Area, and Density: 2010 - County". United States Census Bureau. Retrieved 2016-01-20.
- ↑ "DP02 SELECTED SOCIAL CHARACTERISTICS IN THE UNITED STATES – 2006-2010 American Community Survey 5-Year Estimates". United States Census Bureau. Retrieved 2016-01-20.
- ↑ "DP03 SELECTED ECONOMIC CHARACTERISTICS – 2006-2010 American Community Survey 5-Year Estimates". United States Census Bureau. Retrieved 2016-01-20.
- ↑ https://www.census.gov/2010census/
- ↑ https://www.census.gov/geo/maps-data/maps/block/2010/
- ↑ "Dave Leip's Atlas of United States Presidential Elections". Retrieved 2011-06-11.
- ↑ Scammon, Richard M. (compiler); America at the Polls: A Handbook of Presidential Election Statistics 1920-1964; pp. 42-44 ISBN 0405077114
External links
- Nogales Chamber of Commerce Website
- County Website
- Geologic Map of the Patagonia Mountains, Santa Cruz County, Arizona U.S. Geological Survey
Places adjacent to Santa Cruz County, Arizona | ||||||||||
|---|---|---|---|---|---|---|---|---|---|---|
| ||||||||||
Municipalities and communities of Santa Cruz County, Arizona, United States | ||
|---|---|---|
| City | | |
| Town | ||
| CDPs | ||
| Populated places | ||
| Ghost towns | ||