Montague County, Texas
| Montague County, Texas | |
|---|---|
| County | |
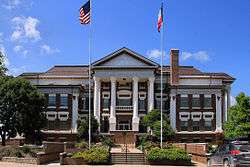 The Montague County Courthouse in Montague | |
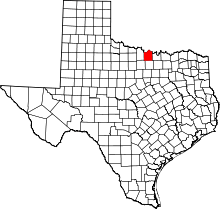 Location in the U.S. state of Texas | |
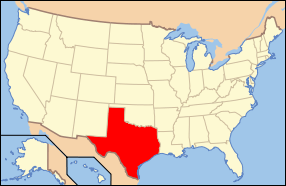 Texas's location in the U.S. | |
| Founded | 1858 |
| Seat | Montague |
| Largest city | Bowie |
| Area | |
| • Total | 938 sq mi (2,429 km2) |
| • Land | 931 sq mi (2,411 km2) |
| • Water | 7.4 sq mi (19 km2), 0.8% |
| Population | |
| • (2010) | 19,719 |
| • Density | 21/sq mi (8/km2) |
| Congressional district | 13th |
| Time zone | Central: UTC−6/−5 |
| Website |
www |
Montague County (/ˈmɒnteɪɡ/ MAHN-tayg)[1][2] is a county located in the U.S. state of Texas, established in 1857. As of the 2010 census, its population was 19,719.[3] The county seat is Montague.[4] The county was created in 1857 and organized the next year.[5] It is named for Daniel Montague, a surveyor and soldier in the Mexican–American War.
Republican Drew Springer, Jr., a businessman from Muenster in Cooke County, has since January 2013 represented Montague County in the Texas House of Representatives. He carried the county in the 2012 Republican runoff election.[6]
History
On July 9, 2001, Texas Governor Rick Perry issued a state of disaster for Montague County relating to substantial fires which had ravaged large portions of the county.[7] In later interviews, Perry called the fire "the most vicious" he'd ever seen.[8]
On September 26, 2009, an historical marker on the Chisholm Trail was unveiled at the site of the former community of Red River Station in Montague County. The 5.5-foot concrete marker is the last of twelve erected in Montague County as part of a joint project of the Texas Lakes Trail and the Montague County Historical Commission to outline the Chisholm Trail.[9]
Geography
According to the U.S. Census Bureau, the county has a total area of 938 square miles (2,430 km2), of which 931 square miles (2,410 km2) is land and 7.4 square miles (19 km2) (0.8%) is water.[10]
Adjacent counties
- Jefferson County, Oklahoma (north)
- Love County, Oklahoma (northeast)
- Cooke County (east)
- Wise County (south)
- Jack County (southwest)
- Clay County (west)
National protected area
Demographics
| Historical population | |||
|---|---|---|---|
| Census | Pop. | %± | |
| 1860 | 849 | — | |
| 1870 | 890 | 4.8% | |
| 1880 | 11,257 | 1,164.8% | |
| 1890 | 18,863 | 67.6% | |
| 1900 | 24,800 | 31.5% | |
| 1910 | 25,123 | 1.3% | |
| 1920 | 22,200 | −11.6% | |
| 1930 | 19,159 | −13.7% | |
| 1940 | 20,442 | 6.7% | |
| 1950 | 17,070 | −16.5% | |
| 1960 | 14,893 | −12.8% | |
| 1970 | 15,326 | 2.9% | |
| 1980 | 17,410 | 13.6% | |
| 1990 | 17,274 | −0.8% | |
| 2000 | 19,117 | 10.7% | |
| 2010 | 19,719 | 3.1% | |
| Est. 2016 | 19,414 | [11] | −1.5% |
| U.S. Decennial Census[12] 1850–2010[13] 2010–2014[3] | |||
As of the census[14] of 2000, there were 19,117 people, 7,770 households, and 5,485 families residing in the county. The population density was 20 people per square mile (8/km²). There were 9,862 housing units at an average density of 11 per square mile (4/km²). The racial makeup of the county was 95.95% White, 0.18% Black or African American, 0.74% Native American, 0.26% Asian, 0.03% Pacific Islander, 1.64% from other races, and 1.21% from two or more races. 5.41% of the population were Hispanic or Latino of any race.
There were 7,770 households out of which 28.70% had children under the age of 18 living with them, 58.10% were married couples living together, 8.80% had a female householder with no husband present, and 29.40% were non-families. 27.10% of all households were made up of individuals and 14.70% had someone living alone who was 65 years of age or older. The average household size was 2.41 and the average family size was 2.91.
In the county, the population was spread out with 24.00% under the age of 18, 6.80% from 18 to 24, 24.30% from 25 to 44, 25.10% from 45 to 64, and 19.80% who were 65 years of age or older. The median age was 41 years. For every 100 females there were 92.50 males. For every 100 females age 18 and over, there were 89.80 males.
The median income for a household in the county was $31,048, and the median income for a family was $38,226. Males had a median income of $31,585 versus $19,589 for females. The per capita income for the county was $17,115. About 10.00% of families and 14.00% of the population were below the poverty line, including 17.80% of those under age 18 and 11.90% of those age 65 or over.
Education
The following school districts serve Montague County:
- Alvord ISD (mostly in Wise County)
- Bowie ISD (small portion in Clay, Jack counties)
- Forestburg ISD
- Gold-Burg ISD (small portion in Clay County)
- Montague ISD
- Nocona ISD
- Prairie Valley ISD
- Saint Jo ISD (small portion in Cooke County)
- Slidell ISD (partly in Wise, Denton counties; small portion in Cooke County)
In addition, a branch of North Central Texas College operates in Bowie.
Transportation
Major highways
Farm to Market Roads
Communities
Cities
Census-designated places
Other unincorporated communities
Ghost town
Politics
| Year | Republican | Democratic | Third parties |
|---|---|---|---|
| 2016 | 87.5% 7,526 | 10.3% 885 | 2.2% 193 |
| 2012 | 84.5% 6,549 | 14.4% 1,116 | 1.1% 86 |
| 2008 | 78.6% 6,245 | 20.1% 1,597 | 1.4% 108 |
| 2004 | 74.8% 5,910 | 24.6% 1,946 | 0.5% 41 |
| 2000 | 67.5% 4,951 | 30.8% 2,256 | 1.7% 123 |
| 1996 | 45.7% 3,029 | 41.0% 2,718 | 13.3% 879 |
| 1992 | 30.6% 2,304 | 38.3% 2,885 | 31.1% 2,337 |
| 1988 | 48.4% 3,475 | 51.3% 3,689 | 0.3% 22 |
| 1984 | 62.7% 4,406 | 37.0% 2,602 | 0.3% 22 |
| 1980 | 48.6% 3,143 | 50.0% 3,233 | 1.5% 96 |
| 1976 | 34.7% 2,182 | 64.9% 4,087 | 0.4% 25 |
| 1972 | 72.6% 3,463 | 27.0% 1,286 | 0.4% 19 |
| 1968 | 33.4% 1,736 | 49.1% 2,555 | 17.6% 914 |
| 1964 | 22.8% 1,106 | 77.1% 3,746 | 0.1% 4 |
| 1960 | 47.1% 2,101 | 52.5% 2,346 | 0.4% 18 |
| 1956 | 45.8% 2,003 | 53.9% 2,358 | 0.3% 11 |
| 1952 | 44.0% 2,367 | 56.0% 3,012 | 0.1% 4 |
| 1948 | 13.4% 475 | 80.7% 2,872 | 5.9% 210 |
| 1944 | 11.6% 429 | 78.2% 2,900 | 10.3% 381 |
| 1940 | 13.6% 530 | 86.2% 3,352 | 0.2% 6 |
| 1936 | 10.4% 324 | 89.2% 2,789 | 0.5% 15 |
| 1932 | 7.8% 262 | 91.4% 3,090 | 0.9% 29 |
| 1928 | 51.1% 1,519 | 48.9% 1,452 | |
| 1924 | 17.9% 586 | 68.4% 2,236 | 13.7% 447 |
| 1920 | 19.8% 474 | 71.6% 1,714 | 8.6% 207 |
| 1916 | 10.7% 245 | 78.6% 1,803 | 10.8% 247 |
| 1912 | 7.0% 151 | 71.3% 1,531 | 21.6% 464 |
See also
References
- ↑ "How to Pronounce: M Cities". 23 September 2014. Retrieved 20 May 2018.
- ↑ "Texas Almanac Town Pronunciation Guide" (PDF).
- 1 2 "State & County QuickFacts". United States Census Bureau. Archived from the original on July 15, 2011. Retrieved December 22, 2013.
- ↑ "Find a County". National Association of Counties. Retrieved 2011-06-07.
- ↑ "Texas: Individual County Chronologies". Texas Atlas of Historical County Boundaries. The Newberry Library. 2008. Retrieved May 25, 2015.
- ↑ "State Rep. Springer announces district tour July 30". Lubbock Avalanche-Journal. July 16, 2013. Retrieved July 18, 2013.
- ↑ Perry, Rick (2009-04-09). "Declaration" (PDF). Gubernatorial declaration. Office of the Governor, State of Texas. p. 1. Archived from the original (PDF) on 2011-06-08. Retrieved 2009-04-18.
- ↑ "Perry Surveys Wildfire Damage, Thanks Firefighters From 40 Departments". Tyler Morning Telegraph. 2009-04-18. pp. 5A.
- ↑ Wichita Falls Times Record News, September 27, 2009
- ↑ "2010 Census Gazetteer Files". United States Census Bureau. August 22, 2012. Retrieved May 4, 2015.
- ↑ "Population and Housing Unit Estimates". Retrieved June 9, 2017.
- ↑ "U.S. Decennial Census". United States Census Bureau. Retrieved May 4, 2015.
- ↑ "Texas Almanac: Population History of Counties from 1850–2010" (PDF). Texas Almanac. Retrieved May 4, 2015.
- ↑ "American FactFinder". United States Census Bureau. Retrieved 2011-05-14.
- ↑ Leip, David. "Dave Leip's Atlas of U.S. Presidential Elections". uselectionatlas.org. Retrieved 20 May 2018.
External links
- Montague County government's website
- Montague County in Handbook of Texas Online at the University of Texas
- Historic Montague County materials, hosted by the Portal to Texas History.
- Montague County QuickFacts from the US Census Bureau
Places adjacent to Montague County, Texas | ||||||||||
|---|---|---|---|---|---|---|---|---|---|---|
| ||||||||||
Municipalities and communities of Montague County, Texas, United States | ||
|---|---|---|
| Cities | | |
| CDPs | ||
| Other unincorporated communities | ||
| Ghost town | ||