Randall County, Texas
| Randall County, Texas | ||
|---|---|---|
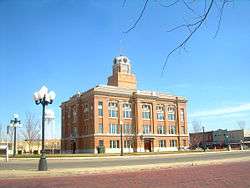 The Randall County Courthouse in 2011 | ||
| ||
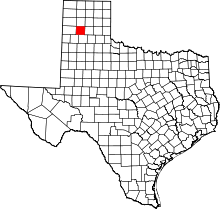 Location in the U.S. state of Texas | ||
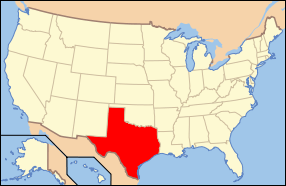 Texas's location in the U.S. | ||
| Founded | 1889 | |
| Named for | Horace Randal | |
| Seat | Canyon | |
| Largest city | Amarillo | |
| Area | ||
| • Total | 922 sq mi (2,388 km2) | |
| • Land | 912 sq mi (2,362 km2) | |
| • Water | 11 sq mi (28 km2), 1.2% | |
| Population (est.) | ||
| • (2017) | 134,442[1] | |
| • Density | 147/sq mi (57/km2) | |
| Congressional district | 13th | |
| Time zone | Central: UTC−6/−5 | |
| Website |
www | |

Randall County is a county located in the U.S. state of Texas. As of the 2010 census, its population was 120,725.[2] Its county seat is Canyon.[3] The county was created in 1876 and later organized in 1889.[4] It is named for Horace Randal, a Confederate brigadier general killed at the Battle of Jenkins Ferry. The reason the county name differs from his is because the bill creating the county misspelled Randal's name.
Randall County is part of the Amarillo, Texas, Metropolitan Statistical Area.
At one time, the large JA Ranch, founded by Charles Goodnight and John George Adair, which reached into six counties, held acreage in Randall County.
Geography
According to the U.S. Census Bureau, the county has a total area of 922 square miles (2,390 km2), of which 912 square miles (2,360 km2) is land and 11 square miles (28 km2) (1.2%) is covered by water.[5]
Palo Duro Canyon, the second-largest canyon in the United States, is located in Randall County.
Major highways
Adjacent counties
- Potter County (north)
- Oldham County (northwest)
- Armstrong County (east)
- Carson County (northeast)
- Swisher County (south)
- Briscoe County (southeast)
- Castro County (southwest)
- Deaf Smith County (west)
National protected area
Demographics
| Historical population | |||
|---|---|---|---|
| Census | Pop. | %± | |
| 1880 | 3 | — | |
| 1890 | 187 | 6,133.3% | |
| 1900 | 963 | 415.0% | |
| 1910 | 3,312 | 243.9% | |
| 1920 | 3,675 | 11.0% | |
| 1930 | 7,071 | 92.4% | |
| 1940 | 7,185 | 1.6% | |
| 1950 | 13,774 | 91.7% | |
| 1960 | 33,913 | 146.2% | |
| 1970 | 53,885 | 58.9% | |
| 1980 | 75,062 | 39.3% | |
| 1990 | 89,673 | 19.5% | |
| 2000 | 104,312 | 16.3% | |
| 2010 | 120,725 | 15.7% | |
| Est. 2017 | 134,442 | [6] | 11.4% |
| U.S. Decennial Census[7] 1850–2010[8] 2010–2014[2] | |||
As of the census[9] of 2000, 104,312 people, 41,240 households, and 28,785 families resided in the county. The population density was 114 people per square mile (44/km²). The 43,261 housing units averaged 47 per square mile (18/km²). The racial makeup of the county was 90.44% White, 1.50% Black or African American, 0.65% Native American, 1.03% Asian, 0.03% Pacific Islander, 4.71% from other races, and 1.64% from two or more races. About 10.3% of the population were Hispanic or Latino of any race.
Of the 41,240 households, 33.90% had children under the age of 18 living with them, 57.50% were married couples living together, 9.20% had a female householder with no husband present, and 30.20% were not families; 25.40% of all households were made up of individuals, and 8.50% had someone living alone who was 65 years of age or older. The average household size was 2.49, and the average family size was 3.00.
In the county, the population was distributed as 26.10% under the age of 18, 11.20% from 18 to 24, 28.40% from 25 to 44, 22.40% from 45 to 64, and 11.90% who were 65 years of age or older. The median age was 35 years. For every 100 females, there were 94.70 males. For every 100 females age 18 and over, there were 91.20 males.
The median income for a household in the county was $42,712, and for a family was $52,420. Males had a median income of $36,333 versus $25,358 for females. The per capita income for the county was $21,840. About 5.70% of families and 8.10% of the population were below the poverty line, including 8.50% of those under age 18 and 6.60% of those age 65 or over.
Politics
Although once more Democratic-leaning, the county has become solidly Republican. The Republican candidate has carried the county in every presidential election since 1952, usually by overwhelming margins.[10] In the last five elections, no Republican candidate has received less than 61% of the county's vote,[11] and since 2000, Randall has been the nation’s most Republican "metropolitan" county outside of predominantly Mormon counties in Utah.[12]
Randall County was one of the more than 200 counties in Texas to cast the majority of its votes for Republican John McCain. McCain received 41,895 votes, which was 81% of the total, while Democrat Barack Obama received 9,461 votes, or 18% of the total, far below his national percentage.
| Year | Republican | Democratic | Third parties |
|---|---|---|---|
| 2016 | 80.0% 43,462 | 15.4% 8,367 | 4.6% 2,476 |
| 2012 | 83.4% 41,447 | 15.2% 7,574 | 1.4% 675 |
| 2008 | 80.9% 41,948 | 18.3% 9,468 | 0.8% 416 |
| 2004 | 83.4% 40,520 | 16.2% 7,849 | 0.5% 218 |
| 2000 | 81.2% 33,921 | 17.3% 7,209 | 1.6% 660 |
| 1996 | 71.3% 28,266 | 23.2% 9,177 | 5.5% 2,184 |
| 1992 | 61.6% 24,971 | 22.5% 9,119 | 15.9% 6,447 |
| 1988 | 76.3% 27,986 | 23.2% 8,492 | 0.5% 188 |
| 1984 | 83.1% 30,249 | 16.6% 6,044 | 0.3% 116 |
| 1980 | 73.7% 23,136 | 23.3% 7,323 | 2.9% 923 |
| 1976 | 64.5% 17,115 | 34.2% 9,074 | 1.3% 335 |
| 1972 | 83.1% 18,557 | 15.5% 3,470 | 1.3% 296 |
| 1968 | 61.3% 11,400 | 21.8% 4,060 | 16.8% 3,132 |
| 1964 | 56.5% 7,843 | 43.3% 6,016 | 0.2% 22 |
| 1960 | 67.8% 6,958 | 32.0% 3,282 | 0.3% 29 |
| 1956 | 62.3% 4,609 | 37.5% 2,774 | 0.2% 17 |
| 1952 | 69.3% 4,305 | 30.7% 1,905 | 0.1% 4 |
| 1948 | 26.1% 722 | 69.8% 1,936 | 4.1% 114 |
| 1944 | 19.3% 409 | 68.0% 1,439 | 12.6% 267 |
| 1940 | 17.7% 382 | 82.3% 1,779 | 0.1% 1 |
| 1936 | 7.9% 142 | 91.8% 1,656 | 0.3% 6 |
| 1932 | 14.1% 231 | 85.1% 1,394 | 0.8% 13 |
| 1928 | 52.7% 733 | 47.3% 659 | |
| 1924 | 18.2% 154 | 74.2% 627 | 7.6% 64 |
| 1920 | 33.2% 183 | 65.3% 360 | 1.5% 8 |
| 1916 | 14.9% 63 | 80.8% 341 | 4.3% 18 |
| 1912 | 6.3% 21 | 81.3% 269 | 12.4% 41 |
Communities
Cities
- Amarillo (partly in Potter County)
- Canyon (county seat)
Towns
- Happy (mostly in Swisher County)
Villages
Unincorporated communities
Ghost towns
See also
References
- ↑ "U.S. Census Bureau QuickFacts: Randall County, Texas". Census Bureau QuickFacts. Retrieved 29 July 2018.
- 1 2 "State & County QuickFacts". United States Census Bureau. Retrieved December 23, 2013.
- ↑ "Find a County". National Association of Counties. Retrieved 2011-06-07.
- ↑ "Texas: Individual County Chronologies". Texas Atlas of Historical County Boundaries. The Newberry Library. 2008. Retrieved May 26, 2015.
- ↑ "2010 Census Gazetteer Files". United States Census Bureau. August 22, 2012. Retrieved May 9, 2015.
- ↑ "Population and Housing Unit Estimates". Retrieved June 9, 2017.
- ↑ "U.S. Decennial Census". United States Census Bureau. Retrieved May 9, 2015.
- ↑ "Texas Almanac: Population History of Counties from 1850–2010" (PDF). Texas Almanac. Retrieved May 9, 2015.
- ↑ "American FactFinder". United States Census Bureau. Retrieved 2011-05-14.
- ↑ "Presidential election of 1952 - Map by counties". geoelections.free.fr. Retrieved 2018-07-29.
- ↑ "President Map - Election Results 2008 - The New York Times". elections.nytimes.com. Retrieved 29 July 2018.
- ↑ ‘100 Most Republican Counties in 2000 Presidential Election’; The American Statesman, September 17, 2004
- ↑ Leip, David. "Dave Leip's Atlas of U.S. Presidential Elections". uselectionatlas.org. Retrieved 2018-07-29.
External links
- Randall County government’s website
- Randall County TX Genealogy
- Randall County in Handbook of Texas Online at the University of Texas
- Historic Randall County materials, hosted by the Portal to Texas History.
- http://www.city-data.com/county/Randall_County-TX.html
- Randall County Profile from the Texas Association of Counties
- List of museums in the Texas Panhandle
- National Register of Historic Places listings in Randall County, Texas
Places adjacent to Randall County, Texas | ||||||||||
|---|---|---|---|---|---|---|---|---|---|---|
| ||||||||||
Municipalities and communities of Randall County, Texas, United States | ||
|---|---|---|
| Cities | | |
| Towns | ||
| Villages | ||
| Unincorporated communities | ||
| Ghost towns | ||
| Footnotes | ‡This populated place also has portions in an adjacent county or counties | |