Demographics of Texas
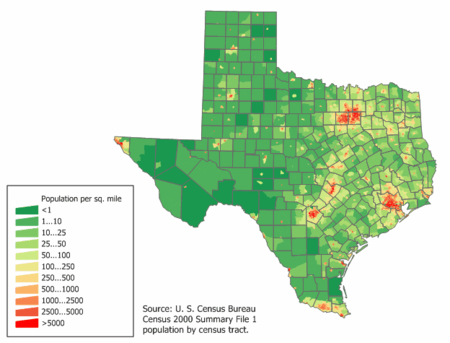
Texas is the second most populous U.S. state, with an estimated 2017 population of 28.449 million.[1] In recent decades, it has experienced strong population growth. Texas has many major cities and metropolitan areas, along with many towns and rural areas. Much of the population is in the major cities of Houston, San Antonio, Dallas, Fort Worth, Austin, and El Paso.
Population
| Historical population | |||
|---|---|---|---|
| Census | Pop. | %± | |
| 1850 | 212,592 | — | |
| 1860 | 604,215 | 184.2% | |
| 1870 | 818,579 | 35.5% | |
| 1880 | 1,591,749 | 94.5% | |
| 1890 | 2,235,527 | 40.4% | |
| 1900 | 3,048,710 | 36.4% | |
| 1910 | 3,896,542 | 27.8% | |
| 1920 | 4,663,228 | 19.7% | |
| 1930 | 5,824,715 | 24.9% | |
| 1940 | 6,414,824 | 10.1% | |
| 1950 | 7,711,194 | 20.2% | |
| 1960 | 9,579,677 | 24.2% | |
| 1970 | 11,196,730 | 16.9% | |
| 1980 | 14,229,191 | 27.1% | |
| 1990 | 16,986,510 | 19.4% | |
| 2000 | 20,851,820 | 22.8% | |
| 2010 | 25,145,561 | 20.6% | |
| Est. 2017 | 28,304,596 | 12.6% | |
| 1910 – 2010 census[2] 2016 Estimate[3] | |||
The 2010 US Census recorded Texas as having a population of 25.1 million—an increase of 4.3 million since the year 2000, involving an increase in population in all three subcategories of population growth: natural increase (births minus deaths), net immigration, and net migration. The state passed New York in the 1990s to become the second-largest U.S. state in population, after California.
Texas' population growth between 2000 and 2010 represents the highest population increase, by number of people, for any U.S. state during this time period. The large population increase can somewhat be attributed to Texas' relative insulation from the US housing bubble. The state has a bigger population than that of Australia.
As of 2012, the state has an estimated 4.1 million foreign-born residents, constituting approximately 15% of the state population[4] An estimated 1.7 million people are undocumented immigrants.[5]
U.S. Census data from 2010 indicate that 7.7% of Texas' population is under 5 years old, 27.3% is under 18, and 10.3% is aged 65 and older. Females make up 50.4% of the population.
The center of population of Texas is located at 30°54′19″N 97°21′56″W / 30.905244°N 97.365594°W in Bell County, in the town of Holland.[6]
Ethnicity
| By race | White | Black | AIAN* | Asian | NHPI* |
|---|---|---|---|---|---|
| 2000 (total population) | 84.54% | 12.09% | 1.09% | 3.13% | 0.16% |
| 2000 (Hispanic only) | 31.14% | 0.42% | 0.40% | 0.13% | 0.06% |
| 2005 (total population) | 84.14% | 12.09% | 1.10% | 3.62% | 0.17% |
| 2005 (Hispanic only) | 34.16% | 0.52% | 0.42% | 0.15% | 0.06% |
| Growth 2000–05 (total population) | 9.10% | 9.62% | 10.56% | 27.02% | 21.27% |
| Growth 2000–05 (non-Hispanic only) | 2.59% | 8.66% | 8.69% | 27.07% | 17.81% |
| Growth 2000–05 (Hispanic only) | 20.26% | 36.40% | 13.80% | 25.99% | 27.72% |
| * AIAN is American Indian or Alaskan Native; NHPI is Native Hawaiian or Pacific Islander | |||||
As of the 2010 US Census, the racial distribution in Texas was as follows: 70.4% of the population of Texas was White American; 11.8% African American; 3.8% Asian American; 0.7% American Indian; 0.1% native Hawaiian or Pacific islander only; 10.5% of the population were of some other race only; and 2.7% were of two or more races. Hispanics (of any race) were 37.6% of the population of the state, while Non-Hispanic Whites composed 45.3%.
English Americans predominate in eastern, central, and northern Texas; German Americans, in central and western Texas. African Americans, who historically made up one-third of the state population, are concentrated in parts of northern, eastern and east central Texas as well as in the Dallas-Fort Worth, Houston and San Antonio metropolitan areas.
As in other Southern states settled largely in the 19th century, the vast majority have European ancestry: Irish, English and German.[7] Texas includes a diverse set of European ancestries, due both to historical patterns of settlement as well as contemporary dynamics. Frontier Texas saw settlements of Germans, particularly in Fredericksburg and New Braunfels. Many Romanians, Dutch, Germans from Switzerland and Austria, Poles, Russians, Swedes, Norwegians, Czechs, Slovaks, Italians, and French immigrated at least in part because of the European revolutions of 1848. This immigration continued until World War I and the 1920s. The influence of these diverse European immigrants survives in the town names, architectural styles, music, and cuisine in Texas.
Lavaca County, for example, is over one-quarter Czech American, Seguin has a large Slovak American community, and Nederland has many Dutch Americans whose ancestors immigrated from the Netherlands.
| By race | White | Black | AIAN* | Asian | NHPI* |
|---|---|---|---|---|---|
| 2000 (total population) | 84.54% | 12.09% | 1.09% | 3.13% | 0.16% |
| 2000 (Hispanic only) | 31.14% | 0.42% | 0.40% | 0.13% | 0.06% |
| 2005 (total population) | 84.14% | 12.09% | 1.10% | 3.62% | 0.17% |
| 2005 (Hispanic only) | 34.16% | 0.52% | 0.42% | 0.15% | 0.06% |
| Growth 2000–05 (total population) | 9.10% | 9.62% | 10.56% | 27.02% | 21.27% |
| Growth 2000–05 (non-Hispanic only) | 2.59% | 8.66% | 8.69% | 27.07% | 17.81% |
| Growth 2000–05 (Hispanic only) | 20.26% | 36.40% | 13.80% | 25.99% | 27.72% |
| * AIAN is American Indian or Alaskan Native; NHPI is Native Hawaiian or Pacific Islander | |||||
In the 1980 United States Census the largest ancestry group reported in Texas was English, forming 3,083,323 or 27% of the population.[7] Their ancestry primarily goes back to the original thirteen colonies and for this reason many of them today simply claim American ancestry.
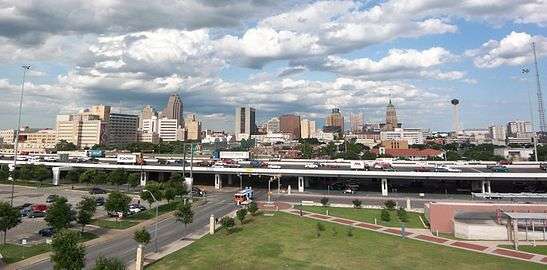
As of 2010, 37% of Texas residents had Hispanic ancestry; these include recent immigrants from Mexico, Central America, and South America, as well as Tejanos, whose ancestors have lived in Texas as early as the 1700s. Tejanos are the largest ancestry group in southern Duval County and amongst the largest in and around Bexar County, including San Antonio, where over one million Hispanics live. The state has the second largest Hispanic population in the United States, behind California.
Hispanics dominate southern, south-central, and western Texas and form a significant portion of the residents in the cities of Dallas, Houston, and Austin. The Hispanic population contributes to Texas having a younger population than the American average, because Hispanic births have outnumbered non-Hispanic white births since the early 1990s. In 2007, for the first time since the early nineteenth century, Hispanics accounted for more than half of all births (50.2%), while non-Hispanic whites accounted for just 34%.
In 2016 the state had 59,115 persons of Cuban origin. 6,157 of them lived in Travis County.[8]

Texas has one of the largest African-American populations in the country.[9] African Americans are concentrated in northern, eastern and east central Texas as well as the Dallas, Houston and San Antonio metropolitan areas. African Americans form 24 percent of both the cities of Dallas and Houston, 19% of Fort Worth, 8.1 percent of Austin, and 6.9 percent of San Antonio. They form a majority in sections of eastern San Antonio, southern Dallas, eastern Fort Worth, and southern Houston. A strong labor market between 1995 and 2000 contributed to Texas being one of three states in the South receiving the highest numbers of black college graduates in a New Great Migration.[9]
In recent years, the Asian American population in Texas has grown, especially in west Houston, Fort Bend County southwest of Houston, the western and northern suburbs of Dallas, and Arlington near Fort Worth. Vietnamese Americans, South Asian Americans, Chinese Americans, Filipino Americans, Korean Americans, and Japanese Americans make up the largest Asian American groups in Texas. The Gulf Coast also has large numbers of Asian Americans, because the shrimp fishing industry attracted tens of thousands of Vietnamese, Filipinos, and Chinese from the coast of the South China Sea in the late 1970s and 1980s.
As of 2016, there is also an emerging Asian immigrant population in Amarillo consisting primarily of Southeast Asian refugees.
Native American tribes who once lived or resettled inside the boundaries of present-day Texas include the Alabama, Apache, Atakapan, Bidai, Caddo, Cherokee, Chickasaw, Choctaw, Comanche, Coushatta, Hueco, the Karankawa of Galveston, Kiowa, Lipan Apache, Muscogee, Natchez, Quapaw, Seminole, Tonkawa, Wichita, and many others.
Three federally recognized Native American tribes currently are headquartered in Texas:
- Alabama-Coushatta Tribe of Texas in eastern Texas[10]
- Kickapoo Traditional Tribe of Texas in the Rio Grande Valley[10]
- Ysleta Del Sur Pueblo of El Paso, Texas.[11]
According to Steve H. Murdock, a demographer with the Hobby Center for the Study of Texas at Rice University and a former director of the U.S. Census Bureau, the White American population is aging, while minority populations remain relatively young. As of 2011, according to Murdock, two out of three children in Texas are not non-Hispanic Whites. Murdock also predicted that, between 2000 and 2040 (assuming that the net migration rate will equal half that of 1990-2000), Hispanic public school enrollment will increase by 213 percent, while non-Hispanic white enrollment will decrease by 15 percent.[12]
Birth data
Note: Births in table don't add up, because Hispanics are counted both by their ethnicity and by their race, giving a higher overall number.
| Race | 2013[13] | 2014[14] | 2015[15] | 2016[16] |
|---|---|---|---|---|
| White: | 318,211 (82.1%) | 326,480 (81.7%) | 327,429 (81.1%) | ... |
| > Non-Hispanic White | 136,608 (35.3%) | 140,992 (35.3%) | 140,553 (34.8%) | 134,262 (33.7%) |
| Black | 49,039 (12.7%) | 51,274 (12.4%) | 53,144 (13.2%) | 48,562 (12.2%) |
| Asian | 18,861 (4.9%) | 20,844 (5.2%) | 21,775 (5.4%) | 20,889 (5.2%) |
| American Indian | 1,229 (0.3%) | 1,168 (0.3%) | 1,270 (0.3%) | 782 (0.2%) |
| Pacific Islander | 498 (0.1%) | |||
| Hispanic (of any race) | 185,467 (47.9%) | 189,462 (47.4%) | 191,157 (47.4%) | 188,393 (47.3%) |
| Total Texas | 387,340 (100%) | 399,766 (100%) | 403,618 (100%) | 398,047 (100%) |
- Since 2016, data for births of White Hispanic origin are not collected, but included in one Hispanic group; persons of Hispanic origin may be of any race.
Languages
The most common American English accent spoken was Texan English, which is a mix of Southern American English and Western American English dialects. Louisiana Creole language is spoken mostly in Southeast Texas. Chicano English is also widely spoken, as well as African American Vernacular English, and General American English.
| Language | Percentage of population (as of 2010)[17] |
|---|---|
| Spanish | 29.21% |
| Vietnamese | 0.75% |
| Chinese (including Mandarin and Cantonese) | 0.56% |
| German | 0.33% |
| Tagalog | 0.29% |
| French | 0.25% |
| Korean and Urdu (tied) | 0.24% |
| Hindi | 0.23% |
| Arabic | 0.21% |
| Niger-Congo languages of West Africa (Ibo, Kru, and Yoruba) | 0.15% |
As of 2010, 65.80% (14,740,304) of Texas residents age 5 and older spoke English at home as a primary language, while 29.21% (6,543,702) spoke Spanish, 0.75% (168,886) Vietnamese, and Chinese (which includes Cantonese and Mandarin) was spoken as a main language by 0.56% (122,921) of the population over the age of five.[17]
Other languages spoken include German (including Texas German) by 0.33% (73,137,) Tagalog with 0.29% (73,137) speakers, and French (including Cajun French) was spoken by 0.25% (55,773) of Texans.[17]
In total, 34.20% (7,660,406) of Texas's population age 5 and older spoke a mother language other than English.[17]
Religion
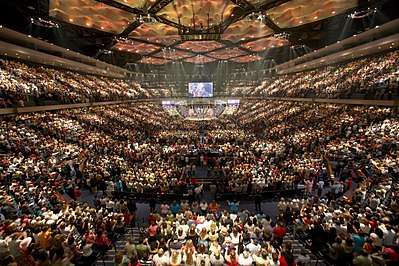
Texas is a part of the strongly socially conservative, Evangelical Protestant Bible Belt.[18] The Dallas-Fort Worth area is home to three major evangelical seminaries and several of America's largest megachurches, including the Potter's House pastored by T.D Jakes and Prestonwood Baptist pastored by Jack Graham. Houston is home to the largest church in the nation, Lakewood Church, pastored by Joel Osteen. Lubbock, Texas has the most churches per capita in the nation.[18]
In 2000, the religious demographics of Texas were:[19]
- Evangelical Protestant – 64.4%.
- Roman Catholic – 21.2%
- Mainline Protestant – 8.1%
- Orthodox – 0.1%
- Hindu, Sikhs, Buddhists, Muslim, others; 2.0%
- Unclaimed – 4.5%
The largest single denominations by number of adherents in 2000 were the Catholic Church 4,368,969, the Southern Baptist Convention 3,519,459 and the United Methodist Church 1,022,342.[19] Evangelical Protestant Christian influence has had a strong social, cultural, and political impact in Texas throughout its history, but not all Texans share this view of Christian religious doctrine. Austin, the state capital, is perceived as a more secular and liberal community.
Other religious groups in Texas include Jewish Texans. Most of the state's estimated 128,000 Jews live in or around Dallas and Houston.[20]
Settlements
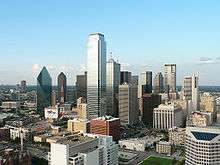
Six Texas cities have populations greater than 500,000, including the two global cities of Dallas and Houston.[21] Texas has 25 metropolitan areas, with four having populations over 1 million and two over 6 million. Texas also has 3 of the 10 cities in the U.S. with populations greater than 1 million, and is tied with California for the most of any state. Austin, Fort Worth, and El Paso are also among the top 25 largest U.S. cities.
The Texas Urban Triangle is a region defined by three interstate highways – I-35 to the west (Dallas-Fort Worth to San Antonio), I-45 to the east (Dallas to Houston), and I-10 to the south (San Antonio to Houston). The region contains most of the state's largest cities and metropolitan areas, as well as nearly 75 percent of Texas' total population.[22]
See also
References
- ↑ Texas Population 2017 Archived 2017-01-21 at the Wayback Machine. World Population Review
- ↑ Resident Population Data. "Resident Population Data – 2010 Census". 2010.census.gov. Archived from the original on October 19, 2013. Retrieved December 22, 2012.
- ↑ "Table 1. Annual Estimates of the Resident Population for the United States, Regions, States, and Puerto Rico: April 1, 2010 to July 1, 2015". U.S. Census Bureau. December 23, 2015. Archived from the original (CSV) on December 23, 2015. Retrieved December 23, 2015.
- ↑ "United State Census Bureau". 2008-2012 American Community Survey 5-Year Estimates. Archived from the original on 2014-08-15. Retrieved Feb 28, 2014.
- ↑ "Pew Research Center". Archived from the original on 2014-02-21. Retrieved Feb 28, 2014.
- ↑ Population and Population Centers by State: 2010 Archived 2015-02-22 at the Wayback Machine.. United States Census Bureau. Retrieved February 5, 2017.
- 1 2 "Archived copy" (PDF). Archived (PDF) from the original on 2012-02-24. Retrieved 2012-02-10.
- ↑ Bagden, Samantha. "Cubans in Texas see some hope in new relations" (Archive) Austin American-Statesman. Monday January 18, 2016. Retrieved on January 19, 2016.
- 1 2 William H. Frey, "The New Great Migration: Black Americans' Return to the South, 1965-2000", May 2004, The Brookings Institution, p.1 Archived April 28, 2008, at the Wayback Machine., accessed 19 Mar 2008
- 1 2 "Tribal Governments by Area: Southern Plains." Archived March 28, 2012, at the Wayback Machine. National Congress of American Indians. Retrieved 28 Feb 2012.
- ↑ "Tribal Governments by Area: Southwest." Archived March 28, 2012, at the Wayback Machine. National Congress of American Indians. Retrieved 28 Feb 2012.
- ↑ Scharrer, Gary. "Texas demographer: 'It's basically over for Anglos' Archived 2011-08-19 at Wikiwix" Houston Chronicle. February 24, 2011. Retrieved on February 27, 2011.
- ↑ "Archived copy" (PDF). Archived (PDF) from the original on 2017-09-11. Retrieved 2017-09-04.
- ↑ "Archived copy" (PDF). Archived (PDF) from the original on 2017-02-14. Retrieved 2017-09-04.
- ↑ "Archived copy" (PDF). Archived (PDF) from the original on 2017-08-31. Retrieved 2017-09-04.
- ↑ https://www.cdc.gov/nchs/data/nvsr/nvsr67/nvsr67_01.pdf
- 1 2 3 4 "Texas". Modern Language Association. Archived from the original on August 15, 2013. Retrieved August 11, 2013.
- 1 2 Connolly, Ceci (2003-01-21). "Texas Teaches Abstinence, With Mixed Grades". Washington Post: A01. Archived from the original on 2005-10-03. Retrieved 2008-04-28.
- 1 2 "State Membership Report - Texas". Association of Religion Data Archives. Archived from the original on 2011-02-24. Retrieved 2008-02-12.
- ↑ "The Association of Religion Data Archives | Maps & Reports". Thearda.com. Archived from the original on 2011-02-24. Retrieved 2012-05-07.
- ↑ "Inventory of World Cities". Globalization and World Cities Research Network. 2008. Archived from the original on 2013-10-14. Retrieved 2008-04-28.
- ↑ Texas Urban Triangle Archived July 5, 2009, at the Wayback Machine. Christadelphian (SWUTC)
External links
- Kever, Jeannie. "Census finds thousands of Californians flocking to Texas." Houston Chronicle. Tuesday November 15, 2011.
- Hlavaty, Craig. "Texas: The land of Davis, White, and Martinez." (Archive) Houston Chronicle. July 16, 2013.