Tom Green County, Texas
| Tom Green County, Texas | ||
|---|---|---|
 Tom Green County Courthouse in San Angelo | ||
| ||
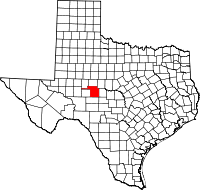 Location in the U.S. state of Texas | ||
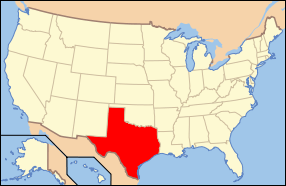 Texas's location in the U.S. | ||
| Founded | 1875 | |
| Named for | General Thomas Green | |
| Seat | San Angelo | |
| Largest city | San Angelo | |
| Area | ||
| • Total | 1,541 sq mi (3,991 km2) | |
| • Land | 1,522 sq mi (3,942 km2) | |
| • Water | 19 sq mi (49 km2), 1.2% | |
| Population | ||
| • (2010) | 110,224 | |
| • Density | 72/sq mi (28/km2) | |
| Congressional district | 11th | |
| Time zone | Central: UTC−6/−5 | |
| Website |
www | |


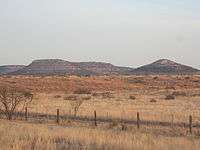
Tom Green County is a county located on the Edwards Plateau in the U.S. state of Texas. As of the 2010 census, its population was 110,224.[1] Its county seat is San Angelo.[2] The county was created in 1874 and organized the following year.[3]
Tom Green County is included in the San Angelo, TX Metropolitan Statistical Area.
History
The county was established by the state legislature on March 13, 1874, and named after Thomas Green, a Confederate brigadier general. It originally comprised an area over 60,000 square miles (160,000 km2).
The original county seat was the town of Ben Ficklin. In 1882, flood waters of the Concho River destroyed the town and drowned 65 people. The county seat was moved to San(ta) Angela. In 1883, the town's name was officially changed to San Angelo by the United States Post Office.
Tom Green County has a long, narrow strip of land extending to the west. This unusual feature is because Reagan County to the west used to be part of Tom Green County, and the state of Texas required that all counties have a contiguous land route to their county seat. Therefore, the small strip of land served to connect the two main regions. In 1903, the residents of the western section voted to form their own county (Reagan County), while in the same vote it was decided that the connecting strip would remain as part of Tom Green County.[4]
Geography
According to the U.S. Census Bureau, the county has a total area of 1,541 square miles (3,990 km2), of which 1,522 square miles (3,940 km2) is land and 19 square miles (49 km2) (1.2%) is covered by water.[5]
Major highways
Adjacent counties
- Coke County (north)
- Runnels County (northeast)
- Concho County (east)
- Schleicher County (south)
- Irion County (west)
- Reagan County (west)
- Sterling County (northwest)
- Menard County (southeast)
Demographics
| Historical population | |||
|---|---|---|---|
| Census | Pop. | %± | |
| 1880 | 3,615 | — | |
| 1890 | 5,152 | 42.5% | |
| 1900 | 6,804 | 32.1% | |
| 1910 | 17,882 | 162.8% | |
| 1920 | 15,210 | −14.9% | |
| 1930 | 36,033 | 136.9% | |
| 1940 | 39,302 | 9.1% | |
| 1950 | 58,929 | 49.9% | |
| 1960 | 64,630 | 9.7% | |
| 1970 | 71,047 | 9.9% | |
| 1980 | 84,784 | 19.3% | |
| 1990 | 98,458 | 16.1% | |
| 2000 | 104,010 | 5.6% | |
| 2010 | 110,224 | 6.0% | |
| Est. 2016 | 118,386 | [6] | 7.4% |
| U.S. Decennial Census[7] 1850–2010[8] 2010–2014[1] | |||
As of the census[9] of 2000, 104,010 people, 39,503 households, and 26,783 families resided in the county. The population density was 68 people per square mile (26/km2). There were 43,916 housing units at an average density of 29 per mi2 (11/km²). The racial makeup of the county was 50.76% White, 5.13% Black or African American, 0.65% Native American, 0.86% Asian, 0.07% Pacific Islander, 12.82% from other races, and 2.39% from two or more races. About 30.71% of the population were Hispanic or Latino of any race, 13.2% were of German, 10.7% American, 8.2% English and 7.2% Irish ancestry according to Census 2000.
Of the 39,503 households, 33.00% had children under the age of 18 living with them, 52.10% were married couples living together, 11.90% had a female householder with no husband present, and 32.20% were not families. About 27.2% of all households were made up of individuals, and 10.80% had someone living alone who was 65 years of age or older. The average household size was 2.52 and the average family size was 3.09.
In the county, the population age was distributed as 26.10% under the age of 18, 12.80% from 18 to 24, 27.10% from 25 to 44, 20.60% from 45 to 64, and 13.40% who were 65 years of age or older. The median age was 34 years. For every 100 females, there were 93.70 males. For every 100 females age 18 and over, there were 89.90 males.
The median income for a household in the county was $33,148, and for a family was $39,482. Males had a median income of $27,949 versus $20,683 for females. The per capita income for the county was $17,325. About 11.20% of families and 15.20% of the population were below the poverty line, including 20.20% of those under age 18 and 11.80% of those age 65 or over.
Education
The following school districts serve Tom Green County:
- Christoval ISD
- Grape Creek ISD
- Miles ISD (mostly in Runnels County)
- San Angelo ISD
- Veribest ISD
- Wall ISD
- Water Valley ISD
Colleges
Communities

City
- San Angelo (county seat)
Census-designated places
Unincorporated communities
Ghost town
Military Base
Politics
| Year | Republican | Democratic | Third parties |
|---|---|---|---|
| 2016 | 71.5% 27,494 | 23.8% 9,173 | 4.7% 1,812 |
| 2012 | 73.2% 26,878 | 25.3% 9,294 | 1.5% 548 |
| 2008 | 70.4% 27,362 | 28.7% 11,158 | 0.9% 341 |
| 2004 | 75.3% 28,185 | 24.1% 9,007 | 0.6% 225 |
| 2000 | 71.4% 24,733 | 26.8% 9,288 | 1.8% 605 |
| 1996 | 55.2% 18,112 | 35.9% 11,782 | 8.9% 2,914 |
| 1992 | 40.8% 14,989 | 31.1% 11,437 | 28.1% 10,313 |
| 1988 | 63.1% 21,463 | 36.1% 12,283 | 0.8% 266 |
| 1984 | 72.5% 23,847 | 27.3% 8,981 | 0.3% 82 |
| 1980 | 60.7% 16,555 | 36.3% 9,892 | 3.0% 824 |
| 1976 | 52.3% 12,316 | 47.0% 11,064 | 0.7% 174 |
| 1972 | 71.9% 15,784 | 27.7% 6,082 | 0.4% 95 |
| 1968 | 49.6% 9,682 | 34.7% 6,774 | 15.8% 3,080 |
| 1964 | 40.5% 6,664 | 59.4% 9,767 | 0.1% 12 |
| 1960 | 53.6% 8,176 | 46.1% 7,031 | 0.3% 39 |
| 1956 | 64.6% 9,070 | 35.1% 4,923 | 0.3% 40 |
| 1952 | 62.5% 9,698 | 37.4% 5,797 | 0.2% 24 |
| 1948 | 20.0% 1,822 | 74.3% 6,777 | 5.7% 517 |
| 1944 | 13.5% 1,125 | 75.5% 6,272 | 10.9% 909 |
| 1940 | 14.0% 1,049 | 85.8% 6,433 | 0.2% 15 |
| 1936 | 11.4% 627 | 87.3% 4,803 | 1.3% 69 |
| 1932 | 12.9% 739 | 86.8% 4,957 | 0.3% 18 |
| 1928 | 63.1% 2,618 | 36.8% 1,528 | 0.1% 2 |
| 1924 | 19.8% 554 | 75.7% 2,116 | 4.4% 124 |
| 1920 | 15.5% 256 | 76.6% 1,264 | 7.9% 130 |
| 1916 | 6.5% 92 | 88.2% 1,243 | 5.3% 75 |
| 1912 | 4.5% 50 | 81.2% 906 | 14.3% 160 |
See also
References
- 1 2 "State & County QuickFacts". United States Census Bureau. Retrieved December 26, 2013.
- ↑ "Find a County". National Association of Counties. Retrieved 2011-06-07.
- ↑ "Texas: Individual County Chronologies". Texas Atlas of Historical County Boundaries. The Newberry Library. 2008. Retrieved May 27, 2015.
- ↑ "Abilene Reporter-News". Abilene Reporter-News. Retrieved 9 April 2018.
- ↑ "2010 Census Gazetteer Files". United States Census Bureau. August 22, 2012. Retrieved May 11, 2015.
- ↑ "Population and Housing Unit Estimates". Retrieved June 9, 2017.
- ↑ "U.S. Decennial Census". United States Census Bureau. Retrieved May 11, 2015.
- ↑ "Texas Almanac: Population History of Counties from 1850–2010" (PDF). Texas Almanac. Retrieved May 11, 2015.
- ↑ "American FactFinder". United States Census Bureau. Retrieved 2011-05-14.
- ↑ Leip, David. "Dave Leip's Atlas of U.S. Presidential Elections". uselectionatlas.org. Retrieved 9 April 2018.
External links
- Tom Green County government's website
- Tom Green County in Handbook of Texas Online at the University of Texas
- County genealogy links at Rootsweb
- Entry for Tom Green from the Biographical Encyclopedia of Texas published 1880, hosted by the Portal to Texas History.
- San Angelo LIVE! News, live events and music in San Angelo, the county seat of Tom Green County
Places adjacent to Tom Green County, Texas | ||||||||||
|---|---|---|---|---|---|---|---|---|---|---|
| ||||||||||
Municipalities and communities of Tom Green County, Texas, United States | ||
|---|---|---|
| City | | |
| CDPs | ||
| Other unincorporated communities | ||
| Ghost town | ||