Harrison County, Texas
| Harrison County, Texas | |
|---|---|
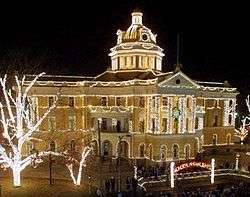
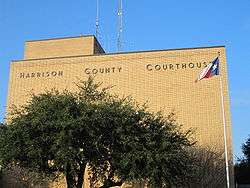 Harrison County Courthouse in Marshall | |
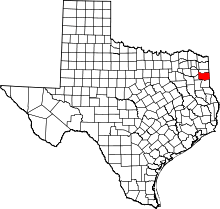 Location in the U.S. state of Texas | |
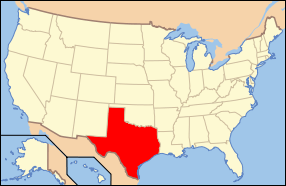 Texas's location in the U.S. | |
| Founded | 1842 |
| Named for | Jonas Harrison[1] |
| Seat | Marshall |
| Largest city | Marshall |
| Area | |
| • Total | 916 sq mi (2,372 km2) |
| • Land | 900 sq mi (2,331 km2) |
| • Water | 16 sq mi (41 km2), 1.7% |
| Population | |
| • (2010) | 65,631 |
| • Density | 73/sq mi (28/km2) |
| Congressional district | 1st |
| Time zone | Central: UTC−6/−5 |
| Website |
harrisoncountytexas |
Harrison County is a county on the eastern border of the U.S. state of Texas. As of the 2010 census, its population was 65,631.[2] The county seat is Marshall.[3] The county was created in 1839 and organized in 1842.[4][5] It is named for Jonas Harrison, a lawyer and Texas revolutionary.
Harrison County comprises the Marshall, TX Micropolitan Statistical Area, which is also included in the Longview–Marshall, TX Combined Statistical Area. It is located in the Ark-La-Tex region.
Conservative whites in Harrison County have left the Democratic party for the Republican Party, as has happened across the South. The county is represented in the Texas House of Representatives by Republican Chris Paddie, a former Marshall mayor.
History
Early history
Settlement by United States citizens began in present-day Harrison County during the 1830s. In 1835, the Mexican authorities granted a dozen land grants to immigrants from the United States. After the Texas Revolution, the Congress of the Texas Republic established Harrison County in 1839, formed from Shelby County. Harrison County was named for Texas Revolutionary Jonas Harrison. The county was organized in 1842.
The county's area was reduced in 1846, following the establishment of Panola and Upshur counties. Marshall was established in 1841, and became the county seat in 1842.[1]
The area was settled predominately by planters from the Southern United States, who developed this area for cotton plantations and brought African-American slaves with them for labor, or purchased them at regional markets. The planters repeated much of their culture and society here. East Texas was the location of most cotton plantations in the state and, correspondingly, of most of the enslaved African Americans. By 1850, landowners in Harrison County held more slaves than in any other county in Texas until the end of the Civil War. The census of 1860 counted 8,746 slaves in Harrison County, 59% of the county's total population.[1]
In 1861, the county's voters (who were exclusively white males and mostly upper class) overwhelmingly supported secession.
Reconstruction to present
Following defeat at the end of the war, the county was part of an area occupied by Federal troops under Reconstruction. The white minority in the county bitterly resented federal authority and giving the franchise to freedmen, who elected a bi-racial county government dominated by Republican Party officeholders. Republican dominance in local offices continued in the county until 1880, but the conservative whites of the Democratic Party regained control of the state government before the official end of Reconstruction. In 1880, the Citizen's Party of Harrison County, amid charges of fraud and coercion, gained control of elected positions in the county government after winning on a technicality, which involved hiding a key ballot box.[1] They retained such control of the county into the 1950s, aided by the state's disenfranchisement of blacks at the turn of the century.
In the 1870s the county's non-agricultural sector increased when the Texas and Pacific Railway located its headquarters and shops in Marshall. It stimulated other industry and manufacturing in the county, and also aided the transportation of the important cotton crop to market.[1]
But from 1880 to 1930, Harrison County remained primarily agricultural and rural. It had a 60 percent black majority through 1930. Most of the African Americans worked as tenant farmers and sharecroppers. White violence against blacks rose during this period, as they struggled to maintain social dominance. Starting in 1870, this was the period of the most lynchings of African Americans throughout the South. Harrison County had a total of 14 such lynchings,[6] most committed in the early 20th century, particularly in the 1910s when the county suffered economic hard times. Whites "did not lynch in lieu of ineffective courts, but instead demonstrated to the black majority that legal protection and rights were inaccessible to blacks".[7] Blacks accused of violence against law enforcement or from outside the county were particularly at risk.
The Texas legislature disenfranchised most blacks in 1901 by requiring poll taxes and authorizing white primaries (the latter were overturned by a US Supreme Court decision in 1944.) This disenfranchisement extended into the late 1960s, after national civil rights legislation was passed to enforce these citizens' civil rights.[8]
In 1928, oil was discovered in the county. Its exploitation and processing made a significant contribution to the economy.[1]
The Great Depression of the 1930s hit the county hard, decimating the agricultural sector. World War II brought an end to the depression. As the defense industry built up in major cities and on the West Coast, from 1940 to 1970, more than 4.5 million blacks migrated from Harrison and other Texas counties as well as from Louisiana, Mississippi and other southern states. They moved to the West Coast in the second wave of the Great Migration, attracted to new jobs in the expanding defense industry.
The population of the county declined until 1980, when the trend reversed. White population increases by migration from other areas has resulted in a majority-white population. White conservative voters have become overwhelmingly Republican in the realignment of parties in the South since the late 20th century.[1]
Geography
According to the U.S. Census Bureau, the county has a total area of 916 square miles (2,370 km2), of which 900 square miles (2,300 km2) is land and 16 square miles (41 km2) (1.7%) is water.[9] The northern and eastern parts of the county are drained to the Red River in Louisiana by Little Cypress Creek, Cypress Bayou, and Caddo Lake. The other third of the county is drained by the Sabine River, which forms a part of its southern boundary.[10] These waterways were critical to early transportation in the county.
Adjacent counties
- Marion County (north)
- Caddo Parish, Louisiana (east)
- Panola County (south)
- Rusk County (southwest)
- Gregg County (west)
- Upshur County (northwest)
Major highways
.svg.png)

.svg.png)


The TTC-69 component (recommended preferred) of the once-planned Trans-Texas Corridor went through Harrison County.[11][12]
National protected area
Demographics
| Historical population | |||
|---|---|---|---|
| Census | Pop. | %± | |
| 1850 | 11,822 | — | |
| 1860 | 15,001 | 26.9% | |
| 1870 | 13,241 | −11.7% | |
| 1880 | 25,177 | 90.1% | |
| 1890 | 26,721 | 6.1% | |
| 1900 | 31,878 | 19.3% | |
| 1910 | 37,243 | 16.8% | |
| 1920 | 43,565 | 17.0% | |
| 1930 | 48,937 | 12.3% | |
| 1940 | 50,900 | 4.0% | |
| 1950 | 47,745 | −6.2% | |
| 1960 | 45,594 | −4.5% | |
| 1970 | 44,841 | −1.7% | |
| 1980 | 52,265 | 16.6% | |
| 1990 | 57,483 | 10.0% | |
| 2000 | 62,110 | 8.0% | |
| 2010 | 65,631 | 5.7% | |
| Est. 2016 | 66,534 | [13] | 1.4% |
| U.S. Decennial Census[14] 1850–2010[15] 2010–2014[2] | |||
As of the census[16] of 2000, there were 62,110 people, 23,087 households, and 16,945 families residing in the county. The population density was 69 people per square mile (27/km²). There were 26,271 housing units at an average density of 29 per square mile (11/km²). The racial makeup of the county was 71.35% White, 24.03% Black or African American, 0.35% Native American, 0.31% Asian, 0.04% Pacific Islander, 2.86% from other races, and 1.06% from two or more races. 5.34% of the population were Hispanic or Latino of any race.
There were 23,087 households out of which 34.40% had children under the age of 18 living with them, 56.00% were married couples living together, 13.60% had a female householder with no husband present, and 26.60% were non-families. 23.70% of all households were made up of individuals and 10.70% had someone living alone who was 65 years of age or older. The average household size was 2.62 and the average family size was 3.09.
In the county, the population was spread out with 26.80% under the age of 18, 10.00% from 18 to 24, 27.10% from 25 to 44, 23.00% from 45 to 64, and 13.10% who were 65 years of age or older. The median age was 36 years. For every 100 females there were 94.10 males. For every 100 females age 18 and over, there were 89.90 males.
The median income for a household in the county was $33,520, and the median income for a family was $41,112. Males had a median income of $32,451 versus $20,913 for females. The per capita income for the county was $16,702. 16.70% of the population and 12.90% of families were below the poverty line. Out of the total population, 21.80% of those under the age of 18 and 14.60% of those 65 and older were living below the poverty line.
The largest ancestry groups in Harrison County are:
- English - 41%
- Black or African American - 24%
- Irish - 8%
- German - 3%
- Scotch-Irish - 3%
- Scottish - 2%
- Dutch - 1%
- Italian - 1%
- French or French Canadian (except Basque) - 1%
- Mexican - 1%
- Polish - 1%
Education
The following school districts serve Harrison County:
- Elysian Fields ISD (partly in Panola County)
- Hallsville ISD
- Harleton ISD
- Marshall ISD
- Longview ISD (mostly in Gregg County)
- New Diana ISD (mostly in Upshur County)
- Ore City ISD (mostly in Upshur County, small portion in Marion County)
- Waskom ISD
- Karnack ISD
Communities
Cities
- Hallsville
- Longview (mostly in Gregg County)
- Marshall (county seat)
- Scottsville
- Uncertain
- Waskom
Unincorporated communities
Politics
| Year | Republican | Democratic | Third parties |
|---|---|---|---|
| 2016 | 70.6% 18,749 | 26.9% 7,151 | 2.4% 648 |
| 2012 | 66.9% 17,512 | 32.3% 8,456 | 0.8% 202 |
| 2008 | 65.4% 17,103 | 34.0% 8,887 | 0.6% 168 |
| 2004 | 62.8% 16,473 | 36.8% 9,642 | 0.4% 108 |
| 2000 | 60.2% 13,834 | 38.7% 8,878 | 1.1% 258 |
| 1996 | 45.4% 9,835 | 47.6% 10,307 | 7.0% 1,513 |
| 1992 | 38.5% 8,733 | 42.1% 9,538 | 19.5% 4,412 |
| 1988 | 56.2% 11,957 | 42.2% 8,974 | 1.7% 354 |
| 1984 | 61.5% 12,618 | 37.9% 7,773 | 0.6% 118 |
| 1980 | 53.3% 9,328 | 44.3% 7,746 | 2.4% 419 |
| 1976 | 49.8% 7,787 | 49.9% 7,796 | 0.4% 56 |
| 1972 | 68.3% 9,600 | 30.8% 4,333 | 0.9% 127 |
| 1968 | 26.3% 3,668 | 35.6% 4,959 | 38.2% 5,324 |
| 1964 | 46.7% 5,568 | 53.2% 6,351 | 0.1% 11 |
| 1960 | 46.4% 4,613 | 51.4% 5,108 | 2.3% 224 |
| 1956 | 64.8% 5,048 | 34.2% 2,668 | 1.0% 79 |
| 1952 | 51.0% 4,708 | 48.9% 4,516 | 0.1% 5 |
| 1948 | 16.9% 946 | 44.8% 2,504 | 38.3% 2,138 |
| 1944 | 12.4% 619 | 71.6% 3,588 | 16.0% 802 |
| 1940 | 13.1% 681 | 86.9% 4,515 | |
| 1936 | 8.1% 302 | 91.7% 3,400 | 0.2% 6 |
| 1932 | 11.5% 528 | 88.1% 4,057 | 0.4% 19 |
| 1928 | 46.7% 1,776 | 53.2% 2,023 | 0.1% 5 |
| 1924 | 14.2% 463 | 78.9% 2,573 | 6.9% 226 |
| 1920 | 11.9% 377 | 67.1% 2,134 | 21.1% 670 |
| 1916 | 10.6% 172 | 85.0% 1,374 | 4.3% 70 |
| 1912 | 9.7% 140 | 79.0% 1,140 | 11.3% 163 |
See also
References
- 1 2 3 4 5 6 7 Campbell, Randolph B. "Harrison County - The Handbook of Texas Online". Texas State Historical Association. Retrieved 24 May 2011.
- 1 2 "State & County QuickFacts". United States Census Bureau. Archived from the original on July 11, 2011. Retrieved December 17, 2013.
- ↑ "Find a County". National Association of Counties. Retrieved 2011-06-07.
- ↑ "Texas: Individual County Chronologies". Texas Atlas of Historical County Boundaries. The Newberry Library. 2008. Retrieved June 20, 2015.
- ↑ "Harrison County". Texas Almanac. Texas State Historical Association. Retrieved June 20, 2015.
- ↑ Lynching in America, Third Edition: Supplement by County, p. 9, Equal Justice Initiative, Mobile, AL, 2017
- ↑ [https://digital.library.txstate.edu/bitstream/handle/10877/4643/COMPLETED%20THESIS.pdf;sequence=1 Brandon T. Jett, THE BLOODY RED RIVER: LYNCHING AND RACIAL VIOLENCE IN NORTHEAST TEXAS, 1890-1930, 2012, M.A. Thesis, p. 63; Texas State University-San Marcos
- ↑ "5.3 Historical Barriers to Voting", Texas Politics, University of Texas website, 2018
- ↑ "2010 Census Gazetteer Files". United States Census Bureau. August 22, 2012. Retrieved April 28, 2015.
- ↑ Randolph B. Campbell, "Harrison County", (uploaded 2010/updated 2017), Handbook of Texas Online; accessed 16 May 2018
- ↑ TxDoT, TTC Section E, Detailed Map 1, 2007-12-21 Archived 2009-02-07 at the Wayback Machine.
- ↑ TxDoT, TTC Section F, Detailed Map 2, 2007-12-28 Archived 2009-02-07 at the Wayback Machine.
- ↑ "Population and Housing Unit Estimates". Retrieved June 9, 2017.
- ↑ "U.S. Decennial Census". United States Census Bureau. Retrieved April 28, 2015.
- ↑ "Texas Almanac: Population History of Counties from 1850–2010" (PDF). Texas Almanac. Retrieved April 28, 2015.
- ↑ "American FactFinder". United States Census Bureau. Retrieved 2011-05-14.
- ↑ Leip, David. "Dave Leip's Atlas of U.S. Presidential Elections". uselectionatlas.org. Retrieved 2018-07-25.
Further reading
- Randolph B. Campbell, A Southern Community in Crisis: Harrison County, Texas, 1850–1880 (Austin: Texas State Historical Association, 1983).
External links
![]()
- Harrison County government's website
- Harrison County from the Handbook of Texas Online
- Historic materials about Harrison County, hosted by the Portal to Texas History
Places adjacent to Harrison County, Texas | ||||||||||
|---|---|---|---|---|---|---|---|---|---|---|
| ||||||||||
Municipalities and communities of Harrison County, Texas, United States | ||
|---|---|---|
| Cities | | |
| Unincorporated communities | ||
| Footnotes | ‡This populated place also has portions in an adjacent county or counties | |
City of Shreveport & Shreveport/Bossier City Metro | ||
|---|---|---|
| Topics | ||
| Shreveport neighborhoods |
| |
| The Ark-La-Tex | ||