Calhoun County, Texas
| Calhoun County, Texas | |
|---|---|
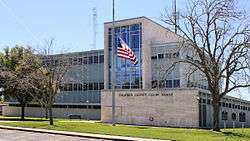 Calhoun County Courthouse | |
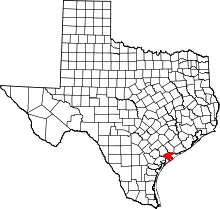 Location in the U.S. state of Texas | |
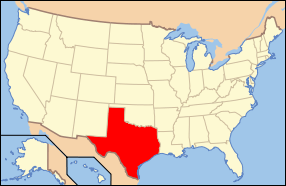 Texas's location in the U.S. | |
| Founded | 1846 |
| Named for | John C. Calhoun |
| Seat | Port Lavaca |
| Largest city | Port Lavaca |
| Area | |
| • Total | 1,033 sq mi (2,675 km2) |
| • Land | 507 sq mi (1,313 km2) |
| • Water | 526 sq mi (1,362 km2), 51% |
| Population | |
| • (2010) | 21,381 |
| • Density | 42/sq mi (16/km2) |
| Congressional district | 27th |
| Time zone | Central: UTC−6/−5 |
| Website |
www |
Calhoun County is a county located in the U.S. state of Texas. As of the 2010 census, the population was 21,381.[1] Its county seat is Port Lavaca.[2] The county is named for John Caldwell Calhoun, the seventh vice president of the United States.
Calhoun County comprises the Port Lavaca, TX Micropolitan Statistical Area, which is also included in the Victoria-Port Lavaca, TX Combined Statistical Area.
History
- Paleo-Indians Hunter-gatherers, and later Comanche, Tonkawa, and Karankawa tribes, first inhabitants.[3]
- 1685-1690 René-Robert Cavelier, Sieur de La Salle lands near Powderhorn Lake in Calhoun County. France plants its flag on Texas soil, but departs after only five years.[4]
- 1689 The future county is explored by Spaniards, including Alonso De León.[5]
- 1825 Martín De León of Mexico establishes a ranch near the old La Salle fort.[3]
- 1831 Linnville becomes the first Anglo settlement, established by Irish-born merchant, statesman, soldier John J. Linn.[6]
- 1840 Comanche Indians loot and sack Linnville.[7]
- 1842-1847 Empresario Henri Castro contracts to bring Alsatian immigrants from France, who use Port Lavaca as a holding site before moving on to settle Castroville in Medina County.[8]
- 1845 Thousands of German immigrants are stranded at port of disembarkation Indianaola on Matagorda Bay.[9]
- 1846 Calhoun County is formed from parts of Victoria, Jackson, and Matagorda counties. It is named for then Chairman of the Senate Finance Committee John C. Calhoun. Lavaca was the first county seat.[3]
- 1852 Indianola becomes the county seat. The Morgan steamship lines [10] runs regular service from Indianola to New York City. Slave trading peaks at Indianola.[11]
- 1854 Poles begin to arrive in Indianaola.[9]
- 1858 Half Moon Reef Lighthouse is constructed in Matagorda Bay.[12]
- 1860 County population is 2,642, including 414 slaves.[3]
- 1861 Calhoun County 276-18 votes for secession from the Union. Contributes volunteer companies-to the Confederate cause.[3] Fort Esperanza, on Matagorda Island is constructed by Confederate forces using slave labor.[13]
- 1862 Union gunboats bombard Port Lavaca.[14]
- 1875 A Gulf tropical storm heavily damages Indianola.[9]
- 1886 A hurricane destroys Indianola and causes much damage to Houston.[15]
- 1892 The Lutheran community of Olivia is established by Swedes.[16]
- 1909 Port O’Connor is established. The St. Louis, Brownsville and Mexico Railway establishes a terminus at Port O’Connor.[17]
- 1920 Port Lavaca builds a seawall to protect itself against hurricanes.[3]
- 1931 Lavaca Bay causeway is constructed.[3]
- 1934-1935 Oil and natural gas discovered near Port Lavaca.[3]
- 1947 Alcoa opens a plant at Point Comfort.[18]
- 1952 Union Carbide opens a plant near Seadrift.[3]
- 1961 Category 5 Hurricane Carla makes landfall between Port Lavaca and Port O’Connor.[19]
- 1983 Matagorda Island State Park and Wildlife Management Area is run by the Texas Parks and Wildlife Department under an agreement between the United States Department of the Interior and the state of Texas.[20]
Geography
According to the U.S. Census Bureau, the county has a total area of 1,033 square miles (2,680 km2), of which 507 square miles (1,310 km2) is land and 526 square miles (1,360 km2) (51%) is water.[21] It borders the Gulf of Mexico.
Adjacent counties
- Jackson County (north)
- Matagorda County (east)
- Aransas County (southwest)
- Refugio County (west)
- Victoria County (northwest)
National protected area
Demographics
| Historical population | |||
|---|---|---|---|
| Census | Pop. | %± | |
| 1850 | 1,110 | — | |
| 1860 | 2,642 | 138.0% | |
| 1870 | 3,443 | 30.3% | |
| 1880 | 1,739 | −49.5% | |
| 1890 | 815 | −53.1% | |
| 1900 | 2,395 | 193.9% | |
| 1910 | 3,635 | 51.8% | |
| 1920 | 4,700 | 29.3% | |
| 1930 | 5,385 | 14.6% | |
| 1940 | 5,911 | 9.8% | |
| 1950 | 9,222 | 56.0% | |
| 1960 | 16,592 | 79.9% | |
| 1970 | 17,831 | 7.5% | |
| 1980 | 19,574 | 9.8% | |
| 1990 | 19,053 | −2.7% | |
| 2000 | 20,647 | 8.4% | |
| 2010 | 21,381 | 3.6% | |
| Est. 2016 | 21,965 | [22] | 2.7% |
| U.S. Decennial Census[23] 1850–2010[24] 2010–2014[1] | |||
As of the 2010 United States Census, there were 21,381 people residing in the county. 81.5% were White, 4.4% Asian, 2.6% Black or African American, 0.5% Native American, 8.8% of some other race and 2.1% of two or more races. 46.4% were Hispanic or Latino (of any race).
As of the census[25] of 2000, there were 20,647 people, 7,442 households, and 5,574 families residing in the county. The population density was 40 people per square mile (16/km²). There were 10,238 housing units at an average density of 20 per square mile (8/km²). The racial makeup of the county was 78.04% White, 2.63% Black or African American, 0.49% Native American, 3.27% Asian, 0.07% Pacific Islander, 13.19% from other races, and 2.32% from two or more races. 40.92% of the population were Hispanic or Latino of any race. 11.4% were of German, 9.4% American and 5.5% English ancestry according to Census 2000. 67.9% spoke English, 29.1% Spanish and 1.2% Chinese as their first language.
There were 7,442 households out of which 35.40% had children under the age of 18 living with them, 59.20% were married couples living together, 11.00% had a female householder with no husband present, and 25.10% were non-families. 21.30% of all households were made up of individuals and 8.90% had someone living alone who was 65 years of age or older. The average household size was 2.75 and the average family size was 3.20.
In the county, the population was spread out with 28.50% under the age of 18, 8.70% from 18 to 24, 27.30% from 25 to 44, 22.30% from 45 to 64, and 13.30% who were 65 years of age or older. The median age was 35 years. For every 100 females, there were 100.90 males. For every 100 females age 18 and over, there were 99.70 males.
The median income for a household in the county was $35,849, and the median income for a family was $39,900. Males had a median income of $35,957 versus $19,772 for females. The per capita income for the county was $17,125. About 12.70% of families and 16.40% of the population were below the poverty line, including 21.30% of those under age 18 and 11.70% of those age 65 or over.
Education
All of Calhoun County is served by the Calhoun County Independent School District.
Our Lady of the Gulf Catholic school, pre-K through grade 8, has also served the county since 1996.
Transportation
Major highways
Airport
Calhoun County Airport, a general aviation airport, is located in unincorporated Calhoun County northwest of Port Lavaca.
Communities
Cities
- Point Comfort
- Port Lavaca (county seat)
- Seadrift
Census-designated place
Unincorporated communities
Ghost Town
Politics
| Year | Republican | Democratic | Third parties |
|---|---|---|---|
| 2016 | 66.5% 4,638 | 30.4% 2,118 | 3.1% 218 |
| 2012 | 62.3% 4,144 | 36.3% 2,410 | 1.4% 94 |
| 2008 | 59.7% 4,106 | 39.7% 2,729 | 0.6% 44 |
| 2004 | 62.8% 4,348 | 37.0% 2,561 | 0.3% 20 |
| 2000 | 56.7% 3,724 | 42.2% 2,766 | 1.1% 73 |
| 1996 | 46.3% 2,832 | 45.0% 2,753 | 8.6% 528 |
| 1992 | 38.9% 2,640 | 37.6% 2,550 | 23.4% 1,589 |
| 1988 | 48.8% 3,183 | 50.8% 3,314 | 0.4% 27 |
| 1984 | 63.0% 4,434 | 36.7% 2,586 | 0.3% 19 |
| 1980 | 50.6% 3,312 | 46.3% 3,034 | 3.1% 203 |
| 1976 | 39.2% 2,377 | 60.1% 3,642 | 0.7% 42 |
| 1972 | 64.9% 3,614 | 34.8% 1,936 | 0.3% 16 |
| 1968 | 31.3% 1,672 | 48.8% 2,612 | 19.9% 1,066 |
| 1964 | 23.3% 1,031 | 76.6% 3,398 | 0.1% 5 |
| 1960 | 44.5% 1,599 | 54.6% 1,961 | 1.0% 34 |
| 1956 | 63.9% 1,912 | 35.7% 1,067 | 0.4% 13 |
| 1952 | 63.3% 1,406 | 36.6% 813 | 0.1% 3 |
| 1948 | 33.6% 346 | 57.2% 589 | 9.2% 95 |
| 1944 | 14.7% 158 | 68.2% 732 | 17.1% 183 |
| 1940 | 14.0% 152 | 85.9% 935 | 0.1% 1 |
| 1936 | 11.8% 92 | 87.7% 685 | 0.5% 4 |
| 1932 | 10.6% 100 | 88.4% 834 | 1.1% 10 |
| 1928 | 46.8% 333 | 52.7% 375 | 0.4% 3 |
| 1924 | 20.1% 181 | 76.1% 686 | 3.9% 35 |
| 1920 | 16.9% 95 | 64.7% 363 | 18.4% 103 |
| 1916 | 15.4% 84 | 71.3% 388 | 13.2% 72 |
| 1912 | 7.8% 36 | 77.3% 355 | 14.8% 68 |
See also
References
- 1 2 "State & County QuickFacts". United States Census Bureau. Retrieved December 9, 2013.
- ↑ "Find a County". National Association of Counties. Archived from the original on 2011-05-31. Retrieved 2011-06-07.
- 1 2 3 4 5 6 7 8 9 Kleiner, Diana. "Calhoun County". Handbook of Texas Online. Texas State Historical Association. Retrieved 2 December 2010.
- ↑ Little, Carol Morris (1996). A Comprehensive Guide to Outdoor Sculpture in Texas. University of Texas Press. pp. 358–359. ISBN 978-0-292-76036-3.
- ↑ Wade, Marian F and Don E; Hester, Thomas R (2002). The Native Americans of the Texas Edwards Plateau, 1582-1799. University of Texas Press. p. 145. ISBN 978-0-292-79156-5.
- ↑ Roell, Craig H. "John Joseph Linn". Handbook of Texas Online. Texas State Historical Association. Retrieved 2 December 2010.
- ↑ Roell, Craig H. "Linnville Raid of 1840". Handbook of Texas Online. Texas State Historical Association. Retrieved 2 December 2010.
- ↑ Morgenthaler, Jefferson (2009). Promised Land: Solms, Castro, and Sam Houston's Colonization Contracts. TAMU Press. p. 135. ISBN 978-1-60344-119-3.
- 1 2 3 "Indianola". Texas Escapes. Texas Escapes - Blueprints For Travel, LLC. Retrieved 2 December 2010.
- ↑ "MORGAN LINES". tshaonline.org. 15 June 2010. Retrieved 10 April 2018.
- ↑ Obedele-Starks, Ernest (2007). Freebooters and Smugglers: The Foreign Slave Trade in the United States after 1808. University of Arkansas Press. p. 119. ISBN 978-1-55728-858-5.
- ↑ Jones, Ray (2002). American Lighthouses, 2nd: A Definitive Guide. Globe Pequot. pp. 169–170. ISBN 978-0-7627-2269-3.
- ↑ Townsend, Stephen A (2006). The Yankee Invasion of Texas. TAMU Press. p. 28. ISBN 978-1-58544-487-8.
- ↑ "Port Lavaca". Texas Escapes. Texas Escapes - Blueprints For Travel, LLC. Retrieved 2 December 2010.
- ↑ Norcross, Bryan (2007). Hurricane Almanac: The Essential Guide to Storms Past, Present, and Future. St. Martin's Griffin. pp. 38–39.
- ↑ "Oliva, Texas". Texas Escapes. Texas Escapes - Blueprints For Travel, LLC. Retrieved 2 December 2010.
- ↑ "Port O'Connor". Texas Escapes. Texas Escapes - Blueprints For Travel, LLC. Retrieved 2 December 2010.
- ↑ "Point Comfort". Texas Escapes. Texas Escapes - Blueprints For Travel, LLC. Retrieved 2 December 2010.
- ↑ Michaels, Patrick J (2005). Meltdown: The Predictable Distortion of Global Warming by Scientists, Politicians, and the Media. Cato Institute. p. 112. ISBN 978-1-930865-79-2.
- ↑ "Matagorda Island Wildlife Management Area". Shannon D. Moore. Retrieved 2 December 2010.
- ↑ "2010 Census Gazetteer Files". United States Census Bureau. August 22, 2012. Retrieved April 20, 2015.
- ↑ "Population and Housing Unit Estimates". Retrieved June 9, 2017.
- ↑ "U.S. Decennial Census". United States Census Bureau. Archived from the original on May 12, 2015. Retrieved April 20, 2015.
- ↑ "Texas Almanac: Population History of Counties from 1850–2010" (PDF). Texas Almanac. Retrieved April 20, 2015.
- ↑ "American FactFinder". United States Census Bureau. Archived from the original on 2013-09-11. Retrieved 2011-05-14.
- ↑ Leip, David. "Dave Leip's Atlas of U.S. Presidential Elections". uselectionatlas.org. Retrieved 10 April 2018.
External links
- Calhoun County government
- Calhoun County in Handbook of Texas Online at the University of Texas
- "Calhoun County Profile" from the Texas Association of Counties
Places adjacent to Calhoun County, Texas | ||||||||||
|---|---|---|---|---|---|---|---|---|---|---|
| ||||||||||
Municipalities and communities of Calhoun County, Texas, United States | ||
|---|---|---|
| Cities | | |
| CDP | ||
| Other unincorporated communities | ||
| Ghost Town | ||