Menard County, Texas
| Menard County, Texas | |
|---|---|
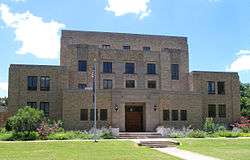 The Menard County Courthouse in Menard | |
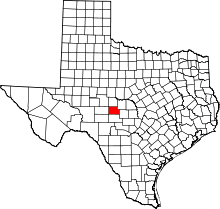 Location in the U.S. state of Texas | |
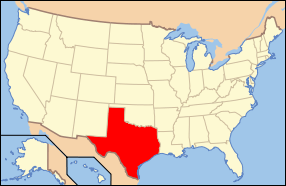 Texas's location in the U.S. | |
| Founded | 1871 |
| Named for | Michel Branamour Menard |
| Seat | Menard |
| Largest city | Menard |
| Area | |
| • Total | 902 sq mi (2,336 km2) |
| • Land | 902 sq mi (2,336 km2) |
| • Water | 0.2 sq mi (1 km2), 0.03% |
| Population | |
| • (2010) | 2,242 |
| • Density | 2.5/sq mi (1.0/km2) |
| Congressional district | 11th |
| Time zone | Central: UTC−6/−5 |
| Website |
co |
Menard County is a county located on the Edwards Plateau in the U.S. state of Texas. As of the 2010 census, its population was 2,242.[1] Its seat is Menard.[2] The county was created in 1858 and later organized in 1871.[3] It is named for Michel Branamour Menard, the founder of Galveston, Texas.[4]
History
- 8000 b.c. Early Native American inhabitants arrive. Later Native Americans include Comanche and Lipan Apache.[5]
- 1757, April - Father Alonso Giraldo de Terreros founds Presidio San Luis de las Amarillas, as a support for Santa Cruz de San Sabá Mission, for the Apache Indians.[6]
- 1830s, James Bowie and Rezin P. Bowie, scour the San Saba valley seeking a silver mine that the Spanish had believed to be in the area. They are unsuccessful, but the legend of the Lost Bowie Mine, also known as the Lost San Saba Mine or the Los Almagres Mine, feeds the imagination of treasure-seekers for the next 150 years.[7][8]
- 1852 Camp San Saba is established to protect settlers from Indian attacks.[9][10]
- 1858 State legislature forms Menard County from Bexar County The county was named for Michel Branamour Menard, the founder of Galveston. Menardville, later known as Menard becomes the county seat.[11]
- 1870 County population is 667. 295 are white. 372 are black, possibly due to the Buffalo Soldiers at Fort McKavett.[5][9]
- 1871 Menard County residents elect their own officials.[5]
- 1880s County immigrant influx from Mexico.[5]
- 1911, February - Fort Worth and Rio Grande Railroad Company arrives.[5]
- 1919 Oil wildcatters hit a dry hole.[5]
- 1929 Gas deposit is tapped, but plugged for lack of a market.[5]
- 1931 The local Parent-Teacher Association offers free lunches for needy children.[5]
- 1934 Texas Relief Cannery is in operation. Drought Relief Program buys cattle and sheep from area ranchers.[5][12]
- 1941 Gas well is re-drilled and produces about seven million cubic feet of gas.[5]
- 1946 A small oilfield is discovered northeast of Fort McKavett but abandoned the following year.[5]
- 1960s Oil and gas production with an average annual yield of more than 270,000 barrels (43,000 m3).[5]
- 1980s Of the county's forty oilfields, about twenty are still active producing 132,000 to 185,000 barrels (29,400 m3) annually.[5]
Geography
According to the U.S. Census Bureau, the county has a total area of 902 square miles (2,340 km2), of which 902 square miles (2,340 km2) is land and 0.2 square miles (0.52 km2) (0.03%) is water.[13]
Major highways
Adjacent counties
- Concho County (north)
- McCulloch County (northeast)
- Mason County (east)
- Kimble County (south)
- Schleicher County (west)
- Sutton County (southwest)
- Tom Green County (northwest)
Demographics
| Historical population | |||
|---|---|---|---|
| Census | Pop. | %± | |
| 1870 | 667 | — | |
| 1880 | 1,239 | 85.8% | |
| 1890 | 1,215 | −1.9% | |
| 1900 | 2,011 | 65.5% | |
| 1910 | 2,707 | 34.6% | |
| 1920 | 3,162 | 16.8% | |
| 1930 | 4,447 | 40.6% | |
| 1940 | 4,521 | 1.7% | |
| 1950 | 4,175 | −7.7% | |
| 1960 | 2,964 | −29.0% | |
| 1970 | 2,646 | −10.7% | |
| 1980 | 2,346 | −11.3% | |
| 1990 | 2,252 | −4.0% | |
| 2000 | 2,360 | 4.8% | |
| 2010 | 2,242 | −5.0% | |
| Est. 2016 | 2,123 | [14] | −5.3% |
| U.S. Decennial Census[15] 1850–2010[16] 2010–2014[1] | |||
As of the census[17] of 2000, there were 2,360 people, 990 households, and 665 families residing in the county. The population density was 3 people per square mile (1/km²). There were 1,607 housing units at an average density of 2 per square mile (1/km²). The racial makeup of the county was 87.54% White, 0.51% Black or African American, 0.64% Native American, 0.34% Asian, 0.04% Pacific Islander, 9.79% from other races, and 1.14% from two or more races. 31.69% of the population were Hispanic or Latino of any race.
There were 990 households out of which 28.50% had children under the age of 18 living with them, 54.00% were married couples living together, 8.80% had a female householder with no husband present, and 32.80% were non-families. 30.40% of all households were made up of individuals and 17.50% had someone living alone who was 65 years of age or older. The average household size was 2.34 and the average family size was 2.91.
In the county, the population was spread out with 24.20% under the age of 18, 5.30% from 18 to 24, 21.90% from 25 to 44, 26.60% from 45 to 64, and 21.90% who were 65 years of age or older. The median age was 44 years. For every 100 females there were 99.70 males. For every 100 females age 18 and over, there were 93.10 males.
The median income for a household in the county was $24,762, and the median income for a family was $30,872. Males had a median income of $21,953 versus $20,000 for females. The per capita income for the county was $15,987. About 20.00% of families and 25.80% of the population were below the poverty line, including 39.90% of those under age 18 and 19.10% of those age 65 or over.
Communities
Census-designated place
- Menard (county seat)
Unincorporated communities
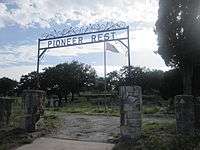
Ghost towns
Politics
| Year | Republican | Democratic | Third parties |
|---|---|---|---|
| 2016 | 78.9% 682 | 17.8% 154 | 3.2% 28 |
| 2012 | 78.3% 665 | 20.1% 171 | 1.5% 13 |
| 2008 | 69.9% 712 | 29.0% 295 | 1.1% 11 |
| 2004 | 69.0% 761 | 30.0% 331 | 1.0% 11 |
| 2000 | 64.9% 642 | 33.7% 334 | 1.4% 14 |
| 1996 | 42.5% 443 | 47.0% 490 | 10.6% 110 |
| 1992 | 27.7% 354 | 43.3% 553 | 29.0% 370 |
| 1988 | 47.1% 552 | 52.4% 614 | 0.4% 5 |
| 1984 | 64.4% 725 | 35.0% 394 | 0.5% 6 |
| 1980 | 52.2% 548 | 46.6% 489 | 1.2% 13 |
| 1976 | 44.1% 441 | 54.3% 543 | 1.6% 16 |
| 1972 | 69.9% 644 | 29.6% 273 | 0.4% 4 |
| 1968 | 50.6% 491 | 37.3% 362 | 12.2% 118 |
| 1964 | 40.3% 397 | 59.7% 588 | |
| 1960 | 55.3% 608 | 44.7% 491 | |
| 1956 | 65.9% 614 | 34.1% 318 | |
| 1952 | 67.9% 843 | 32.1% 399 | |
| 1948 | 28.4% 283 | 66.6% 663 | 5.0% 50 |
| 1944 | 8.6% 96 | 69.2% 776 | 22.3% 250 |
| 1940 | 17.6% 246 | 82.4% 1,153 | 0.1% 1 |
| 1936 | 13.5% 115 | 86.1% 734 | 0.5% 4 |
| 1932 | 14.3% 150 | 85.6% 901 | 0.2% 2 |
| 1928 | 71.6% 589 | 28.4% 234 | |
| 1924 | 42.7% 247 | 52.6% 304 | 4.7% 27 |
| 1920 | 47.7% 203 | 46.2% 197 | 6.1% 26 |
| 1916 | 12.8% 44 | 77.8% 267 | 9.3% 32 |
| 1912 | 7.5% 15 | 54.5% 109 | 38.0% 76 |
See also
References
- 1 2 "State & County QuickFacts". United States Census Bureau. Archived from the original on July 14, 2011. Retrieved December 22, 2013.
- ↑ "Find a County". National Association of Counties. Retrieved 2011-06-07.
- ↑ "Texas: Individual County Chronologies". Texas Atlas of Historical County Boundaries. The Newberry Library. 2008. Retrieved May 25, 2015.
- ↑ Gannett, Henry (1905). The Origin of Certain Place Names in the United States. U.S. Government Printing Office. p. 205.
- 1 2 3 4 5 6 7 8 9 10 11 12 13 Smyrl, Vivian Elizabeth. "Menard County, Texas". Handbook of Texas Online. Texas State Historical Association. Retrieved 30 November 2010.
- ↑ Robinson III, Charles M (2003). The Plains Wars 1757-1900. Routledge. pp. 11–13. ISBN 978-0-415-96912-3.
- ↑ Graves, John; Wyman Meinzer (2002). Texas Rivers. University of Texas Press. p. 79. ISBN 978-0-292-70198-4.
- ↑ "The Lost San Saba Mines". Tex Files. Retrieved 30 November 2010.
- 1 2 "Fort McKavett". Texas Escapes. Texas Escapes - Blueprints For Travel, LLC. Retrieved 30 November 2010.
- ↑ Parent, Laurence (1997). Official Guide to Texas State Parks. University of Texas Press. pp. 71–72. ISBN 978-0-292-76575-7.
- ↑ "Menard, Texas". Texas Escapes. Texas Escapes - Blueprints For Travel, LLC. Retrieved 30 November 2010.
- ↑ "Texas Vernon's Texas Civil Statutes - Article 2372e. Buildings For Canneries For Unemployment Relief". Texas Vernon. Archived from the original on 12 March 2012. Retrieved 30 November 2010.
- ↑ "2010 Census Gazetteer Files". United States Census Bureau. August 22, 2012. Retrieved May 4, 2015.
- ↑ "Population and Housing Unit Estimates". Retrieved June 9, 2017.
- ↑ "U.S. Decennial Census". United States Census Bureau. Retrieved May 4, 2015.
- ↑ "Texas Almanac: Population History of Counties from 1850–2010" (PDF). Texas Almanac. Retrieved May 4, 2015.
- ↑ "American FactFinder". United States Census Bureau. Retrieved 2011-05-14.
- ↑ Leip, David. "Dave Leip's Atlas of U.S. Presidential Elections". uselectionatlas.org. Retrieved 2018-07-27.
External links
- Library of Congress Historic American Buildings Survey (Menard Co)
- Menard County from the Handbook of Texas Online
- Texas Beyond History, Mission San Saba
Places adjacent to Menard County, Texas | ||||||||||
|---|---|---|---|---|---|---|---|---|---|---|
| ||||||||||
Municipalities and communities of Menard County, Texas, United States | ||
|---|---|---|
| City | | |
| Unincorporated communities | ||
| Ghost towns | ||