Jim Wells County, Texas
| Jim Wells County, Texas | |
|---|---|
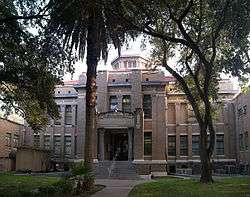 The Jim Wells County Courthouse in Alice | |
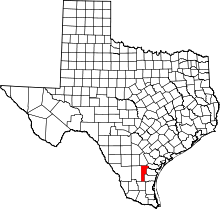 Location in the U.S. state of Texas | |
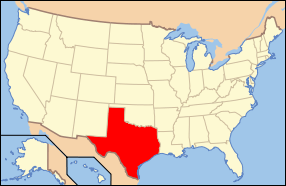 Texas's location in the U.S. | |
| Founded | 1911 |
| Named for | James Babbage Wells Jr. |
| Seat | Alice |
| Largest city | Alice |
| Area | |
| • Total | 868 sq mi (2,248 km2) |
| • Land | 865 sq mi (2,240 km2) |
| • Water | 3.4 sq mi (9 km2), 0.4% |
| Population | |
| • (2010) | 40,838 |
| • Density | 47/sq mi (18/km2) |
| Congressional district | 34th |
| Time zone | Central: UTC−6/−5 |
| Website |
www |
Jim Wells County is a county in the U.S. state of Texas. As of the 2010 census, the population was 40,838.[1] Its county seat is Alice.[2] The county was founded in 1911[3] and is named for James B. Wells, Jr. (1850-1923), for three decades a judge and Democratic Party political boss in South Texas.
Jim Wells County comprises the Alice, TX Micropolitan Statistical Area, which is included in the Corpus Christi-Kingsville-Alice, TX Combined Statistical Area.
Geography
According to the U.S. Census Bureau, the county has a total area of 868 square miles (2,250 km2), of which 865 square miles (2,240 km2) is land and 3.4 square miles (8.8 km2) (0.4%) is water.[4]
Major highways

.svg.png)


Adjacent counties
- Live Oak County (north)
- San Patricio County (northeast)
- Nueces County (east)
- Kleberg County (east)
- Brooks County (south)
- Duval County (west)
Demographics
| Historical population | |||
|---|---|---|---|
| Census | Pop. | %± | |
| 1920 | 6,587 | — | |
| 1930 | 13,456 | 104.3% | |
| 1940 | 20,239 | 50.4% | |
| 1950 | 27,991 | 38.3% | |
| 1960 | 34,548 | 23.4% | |
| 1970 | 33,032 | −4.4% | |
| 1980 | 36,498 | 10.5% | |
| 1990 | 37,679 | 3.2% | |
| 2000 | 39,326 | 4.4% | |
| 2010 | 40,838 | 3.8% | |
| Est. 2016 | 41,149 | [5] | 0.8% |
| U.S. Decennial Census[6] 1850–2010[7] 2010–2014[1] | |||
At the 2000 census,[8] there were 39,326 people, 12,961 households and 10,096 families residing in the county. The population density was 46 per square mile (18/km²). There were 14,819 housing units at an average density of 17 per square mile (7/km²). The racial makeup of the county was 77.90% White, 0.60% Black or African American, 0.62% Native American, 0.43% Asian, 0.09% Pacific Islander, 17.93% from other races, and 2.43% from two or more races. 75.71% of the population were Hispanic or Latino of any race.
There were 12,961 households of which 40.20% had children under the age of 18 living with them, 58.00% were married couples living together, 15.20% had a female householder with no husband present, and 22.10% were non-families. 19.70% of all households were made up of individuals and 9.50% had someone living alone who was 65 years of age or older. The average household size was 2.99 and the average family size was 3.45.
Age distribution was 31.40% under the age of 18, 9.00% from 18 to 24, 26.50% from 25 to 44, 20.60% from 45 to 64, and 12.40% who were 65 years of age or older. The median age was 33 years. For every 100 females there were 95.20 males. For every 100 females age 18 and over, there were 91.40 males.
The median household income was $28,843, and the median family income was $32,616. Males had a median income of $30,266 versus $17,190 for females. The per capita income for the county was $12,252. About 20.10% of families and 24.10% of the population were below the poverty line, including 31.80% of those under age 18 and 21.30% of those age 65 or over.
Government and politics
Being in South Texas, Jim Wells County is part of the oldest Democratic stronghold in the entire United States – a region that has consistently voted for Democrats since the days of Woodrow Wilson. The Jim Wells County Democratic Party has maintained control of the county despite massive demographic changes due to Civil Rights, the collapse of Jim Crow and poll taxes, and mass immigration from Mexico.[9] The only Republicans to win the county since it was created have been Dwight D. Eisenhower in 1956 and Richard Nixon in his 1972 landslide. Since 2004 Jim Wells County has become somewhat less Democratic the during the late twentieth century, but nonetheless the Democratic candidate has won at least 53.77 percent of the county’s vote in every election since 1976.[10] In the 2016 election, Hillary Clinton won 54.08 percent of Jim Wells County’s vote to Donald Trump’s 43.78 percent;[11] in the 2012 election Barack Obama won 58.14 percent to Republican Mitt Romney’s 41.18 percent,[12] whilst in 2008 President-elect Obama won 57.75 percent to John McCain’s 41.69 percent.[13]
| Year | Republican | Democratic | Third parties |
|---|---|---|---|
| 2016 | 43.8% 5,420 | 54.1% 6,694 | 2.1% 265 |
| 2012 | 41.2% 4,598 | 58.1% 6,492 | 0.7% 76 |
| 2008 | 41.7% 4,841 | 57.8% 6,706 | 0.6% 65 |
| 2004 | 45.8% 5,817 | 53.8% 6,824 | 0.4% 50 |
| 2000 | 37.4% 4,498 | 61.7% 7,418 | 0.9% 107 |
| 1996 | 28.3% 2,989 | 67.3% 7,116 | 4.4% 467 |
| 1992 | 26.4% 3,311 | 62.2% 7,812 | 11.5% 1,438 |
| 1988 | 33.6% 4,335 | 65.9% 8,495 | 0.4% 56 |
| 1984 | 43.0% 5,896 | 56.8% 7,795 | 0.2% 24 |
| 1980 | 38.3% 4,606 | 60.5% 7,267 | 1.2% 140 |
| 1976 | 30.7% 3,547 | 68.9% 7,961 | 0.4% 42 |
| 1972 | 54.5% 5,283 | 45.4% 4,404 | 0.1% 11 |
| 1968 | 28.1% 2,827 | 62.7% 6,304 | 9.1% 919 |
| 1964 | 22.5% 1,988 | 77.5% 6,849 | |
| 1960 | 34.2% 2,773 | 65.7% 5,330 | 0.1% 9 |
| 1956 | 54.7% 3,348 | 45.0% 2,752 | 0.4% 22 |
| 1952 | 48.9% 3,592 | 51.0% 3,745 | 0.0% 2 |
| 1948 | 26.5% 1,402 | 71.4% 3,781 | 2.2% 116 |
| 1944 | 34.9% 1,113 | 59.8% 1,908 | 5.3% 170 |
| 1940 | 30.2% 914 | 69.6% 2,105 | 0.2% 7 |
| 1936 | 16.6% 338 | 83.0% 1,691 | 0.4% 9 |
| 1932 | 10.0% 162 | 89.4% 1,449 | 0.6% 10 |
| 1928 | 36.1% 423 | 63.7% 747 | 0.3% 3 |
| 1924 | 21.5% 213 | 65.9% 654 | 12.6% 125 |
| 1920 | 32.3% 169 | 58.0% 304 | 9.7% 51 |
| 1916 | 21.1% 100 | 70.7% 335 | 8.2% 39 |
| 1912 | 6.8% 24 | 68.5% 241 | 24.7% 87 |
1948 U.S. Senate election
Jim Wells County is known as the home of “Box 13”, the infamous ballot box which gave Lyndon Baines Johnson an 86-vote edge over popular former governor Coke Stevenson in the Democratic primary election. It was later demonstrated that these 200 votes were "stuffed" into the ballot box after the polls had closed.[15] Johnson went on to win the election.
Communities
Cities
- Alice (county seat)
- Orange Grove
- Premont
- San Diego (mostly in Duval County)
Village
- Pernitas Point (mostly in Live Oak County)
Census-designated places
Other unincorporated communities
- Ben Bolt
- Bentonville
- Casa Blanca
- La Gloria
- Palito Blanco
- Rancho de la Parita
- San Federico de la Corrazo
- Springfield
See also
References
- 1 2 "State & County QuickFacts". United States Census Bureau. Archived from the original on July 12, 2011. Retrieved December 18, 2013.
- ↑ "Find a County". National Association of Counties. Archived from the original on 2011-05-31. Retrieved 2011-06-07.
- ↑ "Texas: Individual County Chronologies". Texas Atlas of Historical County Boundaries. The Newberry Library. 2008. Retrieved May 24, 2015.
- ↑ "2010 Census Gazetteer Files". United States Census Bureau. August 22, 2012. Retrieved May 2, 2015.
- ↑ "Population and Housing Unit Estimates". Retrieved June 9, 2017.
- ↑ "U.S. Decennial Census". United States Census Bureau. Archived from the original on May 12, 2015. Retrieved May 2, 2015.
- ↑ "Texas Almanac: Population History of Counties from 1850–2010" (PDF). Texas Almanac. Retrieved May 2, 2015.
- ↑ "American FactFinder". United States Census Bureau. Retrieved 2011-05-14.
- ↑ Sullivan, Robert David; ‘How the Red and Blue Map Evolved Over the Past Century’; America Magazine in The National Catholic Review; June 29, 2016
- ↑ Dave Leip’s Atlas of US Presidential Elections; 1976 Presidential General Election Data Graphs – Texas by County (and subsequent elections)
- ↑ 2016 Presidential General Election Results – Texas: Jim Wells County
- ↑ 2012 Presidential General Election Results – Texas: Jim Wells County
- ↑ 2008 Presidential General Election Results – Texas: Jim Wells County
- ↑ Leip, David. "Dave Leip's Atlas of U.S. Presidential Elections". uselectionatlas.org. Retrieved 2018-07-26.
- ↑ Caro, Robert (1991). The Years of Lyndon Johnson: Means of Ascent. ISBN 067973371X.
External links
Places adjacent to Jim Wells County, Texas | ||||||||||
|---|---|---|---|---|---|---|---|---|---|---|
| ||||||||||
Municipalities and communities of Jim Wells County, Texas, United States | ||
|---|---|---|
| Cities | | |
| Village | ||
| CDPs | ||
| Other unincorporated communities | ||
| Footnotes | ‡This populated place also has portions in an adjacent county or counties | |