Ochiltree County, Texas
| Ochiltree County, Texas | |
|---|---|
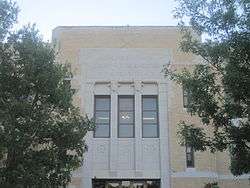 Upper portion of Ochiltree County Courthouse (established 1928) in Perryton | |
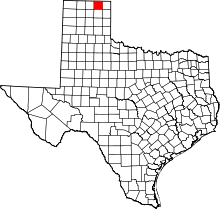 Location in the U.S. state of Texas | |
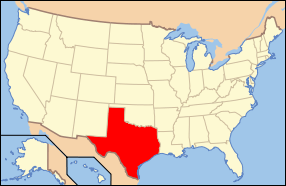 Texas's location in the U.S. | |
| Founded | 1889 |
| Named for | W. B. Ochiltree |
| Seat | Perryton |
| Largest city | Perryton |
| Area | |
| • Total | 918 sq mi (2,378 km2) |
| • Land | 918 sq mi (2,378 km2) |
| • Water | 0.5 sq mi (1 km2), 0.06% |
| Population | |
| • (2010) | 10,223 |
| • Density | 11/sq mi (4/km2) |
| Congressional district | 13th |
| Time zone | Central: UTC−6/−5 |
| Website |
www |

Ochiltree County (/ˈɒkəlˌtriː/ OK-əl-tree)[1] is a county located in the U.S. state of Texas. As of the 2010 census, its population was 10,223.[2] The county seat is Perryton.[3] The county was created in 1876 and organized in 1889.[4][5] and is named for William Beck Ochiltree, who was the Attorney General of the Republic of Texas. It was previously one of 30[6] prohibition or entirely dry counties in the state of Texas.
Geography
According to the U.S. Census Bureau, the county has a total area of 918 square miles (2,380 km2), of which 918 square miles (2,380 km2) is land and 0.5 square miles (1.3 km2) (0.06%) is water.[7]
Major highways
Adjacent counties
- Texas County, Oklahoma (north)
- Beaver County, Oklahoma (northeast)
- Lipscomb County (east)
- Roberts County (south)
- Hansford County (west)
- Hemphill County (southeast)
Demographics
| Historical population | |||
|---|---|---|---|
| Census | Pop. | %± | |
| 1890 | 198 | — | |
| 1900 | 267 | 34.8% | |
| 1910 | 1,602 | 500.0% | |
| 1920 | 2,331 | 45.5% | |
| 1930 | 5,224 | 124.1% | |
| 1940 | 4,213 | −19.4% | |
| 1950 | 6,024 | 43.0% | |
| 1960 | 9,380 | 55.7% | |
| 1970 | 9,704 | 3.5% | |
| 1980 | 9,588 | −1.2% | |
| 1990 | 9,128 | −4.8% | |
| 2000 | 9,006 | −1.3% | |
| 2010 | 10,223 | 13.5% | |
| Est. 2016 | 10,306 | [8] | 0.8% |
| U.S. Decennial Census[9] 1850–2010[10] 2010–2014[2] | |||
As of the census[11] of 2000, there were 9,006 people, 3,261 households, and 2,488 families residing in the county. The population density was 10 people per square mile (4/km²). There were 3,769 housing units at an average density of 4 per square mile (2/km²). The racial makeup of the county was 86.2 percent White, 0.13 percent Black or African American, 0.94 percent Native American, 0.39 percent Asian, 0.01 percent Pacific Islander, 10.28 percent from other races, and 2.04 percent from two or more races. 13.79 percent of the population were Hispanic or Latino of any race. In terms of ancestery, 11.3% were of German, 10.3% were of Irish, 6.3% were of English, 5.4% were of American, 1.5% were of Dutch, 1.5% were of Polish.
There were 3,261 households, of which 40.9 had children under the age of 18, 64 percent were married couples living together, 7.9 percent had a female householder with no husband present, and 23.7 percent were non-families. Of unmarried partner households, 89.5 percent were heterosexual, 6.3 percent were same-sex male, and 4.2 percent were same-sex female.
Twenty-one percent of all households were made up of individuals and 9.30 percent had someone living alone who was 65 years of age or older. The average household size was 2.74 and the average family size was 3.18.
In the county, the population was spread out with 30.6 percent under the age of 18, 8.4 percent from 18 to 24, 28.7 percent from 25 to 44, 20.7 percent from 45 to 64, and 11.7 percent who were 65 years of age or older. The median age was 34 years. For every 100 females there were 99.8 males. For every 100 females age 18 and over, there were 96.9 males.
The median income for a household in the county was $38,013, and the median income for a family was $45,565. Males had a median income of $31,558 versus $19,890 for females, indicating a relatively high level of income inequality based on gender. The per capita income for the county was $16,707. Thirteen percent of the population and 9.8 percent of families were below the poverty line; 17.9 percent of those under the age of 18 and 8.7 percent of those 65 and older were living below the poverty line.
Those making less than $25,000 per year comprised 32.2 percent of the population, while 1.9 percent made more than $150,000, according to the 2000 census. 17.5 percent of the population made less than $15,000 per year, while 6.06 percent made more than $100,000.
Politics
Since the 1950s, Ochiltree has been an overwhelmingly Republican county. The last Democrat to carry the county has been Harry S. Truman in 1948, and although Truman won 73.06 percent of the county’s vote, this is more than twice the proportion any Democratic candidate has won in the subsequent seventeen presidential elections – even Texan Lyndon Johnson did not reach 35 percent in his 1964 landslide, when Ochiltree was easily Goldwater’s strongest Texas county. Indeed, Jimmy Carter in 1976 was the last Democrat to win twenty percent of the county’s vote, and the last to reach so much as ten percent was Bill Clinton in 1996.
In 2004, Ochiltree County 91.5 percent of voters (2,922) voted for George W. Bush, while 8 percent (251 people) voted for John Kerry. Two people (0 percent) voted for Michael Badnarik (Libertarian). This is tied for the second-highest percentage of votes Bush received for any county in the US (in both 2000 and 2004), and it is the highest percentage during the 2004 election, (only Glasscock County, Texas, at 93.1 percent, had a higher percentage in the 2000 Presidential election, though in both instances the percentages are skewed by the very small number of voters).
In 2008, 91.7% of voters supported Senator John McCain, whereas only 7.8% of voters supported Senator Barack Obama. Presidential elections indicate a strong sense of support for the Republican party.[12] It lost the title of most Republican county in the United States to King County, Texas.
| Year | Republican | Democratic | Third parties |
|---|---|---|---|
| 2016 | 87.5% 2,628 | 9.1% 274 | 3.3% 100 |
| 2012 | 90.9% 2,719 | 8.5% 253 | 0.7% 21 |
| 2008 | 91.7% 2,851 | 7.8% 243 | 0.5% 15 |
| 2004 | 92.0% 2,922 | 7.9% 251 | 0.1% 4 |
| 2000 | 90.7% 2,687 | 8.5% 251 | 0.8% 24 |
| 1996 | 79.2% 2,448 | 15.1% 467 | 5.7% 176 |
| 1992 | 68.1% 2,419 | 15.7% 557 | 16.3% 578 |
| 1988 | 83.3% 2,928 | 16.5% 579 | 0.3% 10 |
| 1984 | 89.2% 3,492 | 10.7% 419 | 0.2% 6 |
| 1980 | 81.9% 3,032 | 16.1% 594 | 2.1% 76 |
| 1976 | 68.9% 2,471 | 30.2% 1,084 | 0.9% 32 |
| 1972 | 89.4% 2,861 | 9.3% 298 | 1.3% 43 |
| 1968 | 70.5% 2,208 | 13.8% 432 | 15.7% 492 |
| 1964 | 66.3% 1,814 | 33.6% 920 | 0.1% 3 |
| 1960 | 78.1% 1,870 | 21.8% 521 | 0.1% 3 |
| 1956 | 69.5% 1,209 | 29.4% 512 | 1.1% 19 |
| 1952 | 80.4% 1,755 | 19.5% 426 | 0.1% 2 |
| 1948 | 24.5% 344 | 73.1% 1,025 | 2.4% 34 |
| 1944 | 23.5% 307 | 65.9% 863 | 10.6% 139 |
| 1940 | 19.5% 294 | 80.5% 1,213 | |
| 1936 | 8.6% 109 | 88.0% 1,111 | 3.3% 42 |
| 1932 | 14.2% 183 | 85.0% 1,097 | 0.9% 11 |
| 1928 | 67.3% 556 | 32.7% 270 | |
| 1924 | 27.6% 155 | 62.6% 352 | 9.8% 55 |
| 1920 | 32.5% 135 | 67.5% 280 | |
| 1916 | 14.3% 41 | 82.9% 238 | 2.8% 8 |
| 1912 | 0.0% 0 | 83.8% 93 | 16.2% 18 |
Education
Of the population aged 25 and older (5,441 people), 14.6 percent did not have a high school diploma, while the 12.9 statewide are without a high school diploma. Twenty-seven percent of the county claimed that a high school diploma was their highest level of educational attainment, compared with 24.8 percent statewide; 16.1 percent had a bachelor's degree or higher, compared with 23.2 percent statewide.
The Allen Campus of Frank Phillips College is located in Perryton.
Communities
City
- Perryton (county seat)
Town
- Booker (mostly in Lipscomb County)
Unincorporated communities
- Farnsworth
- Huntoon
- Ochiltree
- Waka
In popular Culture
Ochiltree County is the setting for the Hank the Cowdog series of children's books, in the unincorporated city of Twitchell.
See also
References
- ↑ http://www.texastripper.com/pronounce/locations-o.html
- 1 2 "State & County QuickFacts". United States Census Bureau. Archived from the original on July 15, 2011. Retrieved December 22, 2013.
- ↑ "Find a County". National Association of Counties. Retrieved 2011-06-07.
- ↑ "Texas: Individual County Chronologies". Texas Atlas of Historical County Boundaries. The Newberry Library. 2008. Retrieved May 26, 2015.
- ↑ Columbia-Lippincott Gazetteer. p. 1364
- ↑ http://www.tabc.state.tx.us/local_option_elections/index.asp
- ↑ "2010 Census Gazetteer Files". United States Census Bureau. August 22, 2012. Retrieved May 5, 2015.
- ↑ "Population and Housing Unit Estimates". Retrieved June 9, 2017.
- ↑ "U.S. Decennial Census". United States Census Bureau. Retrieved May 5, 2015.
- ↑ "Texas Almanac: Population History of Counties from 1850–2010" (PDF). Texas Almanac. Retrieved May 5, 2015.
- ↑ "American FactFinder". United States Census Bureau. Retrieved 2011-05-14.
- ↑ "America's Decision - Election Tracking Map". Fox News. Retrieved 2008-11-07.
- ↑ Leip, David. "Dave Leip's Atlas of U.S. Presidential Elections". uselectionatlas.org. Retrieved 2018-07-28.
External links
- Ochiltree County government’s website
- Ochiltree County in Handbook of Texas Online at the University of Texas
- Ochiltree County Profile from the Texas Association of Counties
Places adjacent to Ochiltree County, Texas | ||||||||||
|---|---|---|---|---|---|---|---|---|---|---|
| ||||||||||
Municipalities and communities of Ochiltree County, Texas, United States | ||
|---|---|---|
| City | | |
| Town | ||
| Unincorporated communities | ||
| Footnotes | ‡This populated place also has portions in an adjacent county or counties | |