United States presidential election in Texas, 1964
|
| ||||||||||||||||||||||||||
| ||||||||||||||||||||||||||
| ||||||||||||||||||||||||||
 County Results
| ||||||||||||||||||||||||||
| ||||||||||||||||||||||||||
| Elections in Texas | ||||||||
|---|---|---|---|---|---|---|---|---|
 | ||||||||
|
||||||||
|
| ||||||||
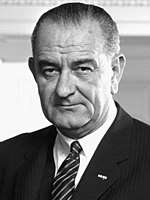
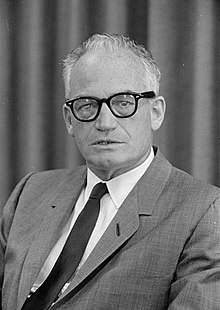
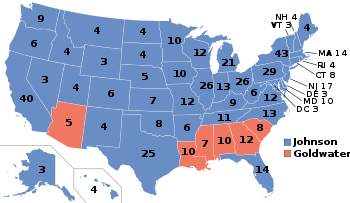
The 1964 United States presidential election in Texas was held on November 3, 1964, as part of the United States presidential election of 1964. The Democratic Party candidate, incumbent President Lyndon B. Johnson, comfortably won his home state of Texas with 63.32% of the vote against the Republican Party candidate, Senator Barry Goldwater of Arizona, who won 36.5%, giving him the state's 25 electoral votes and a victory margin of 26.8%.[1] President Lyndon B. Johnson won the 1964 election in a massive landslide, carrying 44 states plus the District of Columbia, which participated for the first time. Goldwater only carried his home state of Arizona along with five Deep South states which had been historically Democratic, but defected to the Republican Party due to the Democratic Party’s support for civil rights.
Analysis
The home state of President Lyndon B. Johnson, Texas was his nineteenth best state in the election and his second best in the South below Kentucky, weighing in around 4.2 percent more Democratic than the national average. Johnson won every region in the state by wide margins, including those which had begun trending Republican in recent presidential elections such as the Texas Panhandle, the Dallas–Fort Worth metroplex, and Metro Houston. Every major city in the state voted for Johnson, including every mid-sized city with the exceptions of Odessa, Midland, Tyler, and Longview, which were won by Goldwater.
Two counties in the northern Panhandle, Ochiltree and Roberts, gave Goldwater over sixty percent of the vote, further reflecting this region’s trend towards the Republican Party. Given that it was also Johnson’s home county, Gillespie County in the Texas Hill Country voted Democratic for the only time since Franklin D. Roosevelt’s landslide in the 1932 election, in which he carried every county.[2] This is the only presidential election between 1952 and 2008 that Dallas and Harris counties voted for the Democratic candidate. Dallas in particular, likely swung towards Johnson due to the city still being in mourning from the assassination of President John F. Kennedy, which had occurred less than a year before the election. Despite this strong swing, Johnson only carried Dallas County by a 9.6 percent margin.
President Johnson carried 238 out of the state’s 254 counties, and all twenty-three congressional districts. The 1964 election marks the last time a Democratic candidate for president won Texas with over sixty percent of the vote, won the state with a double-digit margin, and carried any counties with over ninety percent of the vote (in this case, the South Texas counties of Duval and Webb). Webb, Duval and Jim Hogg counties stood among the four most Democratic in the nation.[3]
Aside from Johnson's home county Gillespie as mentioned above, this remains the last election as of 2018 in which Crane County, Montgomery County, Rusk County, Irion County, Loving County, Martin County, Andrews County, Winkler County, McMullen County, Collin County, Washington County, Kerr County, Comal County, Hemphill County, Deaf Smith County, Hartley County, Lubbock County, Upton County, Schleicher County, Tarrant County, Reagan County, Brazos County, Denton County, Victoria County, Tom Green County, DeWitt County, Cooke County, Potter County, Taylor County, Guadalupe County, Bandera County, Uvalde County, Yoakum County, Dawson County, Kimble County, Sutton County, Sterling County, Austin County, and Runnels County voted for the Democratic candidate.
Results
| United States presidential election in Texas, 1964 | |||||
|---|---|---|---|---|---|
| Party | Candidate | Votes | Percentage | Electoral votes | |
| Democratic | Lyndon B. Johnson | 1,663,185 | 63.32% | 25 | |
| Republican | Barry Goldwater | 958,566 | 36.49% | 0 | |
| Constitution | Joseph Lightburn | 5,060 | 0.19% | 0 | |
| Totals | 2,626,811 | 100.00% | 25 | ||
| Voter turnout (Voting age/Registered Voters) | 44.6%/88.0% | ||||
Results by county
| County | Johnson# | Johnson% | Goldwater# | Goldwater% | Lightburn# | Lightburn% | Total votes cast |
|---|---|---|---|---|---|---|---|
| Anderson | 4,809 | 58.78% | 3,362 | 41.10% | 10 | 0.12% | 8,181 |
| Andrews | 2,133 | 59.50% | 1,442 | 40.22% | 10 | 0.28% | 3,585 |
| Angelina | 8,194 | 60.77% | 5,262 | 39.02% | 28 | 0.21% | 13,484 |
| Aransas | 1,492 | 71.01% | 602 | 28.65% | 7 | 0.33% | 2,101 |
| Archer | 1,766 | 80.02% | 441 | 19.98% | 0 | 0.00% | 2,207 |
| Armstrong | 544 | 59.85% | 365 | 40.15% | 0 | 0.00% | 909 |
| Atascosa | 3,224 | 71.39% | 1,283 | 28.41% | 9 | 0.20% | 4,516 |
| Austin | 2,365 | 60.41% | 1,545 | 39.46% | 5 | 0.13% | 3,915 |
| Bailey | 1,503 | 58.67% | 1,056 | 41.22% | 3 | 0.12% | 2,562 |
| Bandera | 876 | 53.45% | 762 | 46.49% | 1 | 0.06% | 1,639 |
| Bastrop | 3,912 | 77.48% | 1,130 | 22.38% | 7 | 0.14% | 5,049 |
| Baylor | 1,403 | 78.21% | 389 | 21.68% | 2 | 0.11% | 1,794 |
| Bee | 3,314 | 68.58% | 1,509 | 31.23% | 9 | 0.19% | 4,832 |
| Bell | 14,557 | 83.13% | 2,938 | 16.78% | 17 | 0.10% | 17,512 |
| Bexar | 108,658 | 66.86% | 53,469 | 32.90% | 393 | 0.24% | 162,520 |
| Blanco | 1,197 | 80.44% | 290 | 19.49% | 1 | 0.07% | 1,488 |
| Borden | 266 | 63.48% | 152 | 36.28% | 1 | 0.24% | 419 |
| Bosque | 2,690 | 72.29% | 1,024 | 27.52% | 7 | 0.19% | 3,721 |
| Bowie | 10,368 | 59.55% | 7,018 | 40.31% | 24 | 0.14% | 17,410 |
| Brazoria | 15,917 | 64.98% | 8,477 | 34.60% | 103 | 0.42% | 24,497 |
| Brazos | 7,998 | 66.54% | 4,003 | 33.31% | 18 | 0.15% | 12,019 |
| Brewster | 1,251 | 66.30% | 635 | 33.65% | 1 | 0.05% | 1,887 |
| Briscoe | 966 | 73.35% | 348 | 26.42% | 3 | 0.23% | 1,317 |
| Brooks | 2,299 | 85.05% | 402 | 14.87% | 2 | 0.07% | 2,703 |
| Brown | 5,214 | 71.49% | 2,070 | 28.38% | 9 | 0.12% | 7,293 |
| Burleson | 2,527 | 80.30% | 617 | 19.61% | 3 | 0.10% | 3,147 |
| Burnet | 2,585 | 75.81% | 821 | 24.08% | 4 | 0.12% | 3,410 |
| Caldwell | 3,580 | 77.34% | 1,046 | 22.60% | 3 | 0.06% | 4,629 |
| Calhoun | 3,398 | 76.64% | 1,031 | 23.25% | 5 | 0.11% | 4,434 |
| Callahan | 2,178 | 71.72% | 849 | 27.96% | 10 | 0.33% | 3,037 |
| Cameron | 16,056 | 62.57% | 9,531 | 37.14% | 72 | 0.28% | 25,659 |
| Camp | 1,841 | 71.44% | 729 | 28.29% | 7 | 0.27% | 2,577 |
| Carson | 1,574 | 60.05% | 1,044 | 39.83% | 3 | 0.11% | 2,621 |
| Cass | 3,603 | 57.26% | 2,681 | 42.61% | 8 | 0.13% | 6,292 |
| Castro | 1,865 | 74.78% | 626 | 25.10% | 3 | 0.12% | 2,494 |
| Chambers | 1,921 | 64.99% | 1,023 | 34.61% | 12 | 0.41% | 2,956 |
| Cherokee | 5,485 | 64.25% | 3,043 | 35.64% | 9 | 0.11% | 8,537 |
| Childress | 1,977 | 67.45% | 952 | 32.48% | 2 | 0.07% | 2,931 |
| Clay | 2,357 | 78.05% | 659 | 21.82% | 4 | 0.13% | 3,020 |
| Cochran | 1,260 | 71.55% | 497 | 28.22% | 4 | 0.23% | 1,761 |
| Coke | 900 | 70.92% | 366 | 28.84% | 3 | 0.24% | 1,269 |
| Coleman | 2,670 | 65.04% | 1,434 | 34.93% | 1 | 0.02% | 4,105 |
| Collin | 7,833 | 69.98% | 3,341 | 29.85% | 19 | 0.17% | 11,193 |
| Collingsworth | 1,145 | 61.16% | 724 | 38.68% | 3 | 0.16% | 1,872 |
| Colorado | 3,650 | 65.48% | 1,918 | 34.41% | 6 | 0.11% | 5,574 |
| Comal | 3,644 | 62.03% | 2,223 | 37.84% | 8 | 0.14% | 5,875 |
| Comanche | 2,851 | 74.65% | 962 | 25.19% | 6 | 0.16% | 3,819 |
| Concho | 948 | 75.48% | 307 | 24.44% | 1 | 0.08% | 1,256 |
| Cooke | 4,083 | 56.62% | 3,117 | 43.23% | 11 | 0.15% | 7,211 |
| Coryell | 3,679 | 80.61% | 877 | 19.22% | 8 | 0.18% | 4,564 |
| Cottle | 1,122 | 82.93% | 230 | 17.00% | 1 | 0.07% | 1,353 |
| Crane | 919 | 58.95% | 637 | 40.86% | 3 | 0.19% | 1,559 |
| Crockett | 799 | 65.98% | 409 | 33.77% | 3 | 0.25% | 1,211 |
| Crosby | 2,278 | 78.77% | 611 | 21.13% | 3 | 0.10% | 2,892 |
| Culberson | 473 | 60.10% | 314 | 39.90% | 0 | 0.00% | 787 |
| Dallam | 1,058 | 60.15% | 700 | 39.80% | 1 | 0.06% | 1,759 |
| Dallas | 166,472 | 54.73% | 137,065 | 45.06% | 621 | 0.20% | 304,158 |
| Dawson | 3,171 | 65.14% | 1,691 | 34.74% | 6 | 0.12% | 4,868 |
| Deaf Smith | 2,094 | 53.73% | 1,793 | 46.01% | 10 | 0.26% | 3,897 |
| Delta | 1,619 | 82.60% | 339 | 17.30% | 2 | 0.10% | 1,960 |
| Denton | 9,137 | 67.71% | 4,335 | 32.13% | 22 | 0.16% | 13,494 |
| Dewitt | 3,286 | 58.96% | 2,283 | 40.97% | 4 | 0.07% | 5,573 |
| Dickens | 1,324 | 79.42% | 339 | 20.34% | 4 | 0.24% | 1,667 |
| Dimmit | 1,184 | 70.14% | 501 | 29.68% | 3 | 0.18% | 1,688 |
| Donley | 1,068 | 60.14% | 708 | 39.86% | 0 | 0.00% | 1,776 |
| Duval | 4,432 | 92.55% | 353 | 7.37% | 4 | 0.08% | 4,789 |
| Eastland | 4,692 | 69.49% | 2,049 | 30.35% | 11 | 0.16% | 6,752 |
| Ector | 10,826 | 48.36% | 11,497 | 51.36% | 63 | 0.28% | 22,386 |
| Edwards | 337 | 47.33% | 371 | 52.11% | 4 | 0.56% | 712 |
| Ellis | 7,278 | 72.33% | 2,779 | 27.62% | 5 | 0.05% | 10,062 |
| El Paso | 35,050 | 62.67% | 20,687 | 36.99% | 190 | 0.34% | 55,927 |
| Erath | 3,851 | 70.04% | 1,642 | 29.87% | 5 | 0.09% | 5,498 |
| Falls | 3,933 | 76.35% | 1,216 | 23.61% | 2 | 0.04% | 5,151 |
| Fannin | 5,976 | 83.00% | 1,219 | 16.93% | 5 | 0.07% | 7,200 |
| Fayette | 3,630 | 63.94% | 2,036 | 35.86% | 11 | 0.19% | 5,677 |
| Fisher | 2,108 | 82.12% | 454 | 17.69% | 5 | 0.19% | 2,567 |
| Floyd | 2,383 | 65.81% | 1,229 | 33.94% | 9 | 0.25% | 3,621 |
| Foard | 833 | 85.00% | 146 | 14.90% | 1 | 0.10% | 980 |
| Fort Bend | 6,186 | 63.78% | 3,493 | 36.01% | 20 | 0.21% | 9,699 |
| Franklin | 1,520 | 78.19% | 424 | 21.81% | 0 | 0.00% | 1,944 |
| Freestone | 2,816 | 72.35% | 1,074 | 27.60% | 2 | 0.05% | 3,892 |
| Frio | 1,507 | 71.19% | 607 | 28.67% | 3 | 0.14% | 2,117 |
| Gaines | 2,045 | 63.89% | 1,153 | 36.02% | 3 | 0.09% | 3,201 |
| Galveston | 30,672 | 71.04% | 12,365 | 28.64% | 136 | 0.32% | 43,173 |
| Garza | 1,254 | 68.64% | 567 | 31.03% | 6 | 0.33% | 1,827 |
| Gillespie | 2,264 | 57.17% | 1,695 | 42.80% | 1 | 0.03% | 3,960 |
| Glasscock | 179 | 49.31% | 183 | 50.41% | 1 | 0.28% | 363 |
| Goliad | 990 | 64.24% | 549 | 35.63% | 2 | 0.13% | 1,541 |
| Gonzales | 3,348 | 73.66% | 1,190 | 26.18% | 7 | 0.15% | 4,545 |
| Gray | 3,633 | 42.00% | 5,011 | 57.93% | 6 | 0.07% | 8,650 |
| Grayson | 14,207 | 72.01% | 5,500 | 27.88% | 21 | 0.11% | 19,728 |
| Gregg | 8,741 | 42.47% | 11,761 | 57.14% | 82 | 0.40% | 20,584 |
| Grimes | 2,229 | 68.65% | 1,014 | 31.23% | 4 | 0.12% | 3,247 |
| Guadalupe | 4,568 | 62.51% | 2,731 | 37.37% | 9 | 0.12% | 7,308 |
| Hale | 5,910 | 61.60% | 3,666 | 38.21% | 18 | 0.19% | 9,594 |
| Hall | 1,785 | 72.77% | 667 | 27.19% | 1 | 0.04% | 2,453 |
| Hamilton | 2,048 | 67.02% | 1,006 | 32.92% | 2 | 0.07% | 3,056 |
| Hansford | 860 | 41.83% | 1,193 | 58.03% | 3 | 0.15% | 2,056 |
| Hardeman | 1,835 | 72.47% | 697 | 27.53% | 0 | 0.00% | 2,532 |
| Hardin | 5,143 | 71.97% | 1,987 | 27.81% | 16 | 0.22% | 7,146 |
| Harris | 227,819 | 59.49% | 154,401 | 40.32% | 765 | 0.20% | 382,985 |
| Harrison | 6,351 | 53.24% | 5,568 | 46.67% | 11 | 0.09% | 11,930 |
| Hartley | 565 | 56.33% | 437 | 43.57% | 1 | 0.10% | 1,003 |
| Haskell | 2,903 | 84.86% | 512 | 14.97% | 6 | 0.18% | 3,421 |
| Hays | 3,780 | 74.64% | 1,279 | 25.26% | 5 | 0.10% | 5,064 |
| Hemphill | 649 | 53.50% | 563 | 46.41% | 1 | 0.08% | 1,213 |
| Henderson | 4,697 | 69.96% | 1,988 | 29.61% | 29 | 0.43% | 6,714 |
| Hidalgo | 22,110 | 65.50% | 11,563 | 34.25% | 83 | 0.25% | 33,756 |
| Hill | 5,130 | 76.61% | 1,557 | 23.25% | 9 | 0.13% | 6,696 |
| Hockley | 4,049 | 70.63% | 1,674 | 29.20% | 10 | 0.17% | 5,733 |
| Hood | 1,661 | 79.59% | 423 | 20.27% | 3 | 0.14% | 2,087 |
| Hopkins | 4,133 | 73.14% | 1,518 | 26.86% | 0 | 0.00% | 5,651 |
| Houston | 3,681 | 68.60% | 1,675 | 31.22% | 10 | 0.19% | 5,366 |
| Howard | 6,083 | 64.94% | 3,272 | 34.93% | 12 | 0.13% | 9,367 |
| Hudspeth | 438 | 65.86% | 224 | 33.68% | 3 | 0.45% | 665 |
| Hunt | 6,567 | 66.47% | 3,302 | 33.42% | 10 | 0.10% | 9,879 |
| Hutchinson | 4,625 | 46.25% | 5,358 | 53.58% | 17 | 0.17% | 10,000 |
| Irion | 351 | 63.82% | 199 | 36.18% | 0 | 0.00% | 550 |
| Jack | 1,594 | 65.22% | 847 | 34.66% | 3 | 0.12% | 2,444 |
| Jackson | 2,775 | 70.22% | 1,168 | 29.55% | 9 | 0.23% | 3,952 |
| Jasper | 3,600 | 65.02% | 1,919 | 34.66% | 18 | 0.33% | 5,537 |
| Jeff Davis | 304 | 63.47% | 174 | 36.33% | 1 | 0.21% | 479 |
| Jefferson | 44,584 | 60.58% | 28,771 | 39.09% | 239 | 0.32% | 73,594 |
| Jim Hogg | 1,375 | 89.87% | 152 | 9.93% | 3 | 0.20% | 1,530 |
| Jim Wells | 6,849 | 77.50% | 1,988 | 22.50% | 0 | 0.00% | 8,837 |
| Johnson | 6,381 | 66.18% | 3,251 | 33.72% | 10 | 0.10% | 9,642 |
| Jones | 3,622 | 73.62% | 1,295 | 26.32% | 3 | 0.06% | 4,920 |
| Karnes | 3,178 | 76.08% | 993 | 23.77% | 6 | 0.14% | 4,177 |
| Kaufman | 4,766 | 71.20% | 1,922 | 28.71% | 6 | 0.09% | 6,694 |
| Kendall | 970 | 44.64% | 1,200 | 55.22% | 3 | 0.14% | 2,173 |
| Kenedy | 115 | 78.77% | 30 | 20.55% | 1 | 0.68% | 146 |
| Kent | 563 | 83.04% | 115 | 16.96% | 0 | 0.00% | 678 |
| Kerr | 2,894 | 51.60% | 2,706 | 48.25% | 8 | 0.14% | 5,608 |
| Kimble | 862 | 62.33% | 520 | 37.60% | 1 | 0.07% | 1,383 |
| King | 180 | 84.11% | 34 | 15.89% | 0 | 0.00% | 214 |
| Kinney | 439 | 73.91% | 155 | 26.09% | 0 | 0.00% | 594 |
| Kleberg | 4,568 | 73.32% | 1,652 | 26.52% | 10 | 0.16% | 6,230 |
| Knox | 1,773 | 80.01% | 439 | 19.81% | 4 | 0.18% | 2,216 |
| Lamar | 6,303 | 70.78% | 2,594 | 29.13% | 8 | 0.09% | 8,905 |
| Lamb | 4,318 | 68.01% | 2,022 | 31.85% | 9 | 0.14% | 6,349 |
| Lampasas | 2,224 | 74.88% | 744 | 25.05% | 2 | 0.07% | 2,970 |
| La Salle | 988 | 81.52% | 223 | 18.40% | 1 | 0.08% | 1,212 |
| Lavaca | 4,031 | 73.07% | 1,480 | 26.83% | 6 | 0.11% | 5,517 |
| Lee | 1,884 | 67.07% | 923 | 32.86% | 2 | 0.07% | 2,809 |
| Leon | 2,373 | 78.52% | 642 | 21.24% | 7 | 0.23% | 3,022 |
| Liberty | 5,357 | 64.88% | 2,884 | 34.93% | 16 | 0.19% | 8,257 |
| Limestone | 3,777 | 71.77% | 1,478 | 28.08% | 8 | 0.15% | 5,263 |
| Lipscomb | 589 | 43.57% | 763 | 56.43% | 0 | 0.00% | 1,352 |
| Live Oak | 1,423 | 63.93% | 795 | 35.71% | 8 | 0.36% | 2,226 |
| Llano | 1,727 | 72.44% | 655 | 27.47% | 2 | 0.08% | 2,384 |
| Loving | 46 | 58.23% | 32 | 40.51% | 1 | 1.27% | 79 |
| Lubbock | 22,057 | 55.89% | 17,372 | 44.02% | 34 | 0.09% | 39,463 |
| Lynn | 2,281 | 75.28% | 745 | 24.59% | 4 | 0.13% | 3,030 |
| McCulloch | 2,100 | 76.06% | 655 | 23.72% | 6 | 0.22% | 2,761 |
| McLennan | 28,429 | 72.25% | 10,892 | 27.68% | 25 | 0.06% | 39,346 |
| McMullen | 267 | 60.27% | 175 | 39.50% | 1 | 0.23% | 443 |
| Madison | 1,298 | 66.74% | 644 | 33.11% | 3 | 0.15% | 1,945 |
| Marion | 1,372 | 59.57% | 927 | 40.25% | 4 | 0.17% | 2,303 |
| Martin | 892 | 68.77% | 402 | 30.99% | 3 | 0.23% | 1,297 |
| Mason | 941 | 61.30% | 590 | 38.44% | 4 | 0.26% | 1,535 |
| Matagorda | 4,143 | 63.20% | 2,407 | 36.72% | 5 | 0.08% | 6,555 |
| Maverick | 2,113 | 79.41% | 545 | 20.48% | 3 | 0.11% | 2,661 |
| Medina | 3,408 | 68.27% | 1,583 | 31.71% | 1 | 0.02% | 4,992 |
| Menard | 588 | 59.70% | 397 | 40.30% | 0 | 0.00% | 985 |
| Midland | 8,646 | 41.96% | 11,906 | 57.78% | 53 | 0.26% | 20,605 |
| Milam | 4,368 | 76.51% | 1,334 | 23.37% | 7 | 0.12% | 5,709 |
| Mills | 1,228 | 71.27% | 495 | 28.73% | 0 | 0.00% | 1,723 |
| Mitchell | 2,420 | 76.61% | 737 | 23.33% | 2 | 0.06% | 3,159 |
| Montague | 3,746 | 77.14% | 1,106 | 22.78% | 4 | 0.08% | 4,856 |
| Montgomery | 4,989 | 60.87% | 3,167 | 38.64% | 40 | 0.49% | 8,196 |
| Moore | 2,393 | 57.54% | 1,762 | 42.37% | 4 | 0.10% | 4,159 |
| Morris | 2,366 | 65.83% | 1,218 | 33.89% | 10 | 0.28% | 3,594 |
| Motley | 678 | 67.53% | 324 | 32.27% | 2 | 0.20% | 1,004 |
| Nacogdoches | 4,524 | 60.17% | 2,976 | 39.58% | 19 | 0.25% | 7,519 |
| Navarro | 6,811 | 76.08% | 2,139 | 23.89% | 3 | 0.03% | 8,953 |
| Newton | 2,211 | 74.82% | 738 | 24.97% | 6 | 0.20% | 2,955 |
| Nolan | 3,540 | 68.58% | 1,610 | 31.19% | 12 | 0.23% | 5,162 |
| Nueces | 40,426 | 74.10% | 14,048 | 25.75% | 84 | 0.15% | 54,558 |
| Ochiltree | 920 | 33.61% | 1,814 | 66.28% | 3 | 0.11% | 2,737 |
| Oldham | 397 | 59.25% | 269 | 40.15% | 4 | 0.60% | 670 |
| Orange | 9,390 | 60.02% | 6,216 | 39.73% | 39 | 0.25% | 15,645 |
| Palo Pinto | 3,791 | 68.42% | 1,748 | 31.55% | 2 | 0.04% | 5,541 |
| Panola | 2,608 | 47.97% | 2,818 | 51.83% | 11 | 0.20% | 5,437 |
| Parker | 5,270 | 70.66% | 2,175 | 29.16% | 13 | 0.17% | 7,458 |
| Parmer | 1,556 | 55.99% | 1,216 | 43.76% | 7 | 0.25% | 2,779 |
| Pecos | 2,068 | 59.55% | 1,393 | 40.11% | 12 | 0.35% | 3,473 |
| Polk | 2,492 | 67.35% | 1,199 | 32.41% | 9 | 0.24% | 3,700 |
| Potter | 12,850 | 52.62% | 11,505 | 47.11% | 64 | 0.26% | 24,419 |
| Presidio | 1,156 | 72.80% | 431 | 27.14% | 1 | 0.06% | 1,588 |
| Rains | 893 | 76.46% | 272 | 23.29% | 3 | 0.26% | 1,168 |
| Randall | 6,016 | 43.34% | 7,843 | 56.50% | 22 | 0.16% | 13,881 |
| Reagan | 614 | 60.08% | 406 | 39.73% | 2 | 0.20% | 1,022 |
| Real | 487 | 65.55% | 255 | 34.32% | 1 | 0.13% | 743 |
| Red River | 3,391 | 72.86% | 1,257 | 27.01% | 6 | 0.13% | 4,654 |
| Reeves | 2,340 | 65.09% | 1,251 | 34.80% | 4 | 0.11% | 3,595 |
| Refugio | 2,319 | 75.02% | 772 | 24.98% | 0 | 0.00% | 3,091 |
| Roberts | 198 | 40.00% | 297 | 60.00% | 0 | 0.00% | 495 |
| Robertson | 3,350 | 78.88% | 895 | 21.07% | 2 | 0.05% | 4,247 |
| Rockwall | 1,305 | 74.36% | 445 | 25.36% | 5 | 0.28% | 1,755 |
| Runnels | 2,645 | 64.01% | 1,480 | 35.82% | 7 | 0.17% | 4,132 |
| Rusk | 6,528 | 54.25% | 5,488 | 45.61% | 17 | 0.14% | 12,033 |
| Sabine | 1,801 | 80.76% | 428 | 19.19% | 1 | 0.04% | 2,230 |
| San Augustine | 1,173 | 60.46% | 760 | 39.18% | 7 | 0.36% | 1,940 |
| San Jacinto | 1,680 | 82.92% | 343 | 16.93% | 3 | 0.15% | 2,026 |
| San Patricio | 7,176 | 76.47% | 2,188 | 23.32% | 20 | 0.21% | 9,384 |
| San Saba | 1,859 | 81.64% | 418 | 18.36% | 0 | 0.00% | 2,277 |
| Schleicher | 514 | 56.92% | 388 | 42.97% | 1 | 0.11% | 903 |
| Scurry | 3,381 | 65.82% | 1,741 | 33.89% | 15 | 0.29% | 5,137 |
| Shackelford | 934 | 65.59% | 487 | 34.20% | 3 | 0.21% | 1,424 |
| Shelby | 3,487 | 61.06% | 2,220 | 38.87% | 4 | 0.07% | 5,711 |
| Sherman | 462 | 42.31% | 629 | 57.60% | 1 | 0.09% | 1,092 |
| Smith | 12,474 | 48.97% | 12,960 | 50.88% | 38 | 0.15% | 25,472 |
| Somervell | 641 | 75.06% | 210 | 24.59% | 3 | 0.35% | 854 |
| Starr | 4,056 | 85.53% | 678 | 14.30% | 8 | 0.17% | 4,742 |
| Stephens | 1,753 | 61.00% | 1,119 | 38.94% | 2 | 0.07% | 2,874 |
| Sterling | 243 | 63.28% | 140 | 36.46% | 1 | 0.26% | 384 |
| Stonewall | 978 | 81.57% | 219 | 18.27% | 2 | 0.17% | 1,199 |
| Sutton | 694 | 66.03% | 357 | 33.97% | 0 | 0.00% | 1,051 |
| Swisher | 2,410 | 74.61% | 815 | 25.23% | 5 | 0.15% | 3,230 |
| Tarrant | 97,092 | 62.98% | 56,593 | 36.71% | 473 | 0.31% | 154,158 |
| Taylor | 13,366 | 59.09% | 9,220 | 40.76% | 34 | 0.15% | 22,620 |
| Terrell | 364 | 55.32% | 294 | 44.68% | 0 | 0.00% | 658 |
| Terry | 3,034 | 65.50% | 1,592 | 34.37% | 6 | 0.13% | 4,632 |
| Throckmorton | 883 | 78.14% | 247 | 21.86% | 0 | 0.00% | 1,130 |
| Titus | 3,528 | 67.60% | 1,687 | 32.32% | 4 | 0.08% | 5,219 |
| Tom Green | 9,767 | 59.40% | 6,664 | 40.53% | 12 | 0.07% | 16,443 |
| Travis | 44,058 | 68.89% | 19,838 | 31.02% | 62 | 0.10% | 63,958 |
| Trinity | 1,654 | 68.12% | 763 | 31.43% | 11 | 0.45% | 2,428 |
| Tyler | 1,818 | 59.86% | 1,216 | 40.04% | 3 | 0.10% | 3,037 |
| Upshur | 4,027 | 64.31% | 2,222 | 35.48% | 13 | 0.21% | 6,262 |
| Upton | 958 | 59.73% | 636 | 39.65% | 10 | 0.62% | 1,604 |
| Uvalde | 2,358 | 54.51% | 1,963 | 45.38% | 5 | 0.12% | 4,326 |
| Val Verde | 3,555 | 72.52% | 1,346 | 27.46% | 1 | 0.02% | 4,902 |
| Van Zandt | 4,047 | 71.30% | 1,614 | 28.44% | 15 | 0.26% | 5,676 |
| Victoria | 8,141 | 65.83% | 4,201 | 33.97% | 25 | 0.20% | 12,367 |
| Walker | 2,877 | 64.86% | 1,557 | 35.10% | 2 | 0.05% | 4,436 |
| Waller | 2,167 | 68.82% | 980 | 31.12% | 2 | 0.06% | 3,149 |
| Ward | 2,221 | 56.17% | 1,730 | 43.75% | 3 | 0.08% | 3,954 |
| Washington | 2,938 | 59.21% | 2,019 | 40.69% | 5 | 0.10% | 4,962 |
| Webb | 10,073 | 90.08% | 1,094 | 9.78% | 15 | 0.13% | 11,182 |
| Wharton | 6,234 | 69.11% | 2,775 | 30.76% | 11 | 0.12% | 9,020 |
| Wheeler | 1,440 | 55.81% | 1,138 | 44.11% | 2 | 0.08% | 2,580 |
| Wichita | 19,131 | 68.99% | 8,585 | 30.96% | 14 | 0.05% | 27,730 |
| Wilbarger | 3,200 | 67.48% | 1,539 | 32.45% | 3 | 0.06% | 4,742 |
| Willacy | 2,152 | 63.52% | 1,230 | 36.30% | 6 | 0.18% | 3,388 |
| Williamson | 7,430 | 80.74% | 1,766 | 19.19% | 6 | 0.07% | 9,202 |
| Wilson | 3,472 | 82.77% | 718 | 17.12% | 5 | 0.12% | 4,195 |
| Winkler | 2,059 | 55.97% | 1,617 | 43.95% | 3 | 0.08% | 3,679 |
| Wise | 3,852 | 73.50% | 1,386 | 26.45% | 3 | 0.06% | 5,241 |
| Wood | 3,528 | 62.93% | 2,068 | 36.89% | 10 | 0.18% | 5,606 |
| Yoakum | 1,415 | 62.06% | 859 | 37.68% | 6 | 0.26% | 2,280 |
| Young | 3,395 | 67.95% | 1,600 | 32.03% | 1 | 0.02% | 4,996 |
| Zapata | 1,009 | 87.97% | 135 | 11.77% | 3 | 0.26% | 1,147 |
| Zavala | 1,784 | 74.80% | 598 | 25.07% | 3 | 0.13% | 2,385 |
| Totals | 1,663,185 | 63.32% | 958,566 | 36.49% | 5,060 | 0.19% | 2,626,811 |
References
- ↑ "1964 Presidential General Election Results - Texas". Retrieved April 25, 2016.
- ↑ Sullivan, Robert David; ‘How the Red and Blue Map Evolved Over the Past Century’; America Magazine in The National Catholic Review; June 29, 2016
- ↑ Dave Leip’s Atlas of U.S. Presidential Elections; 1964 Presidential Election Statistics
State results of the 1964 U.S. presidential election | ||
|---|---|---|
| Candidates |
|  |
| General articles |
| |
| Other 1964 elections | ||