Nueces County, Texas
| Nueces County, Texas | ||
|---|---|---|
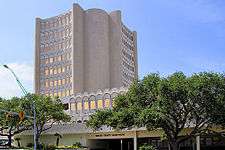 The Nueces County Courthouse in Corpus Christi | ||
| ||
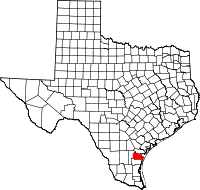 Location in the U.S. state of Texas | ||
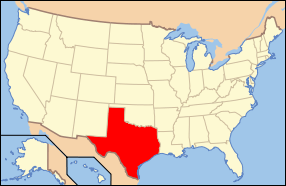 Texas's location in the U.S. | ||
| Founded | 1847 | |
| Named for | Nueces River | |
| Seat | Corpus Christi | |
| Largest city | Corpus Christi | |
| Area | ||
| • Total | 1,166 sq mi (3,020 km2) | |
| • Land | 838 sq mi (2,170 km2) | |
| • Water | 327 sq mi (847 km2), 28% | |
| Population | ||
| • (2010) | 340,223 | |
| • Density | 406/sq mi (157/km2) | |
| Congressional district | 27th | |
| Time zone | Central: UTC−6/−5 | |
| Website |
www | |

Nueces County is a county in the U.S. state of Texas. As of the 2010 census, the population was 340,223.[1] The county seat is Corpus Christi.[2] The county was formed in 1846 from portions of San Patricio County and organized the following year.[3] It is named for the Nueces River, which flows through the county.
Nueces County is part of the Corpus Christi, TX Metropolitan Statistical Area.
Geography
According to the U.S. Census Bureau, the county has an area of 1,166 square miles (3,020 km2), of which 838 square miles (2,170 km2) is land and 327 square miles (850 km2) (28%) is water.[4] It borders the Gulf of Mexico.
Major highways
Adjacent counties
- San Patricio County (north)
- Kleberg County (south)
- Jim Wells County (west)
Demographics
| Historical population | |||
|---|---|---|---|
| Census | Pop. | %± | |
| 1850 | 698 | — | |
| 1860 | 2,906 | 316.3% | |
| 1870 | 3,975 | 36.8% | |
| 1880 | 7,673 | 93.0% | |
| 1890 | 8,093 | 5.5% | |
| 1900 | 10,439 | 29.0% | |
| 1910 | 21,955 | 110.3% | |
| 1920 | 22,807 | 3.9% | |
| 1930 | 51,779 | 127.0% | |
| 1940 | 92,661 | 79.0% | |
| 1950 | 165,471 | 78.6% | |
| 1960 | 221,573 | 33.9% | |
| 1970 | 237,544 | 7.2% | |
| 1980 | 268,215 | 12.9% | |
| 1990 | 291,145 | 8.5% | |
| 2000 | 313,645 | 7.7% | |
| 2010 | 340,223 | 8.5% | |
| Est. 2016 | 361,350 | [5] | 6.2% |
| U.S. Decennial Census[6] 1850–2010[7] 2010–2014[1] | |||
As of the census[8] of 2000, there were 313,645 people, 110,365 households, and 79,683 families residing in the county. The population density was 375 people per square mile (145/km²). There were 123,041 housing units at an average density of 147 per square mile (57/km²). The racial makeup of the county was 72.03% White, 4.24% Black or African American, 0.64% Native American, 1.16% Asian, 0.07% Pacific Islander, 18.74% from other races, and 3.13% from two or more races. 55.78% of the population were Hispanic or Latino of any race.
There were 110,365 households out of which 36.30% had children under the age of 18 living with them, 51.80% were married couples living together, 15.30% had a female householder with no husband present, and 27.80% were non-families. 22.60% of all households were made up of individuals and 7.90% had someone living alone who was 65 years of age or older. The average household size was 2.79 and the average family size was 3.30.
In the county, the population was spread out with 28.40% under the age of 18, 10.50% from 18 to 24, 28.90% from 25 to 44, 21.10% from 45 to 64, and 11.20% who were 65 years of age or older. The median age was 33 years. For every 100 females there were 95.80 males. For every 100 females age 18 and over, there were 92.50 males.
The median income for a household in the county was $35,959, and the median income for a family was $41,066. Males had a median income of $31,571 versus $22,324 for females. The per capita income for the county was $17,036. About 14.70% of families and 18.20% of the population were below the poverty line, including 24.00% of those under age 18 and 15.80% of those age 65 or over.
Communities
Cities (multiple counties)
- Aransas Pass (partly in San Patricio and Aransas counties)
- Corpus Christi (county seat) (San Patricio and Aransas counties)
- Ingleside (mostly in San Patricio County)
- Portland (mostly in San Patricio County)
- San Patricio (mostly in San Patricio County)
Cities
Census-designated places
Unincorporated communities
Politics
| Year | Republican | Democratic | Third parties |
|---|---|---|---|
| 2016 | 48.6% 50,766 | 47.1% 49,198 | 4.3% 4,441 |
| 2012 | 51.0% 48,966 | 47.6% 45,772 | 1.4% 1,366 |
| 2008 | 51.8% 52,391 | 47.3% 47,912 | 0.9% 927 |
| 2004 | 56.8% 59,359 | 42.5% 44,439 | 0.7% 762 |
| 2000 | 51.3% 49,906 | 46.6% 45,349 | 2.1% 2,071 |
| 1996 | 40.2% 37,470 | 53.7% 50,009 | 6.1% 5,689 |
| 1992 | 36.5% 36,781 | 46.0% 46,317 | 17.6% 17,693 |
| 1988 | 48.3% 46,337 | 51.3% 49,209 | 0.4% 386 |
| 1984 | 53.7% 54,333 | 46.2% 46,721 | 0.2% 159 |
| 1980 | 46.8% 40,586 | 50.1% 43,424 | 3.0% 2,634 |
| 1976 | 38.0% 32,797 | 61.1% 52,755 | 0.9% 773 |
| 1972 | 55.4% 41,682 | 44.2% 33,277 | 0.4% 291 |
| 1968 | 31.6% 21,307 | 57.8% 39,025 | 10.6% 7,159 |
| 1964 | 25.8% 14,048 | 74.1% 40,426 | 0.2% 84 |
| 1960 | 39.1% 18,907 | 60.7% 29,361 | 0.2% 100 |
| 1956 | 49.9% 19,985 | 49.7% 19,912 | 0.4% 162 |
| 1952 | 48.6% 19,124 | 51.2% 20,156 | 0.2% 79 |
| 1948 | 25.6% 5,577 | 70.0% 15,240 | 4.4% 966 |
| 1944 | 24.2% 3,819 | 70.3% 11,091 | 5.5% 863 |
| 1940 | 23.9% 3,065 | 75.8% 9,740 | 0.3% 37 |
| 1936 | 15.5% 1,234 | 83.1% 6,597 | 1.4% 109 |
| 1932 | 12.6% 967 | 86.9% 6,659 | 0.5% 36 |
| 1928 | 45.4% 2,481 | 54.6% 2,985 | 0.1% 3 |
| 1920 | 21.6% 383 | 70.1% 1,246 | 8.3% 148 |
| 1916 | 16.9% 404 | 76.4% 1,830 | 6.8% 163 |
| 1912 | 6.5% 85 | 69.6% 910 | 23.9% 312 |
See also
References
- 1 2 "State & County QuickFacts". United States Census Bureau. Archived from the original on July 15, 2011. Retrieved December 22, 2013.
- ↑ "Find a County". National Association of Counties. Retrieved 2011-06-07.
- ↑ "Texas: Individual County Chronologies". Texas Atlas of Historical County Boundaries. The Newberry Library. 2008. Retrieved May 25, 2015.
- ↑ "2010 Census Gazetteer Files". United States Census Bureau. August 22, 2012. Retrieved May 5, 2015.
- ↑ "Population and Housing Unit Estimates". Retrieved June 9, 2017.
- ↑ "U.S. Decennial Census". United States Census Bureau. Retrieved May 5, 2015.
- ↑ "Texas Almanac: Population History of Counties from 1850–2010" (PDF). Texas Almanac. Retrieved May 5, 2015.
- ↑ "American FactFinder". United States Census Bureau. Retrieved 2011-05-14.
- ↑ Leip, David. "Dave Leip's Atlas of U.S. Presidential Elections". uselectionatlas.org. Retrieved 6 April 2018.
External links
| Wikimedia Commons has media related to Nueces County, Texas. |
- Nueces County government's website
- Nueces County in Handbook of Texas Online at the University of Texas
- Historic Nueces County materials, hosted by the Portal to Texas History.
Places adjacent to Nueces County, Texas | ||||||||||
|---|---|---|---|---|---|---|---|---|---|---|
| ||||||||||
Municipalities and communities of Nueces County, Texas, United States | ||
|---|---|---|
| Cities | | |
| CDPs | ||
| Other unincorporated communities | ||
| Footnotes | ‡This populated place also has portions in an adjacent county or counties | |

City of Corpus Christi | ||||||
|---|---|---|---|---|---|---|
| ||||||
| Education |
|  | ||||
| Military | ||||||
| Parks and Recreation | ||||||
| Sports | ||||||
| Tourism | ||||||
| Transportation | ||||||
| Government | ||||||