Riverside County, California
Riverside County is a county located in the southern portion of the U.S. state of California. As of the 2010 census, the population was 2,189,641,[3] making it the fourth-most populous county in California and the 10th-most populous in the United States. The name was derived from the city of Riverside, which is the county seat.[5]
Riverside County | |
|---|---|
| County of Riverside | |
 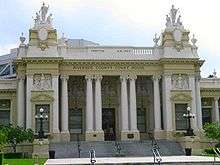   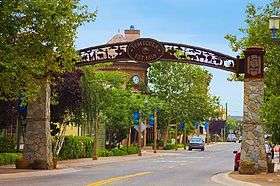 .jpg) Images, from top down, left to right: Riverside skyline, Riverside County Courthouse, Downtown Palm Springs, the North face of the San Jacinto Mountains in the Santa Rosa and San Jacinto Mountains National Monument, Old Town Temecula, the Blythe Intaglios | |
 Flag  Seal | |
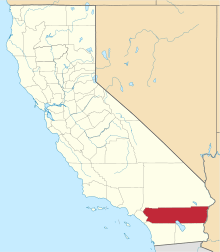 Location in the state of California | |
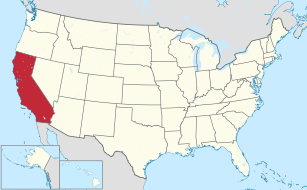 California's location in the United States | |
| Country | United States |
| State | California |
| Region | Inland Empire |
| Incorporated | May 9, 1893 |
| Named for | The City of Riverside, and the city's location beside the Santa Ana River |
| County seat | Riverside |
| Largest city (population) | Riverside |
| Government | |
| • Board of Supervisors | Supervisors[1]
|
| Area | |
| • Total | 7,303 sq mi (18,910 km2) |
| • Land | 7,206 sq mi (18,660 km2) |
| • Water | 97 sq mi (250 km2) |
| Highest elevation | 10,843 ft (3,305 m) |
| Lowest elevation | −234 ft (−71 m) |
| Population | |
| • Total | 2,189,641 |
| • Estimate (2019)[4] | 2,470,546 |
| • Density | 300/sq mi (120/km2) |
| Time zone | UTC−8 (Pacific Time Zone) |
| • Summer (DST) | UTC−7 (Pacific Daylight Time) |
| FIPS code | 06-065 |
| Website | www.CountyOfRiverside.us |
Riverside County is included in the Riverside-San Bernardino-Ontario Metropolitan Statistical Area, also known as the Inland Empire. The county is also included in the Los Angeles-Long Beach Combined Statistical Area.
Roughly rectangular, Riverside County covers 7,208 square miles (18,670 km2) in Southern California, spanning from the greater Los Angeles area to the Arizona border. Geographically, the county is mostly desert in the central and eastern portions, but has a Mediterranean climate in the western portion. Most of Joshua Tree National Park is located in the county. The resort cities of Palm Springs, Palm Desert, Indian Wells, La Quinta, Rancho Mirage, and Desert Hot Springs are all located in the Coachella Valley region of central Riverside County.
Between 2007 and 2011, large numbers of Los Angeles-area workers moved to the county to take advantage of more affordable housing.[6] Along with neighboring San Bernardino County, it was one of the fastest growing regions in the state prior to the recent changes in the regional economy. In addition, smaller, but significant, numbers of people have been moving into southwest Riverside County from the San Diego metropolitan area. The cities of Temecula and Murrieta accounted for 20% of the increase in population of the county between 2000 and 2007.
History
Etymology
When Riverside County was formed in 1893 it was named for the city of Riverside, the county seat. The city, founded in 1870, received its name for its location beside the Santa Ana River.[7][8]
Early history
The indigenous peoples of what is now Riverside County are the Luiseño, Cupeño and Cahuilla Indians.[9] The Luiseño territory includes the Aguanga and Temecula Basins, Elsinore Trough and eastern Santa Ana Mountains and southward into San Diego County. The Cahuilla territory is to the east and north of the Luiseño in the inland valleys, in the Santa Rosa and San Jacinto Mountains and the desert of the Salton Sink.
The first European settlement in the county was a Mission San Luis Rey de Francia estancia or farm at the Luiseño village of Temescal. In 1819, the Mission granted Leandro Serrano permission to occupy the land for the purpose of grazing and farming, and Serrano established Rancho Temescal. Serrano was mayordomo of San Antonio de Pala Asistencia for the Mission of San Luis Rey.
With the signing of the Treaty of Cordoba in 1821, Mexico gained its independence form Spain, but the San Gabriel Mission near what is now Los Angeles, California, continued to expand, and established Rancho San Gorgonio in 1824. The ranch was to be one of the Mission's principle rancherias, and the most distant, and it occupied most of today's San Gorgonio Pass area.[10][11]
Following Mexico's confiscation of Mission lands in 1833, a series of rancho land grants were made throughout the state. In the Riverside County this included; Rancho Jurupa in 1838, El Rincon in 1839, Rancho San Jacinto Viejo in 1842, Rancho San Jacinto y San Gorgonio in 1843, Ranchos La Laguna, Pauba, Temecula in 1844, Ranchos Little Temecula, Potreros de San Juan Capistrano in 1845, Ranchos San Jacinto Sobrante, La Sierra (Sepulveda), La Sierra (Yorba), Santa Rosa and San Jacinto Nuevo y Potrero in 1846.
New Mexican colonists founded the town of La Placita on the east side of the Santa Ana River at the northern extremity of what is now the city of Riverside in 1843.
When the initial 27 California counties were established in 1850, the area today known as Riverside County was divided between Los Angeles County and San Diego County. In 1853, the eastern part of Los Angeles County was used to create San Bernardino County. Between 1891 and 1893, several proposals and legislative attempts were put forth to form new counties in Southern California. These proposals included one for a Pomona County and one for a San Jacinto County. None of the proposals were adopted until a measure to create Riverside County was signed by Governor Henry H. Markham on March 11, 1893.[12]
County history
The new county was created from parts of San Bernardino County and San Diego County. On May 2, 1893, seventy percent of voters approved the formation of Riverside County. Voters chose the city of Riverside as the county seat, also by a large margin. Riverside County was officially formed on May 9, 1893, when the Board of Commissioners filed the final canvass of the votes.[12]
Riverside County is the birthplace of lane markings, thanks to Dr. June McCarroll in 1915 when she suggested her idea to the state government.
The county is also the location of the March Air Reserve Base, one of the oldest airfields continuously operated by the United States military. Established as the Alessandro Flying Training Field in February 1918, it was one of thirty-two U.S. Army Air Service training camps established after the United States entry into World War I in April 1917. The airfield was renamed March Field the following month for 2d Lieutenant Peyton C. March, Jr., the recently deceased son of the then-Army Chief of Staff, General Peyton C. March, who was killed in an air crash in Texas just fifteen days after being commissioned. March Field remained an active Army Air Service, then U.S. Army Air Corps installation throughout the interwar period, later becoming a major installation of the U.S. Army Air Forces during World War II. Renamed March Air Force Base in 1947 following the establishment of the U.S. Air Force, it was a major Strategic Air Command (SAC) installation throughout the Cold War. In 1996, it was transferred to the Air Force Reserve Command and gained its current name as a major base for the Air Force Reserve and the California Air National Guard.
Riverside county was a major focal point of the Civil Rights Movements in the US, especially the African-American sections of Riverside and heavily Mexican-American communities of the Coachella Valley visited by Cesar Chavez of the farm labor union struggle.
Riverside county has also been a focus of modern Native American Gaming enterprises. In the early 1980s, the county government attempted to shut down small bingo halls operated by the Morongo Band of Cahuilla Mission Indians and the Cabazon Band of Mission Indians. The tribes joined forces and fought the county all the way to the U.S. Supreme Court, which ruled in the tribes' favor on February 25, 1987.[13] In turn, Congress enacted the Indian Gaming Regulatory Act in 1988 to establish a legal framework for the relationship between Indian gaming and state governments. Naturally, both tribes now operate large casinos in the county: the Morongo Casino, Resort & Spa and the Fantasy Springs Resort Casino adjacent to Spotlight 29 Casino.
The county's population surpassed one million people in 1990 (year-round, would be 1980 with seasonal residents) when the current trend of high population growth as a major real estate destination began in the 1970s. Once strictly a place for long distance commuters to L.A. and later Orange County, the county and city of Riverside started becoming more of a place to establish new or relocated offices, corporations and finance centers in the late 1990s and 2000s. More light industry, manufacturing and truck distribution centers became major regional employers in the county.
Geography
According to the U.S. Census Bureau, the county has a total area of 7,303 square miles (18,910 km2), of which 7,206 square miles (18,660 km2) is land and 97 square miles (250 km2) (1.3%) is water.[14] It is the fourth-largest county in California by area. At roughly 180 miles (290 km) wide in the east-west dimension, the area of the county is massive. Riverside County, California is roughly the size of the State of New Jersey in total area. County government documents frequently cite the Colorado River town of Blythe as being a "three-hour drive" from the county seat, Riverside. Some view the areas west of San Gorgonio Pass as the Inland Empire portion of the county and the eastern part as either the Mojave Desert or Colorado Desert portion. There are probably at least three geomorphic provinces: the Inland Empire western portion, the Santa Rosa Mountains communities such as Reinhardt Canyon, and the desert region. Other possible subdivisions include tribal lands, the Colorado River communities, and the Salton Sea.
Flora and fauna

There is a diversity of flora and fauna within Riverside County. Vegetative plant associations feature many desert flora, but there are also forested areas within the county. The California endemic Blue oak, Quercus douglasii is at the southernmost part of its range in Riverside County.[15]
National protected areas
- Cleveland National Forest (part)
- Coachella Valley National Wildlife Refuge
- Dos Palmas Preserve
- Joshua Tree National Park (part)
- San Bernardino National Forest (part)
- Sand to Snow National Monument (part)
- Santa Rosa and San Jacinto Mountains National Monument
There are 19 official wilderness areas in Riverside County that are part of the National Wilderness Preservation System. Some are integral parts of the above protected areas, most (11 of the 19) are managed solely by the Bureau of Land Management, and some share management between the BLM and the relevant other agencies. Some extend into neighboring counties:
- Agua Tibia Wilderness (part)
- Beauty Mountain Wilderness
- Big Maria Mountains Wilderness
- Cahuilla Mountain Wilderness
- Chuckwalla Mountains Wilderness
- Joshua Tree Wilderness (part)
- Little Chuckwalla Mountains Wilderness (part)
- Mecca Hills Wilderness
- Orocopia Mountains Wilderness
- Palen/McCoy Wilderness
- Palo Verde Mountains Wilderness (part)
- Pinto Mountains Wilderness
- Rice Valley Wilderness
- Riverside Mountains Wilderness
- San Gorgonio Wilderness (part)
- San Jacinto Wilderness
- San Mateo Canyon Wilderness (part)
- Santa Rosa Wilderness
- South Fork San Jacinto Wilderness
State parks
- California Citrus State Historic Park
- Lake Perris State Recreation Area
- Mount San Jacinto State Park
County parks and trails
- Hurkey Creek Park[16]
- Idyllwild Park[17]
- Indio Hills Palms
- Jensen Alvarado Ranch
- Lake Cahuilla Recreation Area [18]
- Lake Skinner Recreation Area
- McCall Memorial Equestrian Park[19]
- Santa Rosa Plateau
Demographics
2011
| Population, race, and income | |||||
|---|---|---|---|---|---|
| Total population[20] | 2,154,844 | ||||
| White[20] | 1,422,604 | 66.0% | |||
| Black or African American[20] | 135,859 | 6.3% | |||
| American Indian or Alaska Native[20] | 21,493 | 1.0% | |||
| Asian[20] | 127,522 | 5.9% | |||
| Native Hawaiian or other Pacific Islander[20] | 6,955 | 0.3% | |||
| Some other race[20] | 359,512 | 16.7% | |||
| Two or more races[20] | 80,899 | 3.8% | |||
| Hispanic or Latino (of any race)[21] | 968,700 | 45.0% | |||
| Per capita income[22] | $24,516 | ||||
| Median household income[23] | $58,365 | ||||
| Median family income[24] | $65,457 | ||||
Places by population, race, and income
| Places by population and race | ||||||||
|---|---|---|---|---|---|---|---|---|
| Place | Type[25] | Population[20] | White[20] | Other[20] [note 1] |
Asian[20] | Black or African American[20] |
Native American[20] [note 2] |
Hispanic or Latino (of any race)[21] |
| Aguanga | CDP | 1,540 | 91.2% | 6.1% | 0.0% | 2.7% | 0.0% | 8.7% |
| Anza | CDP | 3,111 | 82.9% | 12.6% | 0.0% | 0.4% | 4.2% | 31.7% |
| Banning | City | 29,414 | 76.9% | 8.8% | 6.8% | 6.7% | 0.7% | 37.0% |
| Beaumont | City | 34,737 | 72.5% | 12.0% | 10.1% | 4.6% | 0.8% | 37.6% |
| Bermuda Dunes | CDP | 7,047 | 88.5% | 4.1% | 1.1% | 6.3% | 0.0% | 25.4% |
| Blythe | City | 21,102 | 62.4% | 18.8% | 2.0% | 15.9% | 0.9% | 48.5% |
| Cabazon | CDP | 1,729 | 87.9% | 7.6% | 0.0% | 3.5% | 0.9% | 40.8% |
| Calimesa | City | 7,923 | 91.0% | 7.6% | 1.0% | 0.5% | 0.0% | 19.5% |
| Canyon Lake | City | 10,663 | 92.9% | 4.8% | 1.1% | 0.9% | 0.3% | 9.7% |
| Cathedral City | City | 51,130 | 80.7% | 13.0% | 3.8% | 1.8% | 0.8% | 59.8% |
| Cherry Valley | CDP | 5,477 | 91.4% | 4.7% | 3.0% | 0.7% | 0.3% | 15.2% |
| Coachella | City | 39,442 | 63.5% | 34.8% | 0.1% | 1.3% | 0.4% | 96.6% |
| Corona | City | 152,111 | 65.8% | 17.4% | 9.2% | 5.7% | 1.9% | 42.8% |
| Coronita | CDP | 3,117 | 58.9% | 35.6% | 3.1% | 2.4% | 0.0% | 54.5% |
| Crestmore Heights | CDP | 665 | 100.0% | 0.0% | 0.0% | 0.0% | 0.0% | 82.1% |
| Desert Center | CDP | 150 | 83.3% | 16.0% | 0.0% | 0.7% | 0.0% | 26.7% |
| Desert Edge | CDP | 4,223 | 87.7% | 11.4% | 0.8% | 0.0% | 0.0% | 17.5% |
| Desert Hot Springs | City | 25,793 | 54.1% | 33.3% | 1.6% | 8.2% | 2.8% | 51.4% |
| Desert Palms | CDP | 6,592 | 95.7% | 1.4% | 2.2% | 0.2% | 0.5% | 3.1% |
| East Hemet | CDP | 18,334 | 74.4% | 18.7% | 2.2% | 2.8% | 1.8% | 36.4% |
| Eastvale | City | 53,437 | 48.8% | 17.4% | 21.9% | 10.9% | 1.1% | 40.1% |
| El Cerrito | CDP | 5,059 | 75.0% | 23.2% | 0.8% | 1.0% | 0.0% | 52.5% |
| El Sobrante | CDP | 12,617 | 57.9% | 16.4% | 17.2% | 8.6% | 0.0% | 21.3% |
| French Valley | CDP | 23,097 | 66.7% | 11.6% | 17.2% | 2.7% | 1.7% | 24.2% |
| Garnet | CDP | 5,701 | 66.0% | 28.2% | 1.8% | 3.7% | 0.2% | 69.4% |
| Glen Avon | CDP | 20,393 | 56.8% | 35.9% | 2.3% | 4.4% | 0.7% | 69.0% |
| Good Hope | CDP | 9,194 | 40.9% | 48.1% | 1.1% | 8.4% | 1.5% | 75.2% |
| Green Acres | CDP | 1,832 | 78.7% | 12.6% | 0.7% | 3.8% | 4.2% | 25.2% |
| Hemet | City | 77,752 | 73.5% | 16.6% | 2.7% | 5.2% | 2.0% | 34.1% |
| Highgrove | CDP | 4,155 | 72.8% | 15.0% | 5.9% | 4.1% | 2.2% | 67.3% |
| Home Gardens | CDP | 11,179 | 61.9% | 25.6% | 8.4% | 3.5% | 0.6% | 70.4% |
| Homeland | CDP | 6,441 | 68.1% | 30.0% | 0.5% | 0.0% | 1.5% | 55.7% |
| Idyllwild-Pine Cove | CDP | 2,309 | 95.5% | 1.0% | 3.5% | 0.0% | 0.0% | 16.5% |
| Indian Wells | City | 4,937 | 93.0% | 2.5% | 2.9% | 1.6% | 0.0% | 6.0% |
| Indio | City | 74,402 | 62.6% | 33.0% | 1.7% | 1.8% | 0.8% | 68.4% |
| Indio Hills | CDP | 876 | 60.7% | 36.2% | 0.0% | 3.1% | 0.0% | 69.5% |
| Lake Elsinore | City | 50,405 | 61.3% | 26.1% | 5.1% | 6.0% | 1.6% | 47.9% |
| Lakeland Village | CDP | 11,558 | 67.7% | 22.8% | 4.0% | 2.8% | 2.5% | 39.6% |
| Lake Mathews | CDP | 5,651 | 58.3% | 28.5% | 1.6% | 10.1% | 1.5% | 35.4% |
| Lake Riverside | CDP | 1,384 | 95.2% | 2.5% | 0.0% | 1.4% | 0.9% | 26.9% |
| Lakeview | CDP | 1,337 | 67.1% | 31.1% | 0.0% | 0.0% | 1.8% | 79.9% |
| La Quinta | City | 36,600 | 82.4% | 11.8% | 2.8% | 1.7% | 1.3% | 30.1% |
| March ARB | CDP | 791 | 91.7% | 0.1% | 3.0% | 5.1% | 0.1% | 11.4% |
| Meadowbrook | CDP | 2,995 | 40.8% | 49.5% | 5.0% | 4.4% | 0.3% | 66.7% |
| Mead Valley | CDP | 17,498 | 50.0% | 37.5% | 1.8% | 9.9% | 0.8% | 69.3% |
| Mecca | CDP | 8,233 | 55.3% | 43.2% | 0.4% | 0.0% | 1.1% | 96.2% |
| Menifee | City | 75,023 | 72.7% | 13.0% | 7.1% | 6.0% | 1.2% | 31.1% |
| Mesa Verde | CDP | 1,102 | 59.2% | 38.3% | 0.0% | 2.5% | 0.0% | 74.6% |
| Mira Loma | CDP | 20,923 | 58.6% | 36.2% | 1.7% | 3.2% | 0.3% | 67.5% |
| Moreno Valley | City | 190,977 | 50.4% | 25.6% | 5.4% | 17.6% | 1.0% | 54.4% |
| Mountain Center | CDP | 66 | 100.0% | 0.0% | 0.0% | 0.0% | 0.0% | 0.0% |
| Murrieta | City | 99,476 | 68.2% | 15.1% | 8.9% | 6.5% | 1.3% | 27.2% |
| Norco | City | 27,131 | 72.9% | 14.8% | 4.4% | 6.6% | 1.2% | 28.0% |
| North Shore | CDP | 2,600 | 56.3% | 38.5% | 0.0% | 1.2% | 3.9% | 93.2% |
| Nuevo | CDP | 5,582 | 76.4% | 19.2% | 1.2% | 1.7% | 1.5% | 49.0% |
| Oasis | CDP | 6,160 | 53.7% | 42.9% | 1.3% | 1.2% | 0.8% | 96.8% |
| Palm Desert | City | 48,769 | 86.7% | 7.1% | 4.2% | 1.0% | 1.0% | 22.2% |
| Palm Springs | City | 45,045 | 82.0% | 8.1% | 4.5% | 4.5% | 0.8% | 23.8% |
| Pedley | CDP | 11,229 | 72.3% | 18.9% | 4.1% | 3.9% | 0.8% | 47.9% |
| Perris | City | 65,993 | 43.8% | 38.8% | 3.6% | 12.4% | 1.4% | 70.7% |
| Rancho Mirage | City | 17,022 | 91.2% | 4.1% | 1.3% | 2.4% | 1.0% | 11.2% |
| Ripley | CDP | 706 | 45.6% | 45.2% | 0.0% | 9.2% | 0.0% | 87.1% |
| Riverside | City | 303,569 | 65.1% | 20.2% | 6.9% | 6.6% | 1.2% | 49.4% |
| Romoland | CDP | 1,604 | 78.1% | 9.9% | 0.0% | 12.0% | 0.0% | 21.9% |
| Rubidoux | CDP | 37,874 | 46.9% | 42.0% | 3.5% | 5.8% | 1.8% | 68.7% |
| San Jacinto | City | 42,722 | 61.4% | 26.4% | 5.1% | 4.7% | 2.5% | 53.4% |
| Sky Valley | CDP | 2,021 | 75.0% | 23.8% | 1.1% | 0.0% | 0.0% | 40.3% |
| Sunnyslope | CDP | 4,919 | 51.7% | 40.8% | 6.6% | 0.9% | 0.0% | 65.1% |
| Temecula | City | 98,189 | 72.2% | 12.2% | 9.5% | 3.7% | 2.4% | 25.2% |
| Temescal Valley | CDP | 23,288 | 74.6% | 10.0% | 9.9% | 4.4% | 1.1% | 30.4% |
| Thermal | CDP | 3,372 | 57.1% | 39.7% | 0.0% | 3.2% | 0.0% | 94.7% |
| Thousand Palms | CDP | 7,578 | 65.5% | 30.8% | 0.7% | 1.6% | 1.3% | 60.9% |
| Valle Vista | CDP | 14,579 | 77.0% | 13.8% | 2.3% | 3.5% | 3.4% | 26.2% |
| Vista Santa Rosa | CDP | 2,973 | 60.1% | 34.2% | 0.5% | 0.0% | 5.2% | 78.5% |
| Warm Springs | CDP | 2,196 | 55.8% | 35.5% | 7.3% | 1.0% | 0.3% | 40.1% |
| Whitewater | CDP | 533 | 55.5% | 34.0% | 10.5% | 0.0% | 0.0% | 31.7% |
| Wildomar | City | 31,452 | 68.0% | 23.4% | 3.6% | 3.9% | 1.1% | 37.7% |
| Winchester | CDP | 2,955 | 63.8% | 30.7% | 5.5% | 0.0% | 0.0% | 33.4% |
| Woodcrest | CDP | 14,519 | 78.0% | 13.6% | 4.1% | 3.8% | 0.4% | 33.0% |
| Places by population and income | |||||
|---|---|---|---|---|---|
| Place | Type[25] | Population[26] | Per capita income[22] | Median household income[23] | Median family income[24] |
| Aguanga | CDP | 1,540 | $22,716 | $47,754 | $49,275 |
| Anza | CDP | 3,111 | $19,101 | $46,890 | $49,563 |
| Banning | City | 29,414 | $21,150 | $37,373 | $47,243 |
| Beaumont | City | 34,737 | $26,458 | $66,132 | $79,800 |
| Bermuda Dunes | CDP | 7,047 | $35,634 | $64,171 | $69,375 |
| Blythe | City | 21,102 | $15,853 | $46,235 | $50,254 |
| Cabazon | CDP | 1,729 | $14,081 | $30,288 | $26,395 |
| Calimesa | City | 7,923 | $24,429 | $44,911 | $61,357 |
| Canyon Lake | City | 10,663 | $35,332 | $80,145 | $87,250 |
| Cathedral City | City | 51,130 | $21,734 | $45,088 | $47,834 |
| Cherry Valley | CDP | 5,477 | $30,877 | $53,245 | $56,523 |
| Coachella | City | 39,442 | $12,219 | $43,357 | $41,009 |
| Corona | City | 152,111 | $27,825 | $79,877 | $86,106 |
| Coronita | CDP | 3,117 | $26,448 | $75,378 | $89,028 |
| Crestmore Heights | CDP | 665 | $9,579 | $49,395 | $42,218 |
| Desert Center | CDP | 150 | $27,083 | $57,083 | $63,750 |
| Desert Edge | CDP | 4,223 | $22,937 | $35,394 | $43,750 |
| Desert Hot Springs | City | 25,793 | $15,671 | $34,606 | $37,780 |
| Desert Palms | CDP | 6,592 | $46,995 | $61,572 | $77,802 |
| East Hemet | CDP | 18,334 | $20,947 | $53,780 | $60,034 |
| Eastvale | City | 53,437 | $32,263 | $115,025 | $117,549 |
| El Cerrito | CDP | 5,059 | $26,328 | $69,301 | $76,344 |
| El Sobrante (Riverside County) | CDP | 12,617 | $31,251 | $103,100 | $102,409 |
| French Valley | CDP | 23,097 | $26,302 | $85,732 | $86,250 |
| Garnet | CDP | 5,701 | $14,344 | $37,956 | $43,171 |
| Glen Avon | CDP | 20,393 | $16,850 | $45,616 | $52,750 |
| Good Hope | CDP | 9,194 | $12,596 | $38,163 | $41,004 |
| Green Acres | CDP | 1,832 | $18,329 | $35,774 | $35,455 |
| Hemet | City | 77,752 | $19,236 | $34,273 | $42,951 |
| Highgrove | CDP | 4,155 | $16,888 | $41,545 | $43,495 |
| Home Gardens | CDP | 11,179 | $17,354 | $61,133 | $57,923 |
| Homeland | CDP | 6,441 | $14,997 | $38,624 | $41,820 |
| Idyllwild-Pine Cove | CDP | 2,309 | $32,868 | $55,495 | $63,491 |
| Indian Wells | City | 4,937 | $100,330 | $111,078 | $145,714 |
| Indio | City | 74,402 | $21,293 | $52,199 | $56,843 |
| Indio Hills | CDP | 876 | $27,488 | $81,831 | $80,959 |
| Lake Elsinore | City | 50,405 | $21,642 | $63,771 | $67,654 |
| Lakeland Village | CDP | 11,558 | $18,930 | $43,454 | $51,230 |
| Lake Mathews | CDP | 5,651 | $28,851 | $69,271 | $67,149 |
| Lake Riverside | CDP | 1,384 | $27,224 | $75,313 | $68,250 |
| Lakeview | CDP | 1,337 | $16,613 | $55,833 | $50,347 |
| La Quinta | City | 36,600 | $45,172 | $77,790 | $90,406 |
| March ARB | CDP | 791 | $38,084 | $69,438 | $95,357 |
| Meadowbrook | CDP | 2,995 | $11,904 | $31,397 | $30,550 |
| Mead Valley | CDP | 17,498 | $13,784 | $42,261 | $44,057 |
| Mecca | CDP | 8,233 | $7,980 | $26,176 | $22,383 |
| Menifee | City | 75,023 | $24,159 | $54,068 | $63,068 |
| Mesa Verde | CDP | 1,102 | $10,685 | $33,750 | $31,016 |
| Mira Loma | CDP | 20,923 | $18,652 | $66,635 | $68,810 |
| Moreno Valley | City | 190,977 | $18,246 | $56,768 | $58,446 |
| Mountain Center | CDP | 66 | $68,673 | $104,167 | |
| Murrieta | City | 99,476 | $29,198 | $80,792 | $89,683 |
| Norco | City | 27,131 | $27,361 | $84,812 | $93,156 |
| North Shore | CDP | 2,600 | $10,327 | $27,197 | $26,979 |
| Nuevo | CDP | 5,582 | $23,116 | $64,453 | $69,958 |
| Oasis | CDP | 6,160 | $7,372 | $27,340 | $25,194 |
| Palm Desert | City | 48,769 | $42,179 | $53,940 | $76,174 |
| Palm Springs | City | 45,045 | $38,054 | $45,989 | $54,642 |
| Pedley | CDP | 11,229 | $22,289 | $65,012 | $65,361 |
| Perris | City | 65,993 | $14,333 | $49,812 | $47,364 |
| Rancho Mirage | City | 17,022 | $66,770 | $76,261 | $99,250 |
| Ripley | CDP | 706 | $11,610 | $16,859 | $17,276 |
| Riverside | City | 303,569 | $22,806 | $57,555 | $64,618 |
| Romoland | CDP | 1,604 | $27,123 | $108,594 | $101,546 |
| Rubidoux | CDP | 37,874 | $17,432 | $52,108 | $53,082 |
| San Jacinto | City | 42,722 | $17,692 | $47,645 | $52,928 |
| Sky Valley | CDP | 2,021 | $22,201 | $35,473 | $44,506 |
| Sunnyslope | CDP | 4,919 | $22,121 | $68,313 | $71,468 |
| Temecula | City | 98,189 | $28,274 | $76,276 | $83,539 |
| Temescal Valley | CDP | 23,288 | $34,281 | $91,394 | $94,816 |
| Thermal | CDP | 3,372 | $8,801 | $33,311 | $27,675 |
| Thousand Palms | CDP | 7,578 | $19,881 | $43,435 | $41,550 |
| Valle Vista | CDP | 14,579 | $24,464 | $43,855 | $55,335 |
| Vista Santa Rosa | CDP | 2,973 | $16,345 | $52,026 | $54,375 |
| Warm Springs | CDP | 2,196 | $17,378 | $54,286 | $54,434 |
| Whitewater | CDP | 533 | $19,160 | $36,531 | $57,024 |
| Wildomar | City | 31,452 | $24,255 | $63,519 | $67,786 |
| Winchester | CDP | 2,955 | $22,236 | $69,798 | $81,063 |
| Woodcrest | CDP | 14,519 | $32,650 | $91,864 | $103,044 |
2010
| Historical population | |||
|---|---|---|---|
| Census | Pop. | %± | |
| 1900 | 17,897 | — | |
| 1910 | 34,696 | 93.9% | |
| 1920 | 50,297 | 45.0% | |
| 1930 | 81,024 | 61.1% | |
| 1940 | 105,524 | 30.2% | |
| 1950 | 170,046 | 61.1% | |
| 1960 | 306,191 | 80.1% | |
| 1970 | 459,074 | 49.9% | |
| 1980 | 663,166 | 44.5% | |
| 1990 | 1,170,413 | 76.5% | |
| 2000 | 1,545,387 | 32.0% | |
| 2010 | 2,189,641 | 41.7% | |
| Est. 2019 | 2,470,546 | [4] | 12.8% |
| U.S. Decennial Census[27] 1790–1960[28] 1900–1990[29] 1990–2000[30] 2010–2018[3] | |||
The 2010 United States Census reported that Riverside County had a population of 2,189,641. The racial makeup of Riverside County was 1,335,147 (61.0%) White (40.7% Non-Hispanic White), 140,543 (6.4%) African American, 23,710 (1.1%) Native American, 130,468 (6.0%) Asian (2.3% Filipino, 0.8% Chinese, 0.7% Vietnamese, 0.6% Korean, 0.5% Indian, 0.2% Japanese, 0.1% Cambodian, 0.1% Laotian, 0.1% Pakistani), 6,874 (0.3%) Pacific Islander, 448,235 (20.5%) from other races, and 104,664 (4.8%) from two or more races. Hispanic or Latino of any race were 995,257 persons (45.5%); 39.5% of Riverside County is Mexican, 0.8% Salvadoran, 0.7% Honduran, 0.6% Puerto Rican, 0.3% Cuban, and 0.2% Nicaraguan.[31]
| Population reported at 2010 United States Census | |||||||||
|---|---|---|---|---|---|---|---|---|---|
Population | American | American | Islander | races | more races | or Latino (of any race) | |||
| Riverside County | 2,189,641 | 1,335,147 | 140,543 | 23,710 | 130,468 | 6,874 | 448,235 | 104,664 | 995,257 |
cities | Population | American | American | Islander | races | more races | or Latino (of any race) | ||
| Banning | 29,603 | 19,164 | 2,165 | 641 | 1,549 | 39 | 4,604 | 1,441 | 12,181 |
| Beaumont | 36,877 | 23,163 | 2,276 | 544 | 2,845 | 83 | 6,058 | 1,908 | 14,864 |
| Blythe | 20,817 | 12,396 | 3,126 | 243 | 319 | 32 | 4,045 | 656 | 11,068 |
| Calimesa | 7,879 | 6,777 | 88 | 99 | 100 | 10 | 565 | 240 | 1,762 |
| Canyon Lake | 10,561 | 9,495 | 128 | 61 | 190 | 36 | 316 | 335 | 1,303 |
| Cathedral City | 51,200 | 32,537 | 1,344 | 540 | 2,562 | 55 | 12,008 | 2,154 | 30,085 |
| Coachella | 40,704 | 19,576 | 320 | 290 | 266 | 34 | 19,154 | 1,064 | 39,254 |
| Corona | 152,374 | 90,925 | 8,934 | 1,153 | 15,048 | 552 | 28,003 | 7,759 | 66,447 |
| Desert Hot Springs | 25,938 | 15,053 | 2,133 | 357 | 675 | 84 | 6,343 | 1,293 | 13,646 |
| Eastvale | 53,668 | 22,998 | 5,190 | 290 | 13,003 | 198 | 9,172 | 2,817 | 21,445 |
| Hemet | 78,657 | 53,259 | 5,049 | 1,223 | 2,352 | 284 | 12,371 | 4,119 | 28,150 |
| Indian Wells | 4,958 | 4,721 | 29 | 20 | 83 | 2 | 52 | 51 | 209 |
| Indio | 76,036 | 46,735 | 1,805 | 741 | 1,693 | 55 | 22,394 | 2,613 | 51,540 |
| La Quinta | 37,467 | 29,489 | 713 | 230 | 1,176 | 41 | 4,595 | 1,223 | 11,339 |
| Lake Elsinore | 51,821 | 31,067 | 2,738 | 483 | 2,996 | 174 | 11,174 | 3,189 | 25,073 |
| Menifee | 77,519 | 55,444 | 3,858 | 655 | 3,788 | 295 | 9,642 | 3,837 | 25,551 |
| Moreno Valley | 193,365 | 80,969 | 34,889 | 1,721 | 11,867 | 1,117 | 51,741 | 11,061 | 105,169 |
| Murrieta | 103,466 | 72,137 | 5,601 | 741 | 9,556 | 391 | 8,695 | 6,345 | 26,792 |
| Norco | 27,063 | 20,641 | 1,893 | 248 | 844 | 59 | 2,514 | 864 | 8,405 |
| Palm Desert | 48,445 | 39,957 | 875 | 249 | 1,647 | 55 | 4,427 | 1,235 | 11,038 |
| Palm Springs | 44,552 | 33,720 | 1,982 | 467 | 1,971 | 71 | 4,949 | 1,392 | 11,286 |
| Perris | 68,386 | 28,937 | 8,307 | 589 | 2,461 | 286 | 24,345 | 3,461 | 49,079 |
| Rancho Mirage | 17,218 | 15,267 | 256 | 94 | 651 | 14 | 598 | 338 | 1,964 |
| Riverside | 303,871 | 171,669 | 21,421 | 3,467 | 22,566 | 1,219 | 68,111 | 15,418 | 148,953 |
| San Jacinto | 44,199 | 25,272 | 2,928 | 812 | 1,341 | 124 | 11,208 | 2,514 | 23,109 |
| Temecula | 100,097 | 70,880 | 4,132 | 1,079 | 9,765 | 368 | 7,928 | 5,945 | 24,727 |
| Wildomar | 32,176 | 22,372 | 1,065 | 376 | 1,454 | 69 | 5,124 | 1,716 | 11,363 |
places | Population | American | American | Islander | races | more races | or Latino (of any race) | ||
| Aguanga | 1,128 | 929 | 11 | 20 | 24 | 0 | 109 | 35 | 274 |
| Anza | 3,014 | 2,411 | 34 | 57 | 36 | 3 | 347 | 126 | 791 |
| Bermuda Dunes | 7,282 | 5,433 | 180 | 63 | 241 | 11 | 1,126 | 228 | 2,371 |
| Cabazon | 2,535 | 1,751 | 135 | 90 | 38 | 14 | 358 | 149 | 1,135 |
| Cherry Valley | 6,362 | 5,450 | 63 | 102 | 87 | 4 | 451 | 205 | 1,347 |
| Coronita | 2,608 | 1,649 | 38 | 31 | 108 | 12 | 688 | 82 | 1,349 |
| Crestmore Heights | 384 | 229 | 2 | 2 | 6 | 0 | 133 | 12 | 263 |
| Desert Center | 204 | 164 | 1 | 3 | 2 | 0 | 25 | 9 | 38 |
| Desert Edge | 3,822 | 3,051 | 14 | 34 | 28 | 1 | 624 | 70 | 1,220 |
| Desert Palms | 6,957 | 6,728 | 59 | 16 | 95 | 5 | 15 | 39 | 177 |
| East Hemet | 17,418 | 12,257 | 679 | 323 | 275 | 29 | 2,997 | 858 | 6,778 |
| El Cerrito | 5,100 | 3,542 | 91 | 54 | 95 | 11 | 1,122 | 185 | 2,657 |
| El Sobrante | 12,723 | 7,435 | 1,010 | 73 | 2,240 | 36 | 1,312 | 617 | 3,626 |
| French Valley | 23,067 | 14,827 | 1,828 | 229 | 2,672 | 134 | 1,889 | 1,488 | 6,318 |
| Garnet | 7,543 | 4,247 | 203 | 96 | 62 | 10 | 2,636 | 289 | 5,580 |
| Glen Avon | 20,199 | 10,272 | 805 | 216 | 462 | 34 | 7,567 | 843 | 13,766 |
| Good Hope | 9,192 | 4,156 | 669 | 98 | 64 | 4 | 3,885 | 316 | 7,319 |
| Green Acres | 1,805 | 1,192 | 34 | 41 | 25 | 2 | 396 | 115 | 856 |
| Highgrove | 3,988 | 2,104 | 162 | 41 | 113 | 13 | 1,388 | 167 | 2,604 |
| Home Gardens | 11,570 | 5,275 | 364 | 126 | 667 | 51 | 4,500 | 587 | 8,524 |
| Homeland | 5,969 | 3,727 | 130 | 85 | 49 | 15 | 1,673 | 290 | 3,110 |
| Idyllwild-Pine Cove | 3,874 | 3,434 | 32 | 30 | 135 | 6 | 88 | 149 | 479 |
| Indio Hills | 972 | 542 | 6 | 15 | 5 | 1 | 391 | 12 | 657 |
| Lake Mathews | 5,890 | 4,239 | 253 | 59 | 193 | 3 | 891 | 252 | 1,808 |
| Lake Riverside | 1,173 | 1,042 | 21 | 16 | 2 | 8 | 46 | 38 | 186 |
| Lakeland Village | 11,541 | 7,764 | 285 | 131 | 168 | 21 | 2,575 | 597 | 5,114 |
| Lakeview | 2,104 | 1,117 | 15 | 48 | 7 | 2 | 842 | 73 | 1,350 |
| March ARB | 1,159 | 811 | 171 | 10 | 35 | 2 | 93 | 37 | 172 |
| Mead Valley | 18,510 | 8,383 | 1,515 | 179 | 259 | 17 | 7,484 | 673 | 13,395 |
| Meadowbrook | 3,185 | 2,034 | 130 | 19 | 51 | 4 | 798 | 149 | 1,765 |
| Mecca | 8,577 | 2,686 | 40 | 47 | 17 | 7 | 5,543 | 237 | 8,462 |
| Mesa Verde | 1,023 | 589 | 8 | 9 | 4 | 1 | 373 | 39 | 715 |
| Mira Loma | 21,930 | 12,577 | 383 | 240 | 465 | 43 | 7,250 | 972 | 14,846 |
| Mountain Center | 63 | 60 | 0 | 1 | 1 | 0 | 0 | 1 | 15 |
| North Shore | 3,477 | 1,394 | 33 | 26 | 18 | 5 | 1,884 | 117 | 3,313 |
| Nuevo | 6,447 | 4,011 | 113 | 91 | 82 | 16 | 1,810 | 324 | 3,514 |
| Oasis | 6,890 | 1,693 | 22 | 96 | 42 | 0 | 4,927 | 110 | 6,731 |
| Pedley | 12,672 | 7,509 | 381 | 119 | 554 | 48 | 3,520 | 541 | 6,773 |
| Ripley | 692 | 393 | 103 | 2 | 1 | 4 | 165 | 24 | 537 |
| Romoland | 1,684 | 958 | 65 | 8 | 35 | 12 | 514 | 92 | 865 |
| Rubidoux | 34,280 | 16,935 | 1,850 | 391 | 855 | 136 | 12,469 | 1,644 | 23,322 |
| Sky Valley | 2,406 | 1,961 | 35 | 34 | 21 | 3 | 282 | 70 | 682 |
| Sunnyslope | 5,153 | 3,017 | 96 | 55 | 76 | 10 | 1,696 | 203 | 3,630 |
| Temescal Valley | 22,535 | 14,785 | 1,507 | 131 | 2,157 | 74 | 2,565 | 1,316 | 6,753 |
| Thermal | 2,865 | 1,034 | 28 | 30 | 32 | 1 | 1,685 | 55 | 2,730 |
| Thousand Palms | 7,715 | 5,763 | 105 | 75 | 129 | 10 | 1,422 | 211 | 4,051 |
| Valle Vista | 14,578 | 11,542 | 440 | 252 | 283 | 41 | 1,351 | 669 | 4,027 |
| Vista Santa Rosa | 2,926 | 1,699 | 8 | 140 | 6 | 0 | 942 | 131 | 2,487 |
| Warm Springs | 2,676 | 1,673 | 119 | 24 | 102 | 14 | 606 | 138 | 1,232 |
| Whitewater | 859 | 636 | 37 | 31 | 21 | 0 | 97 | 37 | 267 |
| Winchester | 2,534 | 1,577 | 38 | 17 | 46 | 2 | 728 | 126 | 1,233 |
| Woodcrest | 14,347 | 10,418 | 716 | 69 | 715 | 41 | 1,716 | 672 | 4,113 |
unincorporated areas | Population | American | American | Islander | races | more races | or Latino (of any race) | ||
| All others not CDPs (combined) | 73,117 | 51,422 | 2,231 | 2,102 | 3,794 | 206 | 10,105 | 3,257 | 24,128 |
2000
As of the census[32] of 2000, there were 1,545,387 people, 506,218 households, and 372,576 families residing in the county. The population density was 214 people per square mile (83/km2). There were 584,674 housing units at an average density of 81 per square mile (31/km2). The racial makeup of the county was 65.6% White, 6.2% Black or African American, 1.2% Native American, 3.7% Asian, 0.3% Pacific Islander, 18.7% from other races, and 4.4% from two or more races. 36.2% of the population were Hispanic or Latino of any race. 9.2% were of German, 6.9% English, 6.1% Irish and 5.0% American ancestry according to Census 2000. 67.2% spoke English and 27.7% Spanish as their first language.
In 2006 the county had a population of 2,026,803, up 31.2% since 2000. In 2005 45.8% of the population was non-Hispanic whites. The percentages of African Americans, Asians and Native Americans remained relatively similar to their 2000 figures. The percentage of Pacific Islanders had majorly risen to 0.4. Hispanics now constituted 41% of the population.
There were 506,218 households, out of which 38.90% had children under the age of 18 living with them, 56.5% were married couples living together, 12.0% had a female householder with no husband present, and 26.4% were non-families. 20.7% of all households were made up of individuals, and 9.3% had someone living alone who was 65 years of age or older. The average household size was 3.0 and the average family size was 3.5.
In the county, the population was spread out, with 30.3% under the age of 18, 9.2% from 18 to 24, 28.9% from 25 to 44, 18.9% from 45 to 64, and 12.7% who were 65 years of age or older. The median age was 33 years. For every 100 females, there were 99.1 males. For every 100 females age 18 and over, there were 96.8 males.
The median income for a household in the county was $42,887, and the median income for a family was $48,409. Males had a median income of $38,639 versus $28,032 for females. The per capita income for the county was $18,689. About 10.7% of families and 14.2% of the population were below the poverty line, including 18.5% of those under age 18 and 7.6% of those age 65 or over.
Government and law enforcement
Government
Riverside County is organized as a General Law County under the provision of the California Government Code. The county has five supervisorial districts, and one supervisor is elected from each district every four years.[33]
In 1999, the County Board of Supervisors approved a multimillion-dollar planning effort to create the Riverside County Integrated Plan (RCIP) which was to encompass a completely new General Plan, regional transportation plan (CETAP) and Habitat Conservation Plan. The resultant General Plan adopted in 2003 was considered groundbreaking for its multidisciplinary approach to land use and conservation planning.[34][35]
Courts
The Riverside Superior Court is the state trial court for Riverside County with 14 courthouses: Riverside Historic Courthouse, Riverside Hall of Justice, Riverside Family Law Court, Riverside Juvenile Court, Southwest Justice Center – Murrieta, Moreno Valley Court, Banning Court, Hemet Court, Corona Court, Temecula Court, Larson Justice Center – Indio, Indio Juvenile Court, Palm Springs Court and Blythe Court.[36]
The main courthouse is the Riverside Historic Courthouse. This landmark, erected in 1903, was modeled after the Grand and Petit Palais in Paris, France. The courthouse, designed by Los Angeles architects Burnham and Bliesner, has a classical design – including a great hall that connects all the departments (courtrooms).[37] In 1994, the courthouse was closed for seismic retrofits due to the 1992 Landers and 1994 Northridge earthquakes. The courthouse was reopened and rededicated in September 1998.[38]
Riverside County hands down 1 in 6 death sentences in the US, in spite of it having less than 1% of the population.[39]
Law enforcement
Sheriff
The Riverside County Sheriff provides court protection, jail administration, and coroner services for all of Riverside County. It provides patrol, detective, and other police services for the unincorporated areas of the county plus by contract to the cities and towns of Coachella, Eastvale, Indian Wells, Jurupa Valley, La Quinta, Lake Elsinore, Menifee, Moreno Valley, Norco, Palm Desert, Perris, Rancho Mirage, San Jacinto, Temecula and Wildomar.[40]
Municipal Police
Municipal departments within the county are Banning, Beaumont, Blythe, Calimesa, Cathedral City, Corona, Desert Hot Springs, Hemet, Indio, Menifee, Murrieta, Palm Springs, Riverside, Riverside Community College.
Politics
Voter registration
| Population and registered voters | ||
|---|---|---|
| Total population[20] | 2,154,844 | |
| Registered voters[41][note 3] | 933,956 | 43.3% |
| Democratic[41] | 340,932 | 36.5% |
| Republican[41] | 377,774 | 40.4% |
| Democratic–Republican spread[41] | -36,842 | -3.9% |
| Independent[41] | 27,813 | 3.0% |
| Green[41] | 2,659 | 0.3% |
| Libertarian[41] | 5,145 | 0.6% |
| Peace and Freedom[41] | 2,324 | 0.2% |
| Americans Elect[41] | 53 | 0.0% |
| Other[41] | 7,472 | 0.8% |
| No party preference[41] | 169,784 | 18.2% |
Cities by population and voter registration
| Cities by population and voter registration | |||||||
|---|---|---|---|---|---|---|---|
| City | Population[20] | Registered voters[41] [note 3] |
Democratic[41] | Republican[41] | D–R spread[41] | Other[41] | No party preference[41] |
| Banning | 29,414 | 42.9% | 38.9% | 40.8% | -1.9% | 8.2% | 15.4% |
| Beaumont | 34,737 | 46.4% | 33.6% | 40.8% | -7.2% | 10.3% | 19.4% |
| Blythe | 21,102 | 23.1% | 40.3% | 36.0% | +4.3% | 9.2% | 18.3% |
| Calimesa | 7,923 | 53.7% | 29.0% | 48.8% | -19.8% | 10.1% | 16.2% |
| Canyon Lake | 10,663 | 57.3% | 19.9% | 57.5% | -37.6% | 9.7% | 16.8% |
| Cathedral City | 51,130 | 37.6% | 46.9% | 31.8% | +15.1% | 6.2% | 17.5% |
| Coachella | 39,442 | 25.0% | 72.1% | 13.1% | +59.0% | 2.9% | 12.8% |
| Corona | 158,391 | 43.0% | 32.9% | 43.3% | -10.4% | 7.2% | 19.2% |
| Desert Hot Springs | 25,793 | 35.5% | 44.0% | 32.7% | +11.3% | 8.3% | 18.0% |
| Eastvale | 53,437 | 40.6% | 38.0% | 34.2% | +3.8% | 6.9% | 23.6% |
| Hemet | 77,752 | 44.8% | 34.0% | 42.4% | -8.4% | 9.3% | 18.1% |
| Indian Wells | 4,937 | 59.8% | 19.0% | 62.7% | -43.7% | 6.5% | 14.4% |
| Indio | 74,402 | 39.7% | 47.9% | 33.0% | +14.9% | 6.0% | 15.4% |
| Jurupa Valley[note 4] | 57,464 | 58.4% | 40.1% | 37.1% | +3.0% | 7.1% | 18.3% |
| La Quinta | 36,600 | 52.8% | 30.6% | 47.4% | -16.8% | 8.1% | 17.2% |
| Lake Elsinore | 50,405 | 38.1% | 33.8% | 36.8% | -3.0% | 9.7% | 23.4% |
| Menifee | 75,023 | 52.0% | 31.1% | 44.2% | -13.1% | 9.6% | 19.0% |
| Moreno Valley | 190,977 | 43.5% | 48.1% | 33.5% | +14.6% | 5.6% | 14.8% |
| Murrieta | 99,476 | 48.8% | 25.3% | 48.2% | -22.9% | 9.2% | 20.8% |
| Norco | 27,131 | 45.0% | 25.2% | 52.5% | -27.3% | 8.2% | 17.2% |
| Palm Desert | 48,769 | 50.7% | 31.5% | 45.8% | -14.3% | 7.6% | 18.1% |
| Palm Springs | 45,045 | 53.7% | 50.9% | 26.7% | +24.2% | 7.3% | 17.9% |
| Perris | 65,993 | 36.3% | 54.2% | 27.8% | +26.4% | 5.1% | 14.6% |
| Rancho Mirage | 17,022 | 58.8% | 33.2% | 45.3% | -12.1% | 5.8% | 18.0% |
| Riverside | 303,569 | 44.0% | 38.5% | 39.0% | -0.5% | 7.5% | 17.6% |
| San Jacinto | 42,722 | 38.0% | 36.5% | 38.6% | -2.1% | 9.3% | 19.1% |
| Temecula | 98,189 | 48.0% | 25.2% | 47.6% | -22.4% | 9.7% | 21.4% |
| Wildomar | 31,452 | 47.4% | 26.8% | 45.4% | -18.6% | 10.3% | 21.4% |
Overview
Riverside has historically been regarded as a Republican county in presidential and congressional elections. In 1932, it was one of only two counties (the other being Benton County, Oregon) on the entire Pacific coast of the United States to vote for Hoover over Roosevelt.[42] In 2008, Barack Obama narrowly carried the county, becoming the first Democrat to do so since Bill Clinton in 1992, and only the fourth to do so since Roosevelt's national landslide of 1936. In 2012, Obama again carried the county, this time with a plurality of the vote.
| Year | GOP | DEM | Others |
|---|---|---|---|
| 2016 | 44.35% 333,243 | 49.73% 373,695 | 5.92% 44,453 |
| 2012 | 47.97% 318,127 | 49.62% 329,063 | 2.40% 15,926 |
| 2008 | 47.90% 310,041 | 50.21% 325,017 | 1.89% 12,241 |
| 2004 | 57.83% 322,473 | 41.04% 228,806 | 1.13% 6,300 |
| 2000 | 51.42% 231,955 | 44.90% 202,576 | 3.68% 16,596 |
| 1996 | 45.61% 178,611 | 43.05% 168,579 | 11.34% 44,423 |
| 1992 | 37.06% 159,457 | 38.64% 166,241 | 24.30% 104,577 |
| 1988 | 59.46% 199,979 | 39.58% 133,122 | 0.97% 3,247 |
| 1984 | 63.48% 182,324 | 35.53% 102,043 | 0.99% 2,835 |
| 1980 | 59.87% 145,642 | 31.51% 76,650 | 8.63% 20,986 |
| 1976 | 49.24% 97,774 | 48.46% 96,228 | 2.29% 4,556 |
| 1972 | 58.00% 108,120 | 38.41% 71,591 | 3.59% 6,693 |
| 1968 | 52.90% 83,414 | 38.78% 61,146 | 8.31% 13,110 |
| 1964 | 43.14% 61,165 | 56.79% 80,528 | 0.07% 95 |
| 1960 | 56.15% 65,855 | 43.38% 50,877 | 0.46% 544 |
| 1956 | 62.16% 56,766 | 37.34% 34,098 | 0.51% 465 |
| 1952 | 65.08% 51,692 | 33.93% 26,948 | 0.99% 788 |
| 1948 | 55.66% 32,209 | 40.28% 23,305 | 4.06% 2,350 |
| 1944 | 53.94% 23,168 | 45.26% 19,439 | 0.81% 346 |
| 1940 | 51.39% 21,779 | 47.20% 20,003 | 1.41% 598 |
| 1936 | 48.89% 16,674 | 49.88% 17,011 | 1.24% 422 |
| 1932 | 50.20% 14,112 | 45.37% 12,755 | 4.43% 1,245 |
| 1928 | 77.94% 17,600 | 21.12% 4,769 | 0.94% 212 |
| 1924 | 61.99% 9,619 | 8.49% 1,318 | 29.51% 4,579 |
| 1920 | 69.55% 9,124 | 21.33% 2,798 | 9.12% 1,196 |
| 1916 | 54.64% 7,452 | 33.44% 4,561 | 11.92% 1,626 |
| 1912 | 1.23% 124 | 29.33% 2,963 | 69.45% 7,016 |
| 1908 | 57.24% 3,229 | 24.36% 1,374 | 18.40% 1,038 |
| 1904 | 65.23% 2,638 | 16.77% 678 | 18.00% 728 |
| 1900 | 61.14% 2,329 | 29.77% 1,134 | 9.08% 346 |
| 1896 | 53.06% 2,063 | 43.31% 1,684 | 3.63% 141 |
In the United States House of Representatives, Riverside County is split between 4 congressional districts:[44]
- California's 36th congressional district, represented by Democrat Raul Ruiz
- California's 41st congressional district, represented by Democrat Mark Takano
- California's 42nd congressional district, represented by Republican Ken Calvert and
- California's 50th congressional district, seat currently vacant.
In the California State Senate, the county is split between 3 legislative districts:[45]
- the 23rd Senate District, represented by Republican Mike Morrell,
- the 28th Senate District, seat currently vacant, and
- the 31st Senate District, represented by Democrat Richard Roth.
In the California State Assembly, the county is split between 7 legislative districts:[46]
- the 42nd Assembly District, represented by Independent Chad Mayes,
- the 56th Assembly District, represented by Democrat Eduardo Garcia,
- the 60th Assembly District, represented by Democrat Sabrina Cervantes,
- the 61st Assembly District, represented by Democrat Jose Medina,
- the 67th Assembly District, represented by Republican Melissa Melendez,
- the 71st Assembly District, represented by Republican Randy Voepel, and
- the 75th Assembly District, represented by Republican Marie Waldron.
Riverside County voted 64.8% in favor of Proposition 8 which amended the California Constitution to ban same-sex marriages.
Crime
The following table includes the number of incidents reported and the rate per 1,000 persons for each type of offense.
| Population and crime rates | ||
|---|---|---|
| Population[20] | 2,154,844 | |
| Violent crime[47] | 7,284 | 3.38 |
| Homicide[47] | 91 | 0.04 |
| Forcible rape[47] | 424 | 0.20 |
| Robbery[47] | 2,602 | 1.21 |
| Aggravated assault[47] | 4,167 | 1.93 |
| Property crime[47] | 37,803 | 17.54 |
| Burglary[47] | 17,308 | 8.03 |
| Larceny-theft[47][note 5] | 35,135 | 16.31 |
| Motor vehicle theft[47] | 8,641 | 4.01 |
| Arson[47] | 283 | 0.13 |
Cities by population and crime rates
| Cities by population and crime rates | ||||||||
|---|---|---|---|---|---|---|---|---|
| City | Population[48] | Violent crimes[48] | Violent crime rate per 1,000 persons |
Property crimes[48] | Property crime rate per 1,000 persons | |||
| Banning | 30,541 | 148 | 4.85 | 708 | 23.18 | |||
| Beaumont | 38,072 | 103 | 2.71 | 1,342 | 35.25 | |||
| Blythe | 21,323 | 73 | 3.42 | 759 | 35.60 | |||
| Calimesa | 8,136 | 13 | 1.60 | 202 | 24.83 | |||
| Canyon Lake | 10,905 | 11 | 1.01 | 209 | 19.17 | |||
| Cathedral City | 52,867 | 204 | 3.86 | 1,576 | 29.81 | |||
| Coachella | 42,034 | 265 | 6.30 | 1,547 | 36.80 | |||
| Corona | 157,342 | 210 | 1.33 | 4,143 | 26.33 | |||
| Desert Hot Springs | 27,929 | 344 | 12.32 | 1,157 | 41.43 | |||
| Eastvale | 55,439 | 41 | 0.74 | 1,007 | 18.16 | |||
| Hemet | 81,213 | 406 | 5.00 | 3,486 | 42.92 | |||
| Indian Wells | 5,120 | 2 | 0.39 | 203 | 39.65 | |||
| Indio | 78,501 | 450 | 5.73 | 2,791 | 35.55 | |||
| Jurupa Valley | 97,577 | 312 | 3.20 | 3,174 | 32.53 | |||
| Lake Elsinore | 53,912 | 130 | 2.41 | 1,932 | 35.84 | |||
| La Quinta | 38,690 | 150 | 3.88 | 1,669 | 43.14 | |||
| Menifee | 80,047 | 87 | 1.09 | 1,942 | 24.26 | |||
| Moreno Valley | 199,673 | 706 | 3.54 | 6,371 | 31.91 | |||
| Murrieta | 106,839 | 70 | 0.66 | 1,715 | 16.05 | |||
| Norco | 27,850 | 56 | 2.01 | 580 | 20.83 | |||
| Palm Desert | 50,021 | 104 | 2.08 | 2,322 | 46.42 | |||
| Palm Springs | 45,996 | 302 | 6.57 | 2,232 | 48.53 | |||
| Perris | 70,616 | 240 | 3.40 | 2,081 | 29.47 | |||
| Rancho Mirage | 17,778 | 23 | 1.29 | 726 | 40.84 | |||
| Riverside | 313,532 | 1,389 | 4.43 | 10,818 | 34.50 | |||
| San Jacinto | 45,637 | 137 | 3.00 | 1,479 | 32.41 | |||
| Temecula | 103,414 | 97 | 0.94 | 2,440 | 23.59 | |||
| Wildomar | 33,227 | 53 | 1.60 | 707 | 21.28 | |||
Education
Universities and colleges
- Brandman University, part of the Chapman University System[49] – Moreno Valley, Palm Desert, Riverside and Temecula
- California Baptist University[50] – Riverside
- California Southern Law School[51] – Riverside
- California State University, San Bernardino, Palm Desert Campus[52] – Palm Desert
- California State University, San Marcos, Temecula Satellite Campus[53] – Temecula
- College of the Desert[54] – Palm Desert and Indio
- La Sierra University[55] – Riverside
- Mayfield College[56] – Cathedral City
- Mt. San Jacinto College[57] – Banning, Menifee, San Jacinto, Temecula
- Palo Verde College[58] – Blythe
- Riverside Community College District[59] – Moreno Valley, Norco, Riverside
- Santa Barbara Business College[60] – Palm Desert
- University of California, Riverside[61] – Palm Desert and Riverside
- University of Phoenix[62] – Murrieta and Palm Desert
Transportation
Major highways
.svg.png)
.svg.png)
.svg.png)
.svg.png)
.svg.png)
.svg.png)
.svg.png)


Public transportation
- Riverside Transit Agency serves the western third of Riverside County, as far east as Banning.
- SunLine Transit Agency serves Palm Springs and the Coachella Valley area.
- Palo Verde Valley Transit Agency provides service in Blythe, near the Arizona border.
- Pass Transit serves the San Gorgonio Pass communities.
- Corona Cruiser serves the city of Corona.
- Riverside County is also served by Greyhound buses.
Amtrak trains stop in Riverside and Palm Springs, and Amtrak California provides bus connections to the San Joaquins in Riverside, Beaumont, Palm Springs, Thousand Palms, Indio, Moreno Valley, Perris, Sun City, and Hemet.
Metrolink trains serve nine stations in Riverside County: Riverside-Downtown, Riverside-La Sierra, North Main-Corona, West Corona, Jurupa Valley/Pedley, Hunter Park/UCR, March Field-Moreno Valley, Perris-Downtown, and Perris-South.[63] These trains provide service to Orange, San Bernardino and Los Angeles counties seven days a week, with a primarily commuter-oriented schedule.
Airports
Military air bases
- March Air Reserve Base (former March Air Force Base)
Commercial airports
General aviation airports
- Banning Municipal Airport
- Bermuda Dunes Airport
- Blythe Airport
- Corona Municipal Airport
- Flabob Airport, Riverside
- French Valley Airport (Temecula Valley)
- Hemet-Ryan Airport (San Jacinto Valley)
- Jacqueline Cochran Regional Airport, Thermal (Coachella Valley)
- Perris Valley Airport
- Riverside Municipal Airport
Military installations
- Active
- Chocolate Mountain Aerial Gunnery Range
- March Air Reserve Base
- Naval Weapons Station Seal Beach Detachment Norco
- Naval Surface Warfare Center, Corona Division
- Historical
- Desert Training Center
- Blythe Army Airfield
- Desert Center Army Airfield
- Palm Springs Army Airfield
- Rice Army Airfield
- Shaver's Summit Army Airfield[64]
- Thermal Army Airfield (Also named Naval Air Facility Thermal (historical)[65])
- Hemet Army Airfield
- Desert Training Center
Points of interest
- List of museums in the Inland Empire (California)
- Gold Base, international headquarters of the Church of Scientology and Golden Era Productions[66][67]
- Living Desert Zoo and Gardens
- March Field Air Museum
- Mission Inn
- Orange Empire Railway Museum
- Orocopia Mountains Wilderness
- Palm Springs Desert Museum
- Ramona Bowl, Home of The Ramona Pageant
- Temecula Valley AVA Wine Region
- Western Science Center
Communities
Cities
| City | Year incorporated |
Population, 2019[68] |
Median household income, 2013[69] |
|---|---|---|---|
| Banning | 1913 | 31,221 | $36,509 |
| Beaumont | 1912 | 51,063 | $69,151 |
| Blythe | 1916 | 19,682 | $43,472 |
| Calimesa | 1990 | 9,160 | $44,911 |
| Canyon Lake | 1990 | 11,280 | $80,145 |
| Cathedral City | 1981 | 55,007 | $46,282 |
| Coachella | 1946 | 45,743 | $40,299 |
| Corona | 1896 | 169,868 | $80,557 |
| Desert Hot Springs | 1963 | 28,878 | $32,260 |
| Eastvale | 2010 | 64,157 | $113,154 |
| Hemet | 1910 | 85,334 | $29,679 |
| Indian Wells | 1967 | 5,470 | $111,078 |
| Indio | 1930 | 91,765 | $41,082 |
| Jurupa Valley | 2011 | 109,527 | $61,250 |
| Lake Elsinore | 1888 | 69,283 | N/A |
| La Quinta | 1982 | 41,748 | $67,444 |
| Menifee | 2008 | 94,756 | $56,735 |
| Moreno Valley | 1984 | 213,055 | $53,018 |
| Murrieta | 1991 | 116,223 | $72,496 |
| Norco | 1964 | 26,604 | $79,279 |
| Palm Desert | 1973 | 53,275 | $50,267 |
| Palm Springs | 1938 | 48,518 | $45,418 |
| Perris | 1911 | 79,291 | $36,229 |
| Rancho Mirage | 1973 | 18,528 | $76,261 |
| Riverside | 1883 | 331,360 | $51,331 |
| San Jacinto | 1888 | 49,215 | $44,851 |
| Temecula | 1989 | 114,761 | $66,869 |
| Wildomar | 2008 | 37,229 | $60,125 |
Unincorporated communities
- Aguanga
- Alberhill
- Alessandro
- Anza
- Arcilla
- Arnold Heights
- Belltown
- Bermuda Dunes
- Biskra Palms
- Bly
- Bonnie Bell
- Box Springs
- Cabazon
- Cactus City
- Cahuilla
- Cahuilla Hills
- Cherry Valley
- Chiriaco Summit
- Coronita
- Crestmore Heights
- Desert Beach
- Desert Center
- Desert Edge
- Desert Palms
- East Blythe
- Eagle Valley
- East Hemet
- Edgement
- El Cariso
- El Cerrito
- El Sobrante
- Fern Valley
- French Valley
- Garnet
- Gilman Hot Springs
- Good Hope
- Green Acres
- Highgrove
- Home Gardens
- Homeland
- Idyllwild
- Indio Hills
- La Cresta
- Lake Mathews
- Lake Riverside
- Lake Tamarisk
- Lakeland Village
- Lakeview
- Lost Lake
- March ARB
- Mead Valley
- Meadowbrook
- Mecca
- Mesa Verde
- Mortmar
- Mountain Center
- North Palm Springs
- North Shore
- Nuevo
- Oasis
- Pine Cove
- Pinyon Pines
- Radec
- Rancho Capistrano
- Ripley
- River Bend Lodge
- Romoland
- Sage
- Sky Valley
- Snow Creek
- Temescal Valley
- Thermal
- Thousand Palms
- Valerie
- Valle Vista
- Vista Santa Rosa
- Warm Springs
- Whitewater
- Winchester
- Woodcrest
Ghost towns
Indian reservations
Riverside County has 12 federally recognized Indian reservations, which ties it with Sandoval County, New Mexico for second most of any county in the United States. (Sandoval County, however, has two additional joint-use areas, shared between reservations. San Diego County, California has the most, with 18 reservations.)
- Agua Caliente Indian Reservation
- Augustine Indian Reservation
- Cabazon Indian Reservation
- Cahuilla Indian Reservation
- Colorado River Indian Reservation (partly in La Paz County, Arizona and San Bernardino County, California)
- Morongo Indian Reservation
- Pechanga Indian Reservation
- Ramona Village
- Santa Rosa Indian Reservation
- Soboba Band of Mission Indians
- Torres-Martinez Indian Reservation (partly in Imperial County, California)
- Twenty-Nine Palms Indian Reservation (partly in San Bernardino County)
Population ranking
The population ranking of the following table is based on the 2010 census of Riverside County.[71]
† county seat
| Rank | City/Town/etc. | Municipal type | Population (2010 Census) |
|---|---|---|---|
| 1 | † Riverside | City | 303,871 |
| 2 | Moreno Valley | City | 193,365 |
| 3 | Corona | City | 152,374 |
| 4 | Murrieta | City | 103,466 |
| 5 | Temecula | City | 100,097 |
| 6 | Hemet | City | 78,657 |
| 7 | Menifee | City | 77,519 |
| 8 | Indio | City | 76,036 |
| 9 | Perris | City | 68,386 |
| 10 | Eastvale | City | 53,668 |
| 11 | Lake Elsinore | City | 51,821 |
| 12 | Cathedral City | City | 51,200 |
| 13 | Palm Desert | City | 48,445 |
| 14 | Palm Springs | City | 44,552 |
| 15 | San Jacinto | City | 44,199 |
| 16 | Coachella | City | 40,704 |
| 17 | La Quinta | City | 37,467 |
| 18 | Beaumont | City | 36,877 |
| 19 | Jurupa Valley | City | 34,280 |
| 20 | Wildomar | City | 32,176 |
| 21 | Banning | City | 29,603 |
| 22 | Norco | City | 27,063 |
| 23 | Desert Hot Springs | City | 25,938 |
| 24 | Agua Caliente Indian Reservation[72] | AIAN | 24,781 |
| 25 | French Valley | CDP | 23,067 |
| 26 | Temescal Valley | CDP | 22,535 |
| 27 | Mira Loma (became part of Jurupa Valley in 2011) | CDP | 21,930 |
| 28 | Blythe | City | 20,817 |
| 29 | Glen Avon (became part of Jurupa Valley in 2011) | CDP | 20,199 |
| 30 | Mead Valley | CDP | 18,510 |
| 31 | East Hemet | CDP | 17,418 |
| 32 | Rancho Mirage | City | 17,218 |
| 33 | Valle Vista | CDP | 14,578 |
| 34 | Woodcrest | CDP | 14,347 |
| 35 | Pedley (became part of Jurupa Valley in 2011) | CDP | 12,672 |
| 36 | El Sobrante | CDP | 12,669 |
| 37 | Home Gardens | CDP | 11,570 |
| 38 | Lakeland Village | CDP | 11,541 |
| 39 | Canyon Lake | City | 10,561 |
| 40 | Good Hope | CDP | 9,192 |
| 41 | Mecca | CDP | 8,577 |
| 42 | Calimesa | City | 7,879 |
| 43 | Thousand Palms | CDP | 7,715 |
| 44 | Garnet | CDP | 7,543 |
| 45 | Bermuda Dunes | CDP | 7,282 |
| 46 | Desert Palms | CDP | 6,957 |
| 47 | Oasis | CDP | 6,890 |
| 48 | Nuevo | CDP | 6,447 |
| 49 | Cherry Valley | CDP | 6,362 |
| 50 | Homeland | CDP | 5,969 |
| 51 | Lake Mathews | CDP | 5,890 |
| 52 | Torres-Martinez Reservation[73] | AIAN | 5,594 |
| 53 | Sunnyslope | CDP | 5,153 |
| 54 | El Cerrito | CDP | 5,100 |
| 55 | Indian Wells | City | 4,958 |
| 56 | Highgrove | CDP | 3,988 |
| 57 | Idyllwild-Pine Cove | CDP | 3,874 |
| 58 | Desert Edge | CDP | 3,822 |
| 59 | North Shore | CDP | 3,477 |
| 60 | Meadowbrook | CDP | 3,185 |
| 61 | Anza | CDP | 3,014 |
| 62 | Vista Santa Rosa | CDP | 2,926 |
| 63 | Thermal | CDP | 2,865 |
| 64 | Warm Springs | CDP | 2,676 |
| 65 | Coronita | CDP | 2,608 |
| 66 | Cabazon | CDP | 2,535 |
| 67 | Winchester | CDP | 2,534 |
| 68 | Sky Valley | CDP | 2,406 |
| 69 | Lakeview | CDP | 2,104 |
| 70 | Green Acres | CDP | 1,805 |
| 71 | Colorado River Indian Reservation[74] | AIAN | 1,687 |
| 72 | Romoland | CDP | 1,684 |
| 73 | Lake Riverside | CDP | 1,173 |
| 74 | March ARB | CDP | 1,159 |
| 75 | Aguanga | CDP | 1,128 |
| 76 | Mesa Verde | CDP | 1,023 |
| 77 | Indio Hills | CDP | 972 |
| 78 | Morongo Reservation[75] | AIAN | 913 |
| 79 | Whitewater | CDP | 859 |
| 80 | Cabazon Reservation[76] | AIAN | 835 |
| 81 | Ripley | CDP | 692 |
| 82 | Soboba Reservation[77] | AIAN | 482 |
| 83 | Crestmore Heights | CDP | 384 |
| 84 | Pechanga Reservation[78] | AIAN | 346 |
| 85 | Desert Center | CDP | 204 |
| 86 | Cahuilla Reservation[79] | AIAN | 187 |
| 87 | Santa Rosa Reservation[80] | AIAN | 71 |
| 88 | Mountain Center | CDP | 63 |
| 89 | Romona Village[81] | AIAN | 13 |
| 90 | Twenty-Nine Reservation[82] | AIAN | 12 |
| 91 | Agustine Reservation[83] | AIAN | 11 |
Climate
| ||||||||||||||||||||||||||||||||||||||||||||||||||||||||||||||||||||||||||||||||||||||||||||||||||||||||||||||||||||||||||||
See also
Notes
- Other = Some other race + Two or more races
- Native American = Native Hawaiian or other Pacific Islander + American Indian or Alaska Native
- Percentage of registered voters with respect to total population. Percentages of party members with respect to registered voters follow.
- Population for this city obtained by summing the populations of Glen Avon, Mira Loma, Pedley, Rubidoux and Sunnyslope; see Jurupa Valley
- Only larceny-theft cases involving property over $400 in value are reported as property crimes.
References
- "Board of Supervisors". County of Riverside, California. Retrieved November 10, 2017.
- "San Jacinto Peak". Peakbagger.com. Retrieved February 8, 2015.
- "State & County QuickFacts". United States Census Bureau. Retrieved April 6, 2016.
- "American FactFinder". Archived from the original on June 2, 2013. Retrieved April 19, 2019.
- "Find a County". National Association of Counties. Retrieved June 7, 2011.
- Barragan, Bianca (February 6, 2014). "Why Are People Fleeing Los Angeles For San Bernardino?". La.curbed.com.
- Capace, Nancy (1999). Encyclopedia of California. North American Book Dist LLC. Page 392. ISBN 9780403093182.
- Gunther, pgs 427–429.
- Native American Indian Resources web site; Federally Recognized California Tribes.
- Gunther, Jane Davies (1984). Riverside County, California, Place Names; Their Origins and Their Stories. Riverside, California. pp. 456–461.
- Gudde, Erwin G. (1949). California Place Names (1st ed.). Berkley and Los Angeles: University of California Press. p. 305.
- Fitch, pages v–viii.
- California v. Cabazon Band, 480 U.S. 202 (1987).
- "2010 Census Gazetteer Files". United States Census Bureau. August 22, 2012. Retrieved October 3, 2015.
- C. Michael Hogan. 2008 Blue Oak: Quercus douglasii, GlobalTwitcher.com, ed. N. Stromberg Archived February 28, 2012, at the Wayback Machine
- "Archived copy". Archived from the original on December 23, 2017. Retrieved December 22, 2017.CS1 maint: archived copy as title (link)
- "Archived copy". Archived from the original on December 23, 2017. Retrieved December 22, 2017.CS1 maint: archived copy as title (link)
- "Lake Cahuilla Brochure" (PDF). Riverside County Regional Park and Open-Space District. September 2013.
- "Archived copy". Archived from the original on December 23, 2017. Retrieved December 22, 2017.CS1 maint: archived copy as title (link)
- U.S. Census Bureau. American Community Survey, 2011 American Community Survey 5-Year Estimates, Table B02001. U.S. Census website. Retrieved October 26, 2013.
- U.S. Census Bureau. American Community Survey, 2011 American Community Survey 5-Year Estimates, Table B03003. U.S. Census website. Retrieved October 26, 2013.
- U.S. Census Bureau. American Community Survey, 2011 American Community Survey 5-Year Estimates, Table B19301. U.S. Census website. Retrieved October 21, 2013.
- U.S. Census Bureau. American Community Survey, 2011 American Community Survey 5-Year Estimates, Table B19013. U.S. Census website. Retrieved October 21, 2013.
- U.S. Census Bureau. American Community Survey, 2011 American Community Survey 5-Year Estimates, Table B19113. U.S. Census website. Retrieved October 21, 2013.
- U.S. Census Bureau. American Community Survey, 2011 American Community Survey 5-Year Estimates. U.S. Census website. Retrieved October 21, 2013.
- U.S. Census Bureau. American Community Survey, 2011 American Community Survey 5-Year Estimates, Table B01003. U.S. Census website. Retrieved October 21, 2013.
- "U.S. Decennial Census". United States Census Bureau. Retrieved October 3, 2015.
- "Historical Census Browser". University of Virginia Library. Retrieved October 3, 2015.
- Forstall, Richard L., ed. (March 27, 1995). "Population of Counties by Decennial Census: 1900 to 1990". United States Census Bureau. Retrieved October 3, 2015.
- "Census 2000 PHC-T-4. Ranking Tables for Counties: 1990 and 2000" (PDF). United States Census Bureau. April 2, 2001. Retrieved October 3, 2015.
- "2010 Census P.L. 94-171 Summary File Data". United States Census Bureau.
- "U.S. Census website". United States Census Bureau. Retrieved May 14, 2011.
- Fitch, page 1.
- Riverside County RCIP General Plan (2003), The Planning Center
- Riverside County Integrated Project: An innovative model for integrating land use, transportation and conservation planning (2007), Edward J. Blakely Center for Sustainable Suburban Development
- "Locations". Archived from the original on December 21, 2010. Retrieved August 31, 2017.
- "Rededication of the Historic Riverside County Courthouse". Archived from the original on March 22, 2007. Retrieved August 31, 2017.
- "California Courts Online - The most comprehensive resource on California court information". Courtinfo.ca.gov. August 17, 2018. Retrieved August 17, 2018.
- Barford, Vanessa. "Why is one county handing down one in six US death sentences?". BBC News. Retrieved December 25, 2015.
- Riverside County Sheriff's web site
- "Wayback Machine" (PDF). July 27, 2013. Archived from the original (PDF) on July 27, 2013. Retrieved August 17, 2018.
- 1932 Presidential Election County Map Photo by rarohla | Photobucket. Media.photobucket.com. Retrieved on July 29, 2013.
- Leip, David. "Dave Leip's Atlas of U.S. Presidential Elections". Uslelctionatlas.org.
- "Counties by County and by District". California Citizens Redistricting Commission. Archived from the original on September 30, 2013. Retrieved September 24, 2014.
- "Communities of Interest - Counties". California Citizens Redistricting Commission. Archived from the original on October 23, 2015. Retrieved September 24, 2014.
- "Communities of Interest - Counties". California Citizens Redistricting Commission. Archived from the original on October 23, 2015. Retrieved September 24, 2014.
- Office of the Attorney General, Department of Justice, State of California. Table 11: Crimes – 2009 Archived December 2, 2013, at the Wayback Machine. Retrieved November 14, 2013.
- United States Department of Justice, Federal Bureau of Investigation. Crime in the United States, 2012, Table 8 (California). Retrieved November 14, 2013.
- "About - Brandman University". Archived from the original on October 13, 2010.
- "California Baptist University". Calbaptist.edu.
- "California Southern Law School". Cslawschool.com.
- "Palm Desert Campus". Pdc.csusb.edu.
- "California State University San Marcos at Temecula". Csusm.edu.
- "About College of the Desert". Collegeofthedesert.edu. Archived from the original on December 29, 2011. Retrieved August 31, 2017.
- "About La Sierra University". Lasierra.edu.
- "Mayfield Colleges". Mayfieldcollege.edu.
- "Welcome to Mt. San Jacinto College". Msjc.edu.
- "Palo Verde College". Paloverde.edu.
- "Riverside Community College District". Archived from the original on September 29, 2010. Retrieved August 31, 2017.
- "Why SBBCollege In California?". Sbbcollege.edu. Archived from the original on December 5, 2010. Retrieved October 8, 2010.
- "About UCR". Ucr.edu.
- "Campus Locations". Phoenix.edu.
- Pages - Project Details. Compassblueprint.org. Retrieved on July 29, 2013.
- "Shaver's Summit Army Air Field (historical)". Geographic Names Information System. United States Geological Survey.
- "Naval Air Facility Thermal (historical)". Geographic Names Information System. United States Geological Survey.
- "Rural Studio is Scientology Headquarters." San Jose Mercury News. August 13, 1991. 6B California News. Retrieved on October 21, 2009.(subscription required)
- Kelly, David. "Scientology foes blast new Riverside County law." Los Angeles Times. January 10, 2009. 1. Retrieved on October 21, 2009.
- "City and Town Population Totals: 2010-2019". United States Census Bureau. Retrieved May 24, 2020.
- Husing, John (October 2013). "Inland Empire City Profile 2013" (PDF). Inland Empire Quarterly Economic Report. Redlands: Economics & Politics, Inc. 25 (4). Retrieved August 16, 2019.
- "GNIS Detail - Eden". Geonames.usgs.gov. Retrieved August 17, 2018.
- "US Census Bureau 2010 Census". census.gov.
- "US Census Bureau 2010 Census Interactive Population Map". census.gov.
- "US Census Bureau 2010 Census Interactive Population Map". census.gov.
- "US Census Bureau 2010 Census Interactive Population Map". census.gov.
- "US Census Bureau 2010 Census Interactive Population Map". census.gov.
- "US Census Bureau 2010 Census Interactive Population Map". census.gov.
- "US Census Bureau 2010 Census Interactive Population Map". census.gov.
- "US Census Bureau 2010 Census Interactive Population Map". census.gov.
- "US Census Bureau 2010 Census Interactive Population Map". census.gov.
- "US Census Bureau 2010 Census Interactive Population Map". census.gov.
- "US Census Bureau 2010 Census Interactive Population Map". census.gov.
- "US Census Bureau 2010 Census Interactive Population Map". census.gov.
- "US Census Bureau 2010 Census Interactive Population Map". census.gov.
- "NASA Earth Observations Data Set Index". NASA. Retrieved January 30, 2016.
Bibliography
- Fitch, Robert J. (1993). Profile of a Century: Riverside County, California, 1893–1993. Riverside County Historical Commission Press. pp. 300. OCLC 28661359
- Gunther, Jane Davies. Riverside County, California, Place Names; Their Origins and Their Stories, Riverside, CA, 1984. LOC catalog number: 84–72920.
- Holmes, Elmer Wallace (1912 (republished 2010 by BiblioLife)). History of Riverside County, California: With Biographical Sketches of the Leading Men and Women of the County Who Have Been Identified with Its Growth. Los Angeles, CA: Historic Record Company. pp. 783 (840 in 2010 republishing). ISBN 978-1174620966. OCLC 7951260. Check date values in:
|date=(help) - Lech, Steve (2004). Along the Old Roads: A History of the Portion of Southern California that became Riverside County: 1772–1893. Steve Lech. p. 902. OCLC 56035822.
- Lech, Steve (2012). Pioneers of Riverside County: The Spanish, Mexican and Early American Periods. Charleston, SC: The History Press. p. 173. ISBN 978-1609498313. OCLC 814373331. (a reprint of the first three chapters of Along the Old Roads.)
Further reading
- Brown, James B. (1985). Harvest of the Sun: An Illustrated History of Riverside County. Northridge, CA: Windsor Publications. p. 244. ISBN 0-89781-145-3. OCLC 11916170.
- Gunther, Jane Davies (1984). Riverside County, California, Place Names. Their Origins and Their Stories: Rubidoux Printing Co. 1984. LCCN 84-72920
- History of San Bernardino and Riverside Counties, Volume 1.
- History of San Bernardino and Riverside Counties, Volume 2.
- History of San Bernardino and Riverside Counties Volume 3.
- Justitia Rei Publicae Fundamentum: Justice is the Foundation of the Republic. Riverside, CA: Riverside Museum Press. 1998. p. 34. ISBN 0-935661-28-X. OCLC 40695255.
External links
| Wikimedia Commons has media related to Riverside County, California. |
| Wikivoyage has a travel guide for Riverside County. |
- Official website

- Official Riverside County, Department of Information Technology website
- Official Riverside County Sheriff website
- Official Riverside County Fire Dept. website
- Official Riverside County District Attorney's Office website
- Official Riverside County Regional Parks District website
- Riverside County, California at Curlie
Places adjacent to Riverside County, California | ||||||||||
|---|---|---|---|---|---|---|---|---|---|---|
| ||||||||||

| Authority control |
|
|---|