Mora County, New Mexico
Mora County (Spanish: Condado de Mora) is a county in the US state of New Mexico. As of the 2010 census, the population was 4,881.[1] Its county seat is the census-designated place (CDP) Mora.[2] The county has another CDP, Watrous, a village, Wagon Mound, New Mexico, and 12 smaller unincorporated settlements. Mora became a formal county in the US, in what was then the New Mexico Territory, on February 1, 1860.[3] Ecclesiastically, the county is within the Roman Catholic Archdiocese of Santa Fe.[3] County population peaked at about 14,000 around 1920, declining to about 4,000 to 5,000 since the 1970s; the 2018 estimate was 4,506.
Mora County | |
|---|---|
 Mora County Courthouse in Mora | |
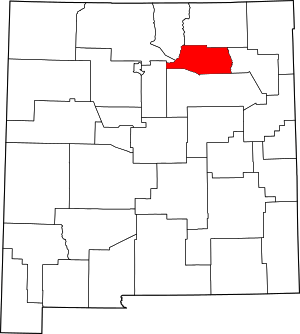 Location within the U.S. state of New Mexico | |
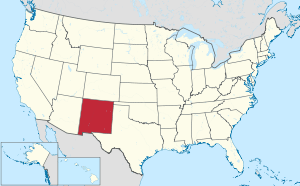 New Mexico's location within the U.S. | |
| Coordinates: 36°01′N 104°56′W | |
| Country | |
| State | |
| Founded | February 1, 1860 |
| Seat | Mora |
| Largest village | Mora |
| Area | |
| • Total | 1,934 sq mi (5,010 km2) |
| • Land | 1,931 sq mi (5,000 km2) |
| • Water | 2.3 sq mi (6 km2) 0.1%% |
| Population | |
| • Estimate (2019) | 4,521 |
| • Density | 2.5/sq mi (1.0/km2) |
| Time zone | UTC−7 (Mountain) |
| • Summer (DST) | UTC−6 (MDT) |
| Congressional district | 3rd |
| Website | countyofmora |
History
Prior to Spanish conquest, the Mora area was Native American country. Although not an area of heavy settlement by stationary tribes such as the Puebloans, the Mora Valley was often used by nomadic nations, including the Ute, Navajo, and Apache.
Spanish period
Hispano settlers had occupied lands within the Mora Valley without legal title ever since Governor Juan Bautista de Anza of Nuevo México (then under the authority of the Spanish Empire) made peace with the Comanches in the late 18th century, opening up the east side of the Sangre de Cristo Mountains for settlement.[4] The Mora Valley then became a travel-way for various Spanish explorers and others. It was not permanently inhabited by colonists until the early 19th century. The written history of the settlement of Mora dates to Christian missionary church-building in 1818,[3] three years before Mexican independence from Spain.
Mexican period, and permanent settlement
Mora valley was more formally and broadly settled in 1835.[4] The settlers came primarily from Las Trampas, but also from Picuris and Embudo,[5] then from Santa Cruz de La Cañada, Taos, and the Ojo Caliente area, and later still from the southern part of New Mexico, moving on from the San Miguel del Vado Land Grant, and also coming in via Las Vegas, New Mexico.[3] The families each received a strip of property by a September 28, 1835, land grant of Centralist Republic of Mexico Governor of New Mexico Albino Pérez.[4] The grant gave land title for over 800,000 acres (1,250 square miles; approx. 323,800 hectares, or 3,200 km2) in Mora Valley[6] to various families willing to relocate; estimates vary from 25[6] to 76[4] families.
Texan and Mexican–American War periods
When the Republic of Texas seceded from Mexico on March 2, 1836, it claimed but did not actually control eastern New Mexico, including what is now Mora County. The town of Mora was raided unsuccessfully in 1843 by a group of freebooters from the more narrowly defined Republic of Texas, on the pretext of stopping cattle rustling but with a clear intent of horse theft and taking the local women and children as slaves). The annexation of Texas by the United States on February 19, 1846, and US General Stephen W. Kearny's taking of Santa Fe, New Mexico in August of that year, made these lands subject to American control under the Kearny Code and the US provisional government of New Mexico, but the area remained in the minds of many long-term residents part of the Republic of Mexico under President Santa Ana.
During the Mexican–American War, beginning on April 25, 1846, much of New Mexico including Mora County was subject to the military occupation of United States under martial law. During the Taos Revolt of the war, Mexican-nationalist Hispano and Puebloan militia fought the United States Army, repelling a small force in the First Battle of Mora on January 24, 1847, only to endure the village and surrounding ranches, farms, and crops being burned to the ground in the Second Battle of Mora on February 1, effectively ending active rebellion in the area. The provisional government's first legislature met on December 6, 1847, beginning American civil government in the region.
In the United States
The Mexican–American War ended February 3, 1848, with Mora Valley and rest of the region then under formal US control, as the Mexican Cession of the Treaty of Guadalupe Hidalgo relinquished all claims by Mexico to lands north of the Rio Grande. Still claimed by state of Texas until the Compromise of 1850, the New Mexico Territory, with smaller boundaries, was formalized on September 9 of that year.
A US Army installation, Fort Union, was built in 1851 in Mora Valley. It encroached on 8 square miles of private lands of the Mora Grant for its entire span of operation, without permission of or compensation to the local land owners. This led to a protracted legal controversy, reaching all the way to the General Land Office, the Secretary of War, and the US Congress;[7] Nevertheless, the nearby fort and its garrison provided a stable source of income to local farmers, and several grist mills were founded in Mora, including a successful one opened in 1855 by regional trader and Taos Revolt US volunteer cavalry veteran Ceran St. Vrain. The US county of Mora was established in the territory on February 1, 1860.[3] A church was built in the Mora Valley village of Chacon in 1864,[3] reflecting additional settlement into the area. The Mora Grant / Fort Union land dispute was exacerbated in 1868 by an order of President Andrew Johnson that established a government timber reservation that encompassed 53 more square miles the private grant land (the entire Turkey Mountains sub-range of the Sangre de Cristos). After being rebuilt twice, the fort eventually closed in 1891, still without restitution to land-owners, despite the Kearny Code, Hidalgo Treaty, and other agreements supposedly guaranteeing continuity of Spanish and Mexican land-grant rights.
New Mexico (with reduced land area) became the 47th US state on January 6, 1912, despite concerns in Congress that the population was insufficiently assimilated into American culture, especially after an influx of Mexican refugees from 1910 onward, fleeing the Mexican Revolution. These newcomers mostly settled far south of Mora County, though it remained primarily Spanish-speaking, as it was still largely populated by the same, now-expanded, families who had settled area three-quarters of a century earlier). On February 22, 1916, the common lands of the Mora Grant were sold to the State Investment Company at the courthouse door in Mora.[8] Without access to the grazing and timbering lands, many residents sought work outside Mora.[8]
In April 2013, Mora County became the first county in the United States to ban oil and gas drilling on public and private lands.[9][10]
The modern county seat, Mora, is a census-designated place, and consists of four neighboring settlements and three plazas.
Geography
According to the US Census Bureau, the county has a total area of 1,934 square miles (5,010 km2), of which 1,931 square miles (5,000 km2) is land and 2.3 square miles (6.0 km2) (0.1%) is water.[11] The highest point in the county is the summit of Truchas Peak at 13,102 feet or 3,993 metres.
Adjacent counties
- Colfax County – north
- Harding County – east
- San Miguel County – south
- Santa Fe County – west
- Rio Arriba County – west
- Taos County – northwest
National protected areas
- Carson National Forest (part)
- Fort Union National Monument
- Kiowa National Grassland (part)
- Santa Fe National Forest (part)
- Rio Mora National Wildlife Refuge
Demographics
| Historical population | |||
|---|---|---|---|
| Census | Pop. | %± | |
| 1910 | 12,611 | — | |
| 1920 | 13,915 | 10.3% | |
| 1930 | 10,322 | −25.8% | |
| 1940 | 10,981 | 6.4% | |
| 1950 | 8,720 | −20.6% | |
| 1960 | 6,028 | −30.9% | |
| 1970 | 4,673 | −22.5% | |
| 1980 | 4,205 | −10.0% | |
| 1990 | 4,264 | 1.4% | |
| 2000 | 5,180 | 21.5% | |
| 2010 | 4,881 | −5.8% | |
| Est. 2019 | 4,521 | [12] | −7.4% |
| US Decennial Census[13] 1790–1960[14] 1900–1990[15] 1990–2000[16] 2010–2016[1] | |||
2000 census
As of the 2000 census,[17] there were 5,180 people, 2,017 households, and 1,397 families living in the county. The population density was 3 people per square mile (1/km2). There were 2,973 housing units at an average density of 2 per square mile (1/km2). The racial makeup of the county was 58.88% White, 0.10% Black or African American, 1.14% Native American, 0.12% Asian, 36.97% from other races, and 2.80% from two or more races; 81.64% of the population were Hispanic or Latino of any race.
There were 2,017 households out of which 31.20% had children under the age of 18 living with them, 50.5% were married couples living together, 11.9% had a female householder with no husband present, and 30.7% were non-families. Of all households, 26.90% were made up of individuals, and 10.6% had someone living alone who was 65 years of age or older. The average household size was 2.54 and the average family size was 3.08.
In the county, the population was spread out with 26.70% under the age of 18, 7.5% from 18 to 24, 24.3% from 25 to 44, 26.1% from 45 to 64, and 15.4% who were 65 years of age or older. The median age was 40 years. For every 100 females there were 102 males. For every 100 females age 18 and over, there were 100.2 males.
The median income for a household in the county was US$24,518, and the median income for a family was $27,648. Males had a median income of $24,483 versus $18,000 for females. The per capita income for the county was $12,340. About 20.90% of families and 25.40% of the population were below the poverty line, including 25.90% of those under age 18 and 18.40% of those age 65 or over.
2010 census
As of the 2010 census, there were 4,881 people, 2,114 households, and 1,295 families living in the county.[18] The population density was 2.5 inhabitants per square mile (0.97/km2). There were 3,232 housing units at an average density of 1.7 per square mile (0.66/km2).[19] The racial makeup of the county was 70.9% white, 1.3% American Indian, 0.7% black or African American, 0.3% Asian, 23.5% from other races, and 3.3% from two or more races. Those of Hispanic or Latino origin made up 81.0% of the population.[18] In terms of ancestry, and 0.8% were American.[20]
Of the 2,114 households, 26.4% had children under the age of 18 living with them, 43.5% were married couples living together, 10.9% had a female householder with no husband present, 38.7% were non-families, and 33.2% of all households were made up of individuals. The average household size was 2.31 and the average family size was 2.92. The median age was 46.0 years.[18]
The median income for a household in the county was $37,784 and the median income for a family was $42,122. Males had a median income of $42,992 versus $42,630 for females. The per capita income for the county was $22,035. About 10.5% of families and 11.9% of the population were below the poverty line, including 10.8% of those under age 18 and 20.6% of those age 65 or over.[21]
Places of interest
Communities
Village
Village
Unincorporated communities
Politics
| Year | Republican | Democratic | Third parties |
|---|---|---|---|
| 2016 | 27.2% 665 | 62.9% 1,536 | 9.8% 240 |
| 2012 | 22.8% 595 | 74.9% 1,955 | 2.3% 61 |
| 2008 | 20.6% 569 | 78.6% 2,168 | 0.8% 23 |
| 2004 | 32.8% 928 | 66.4% 1,876 | 0.8% 22 |
| 2000 | 30.5% 668 | 66.5% 1,456 | 3.1% 67 |
| 1996 | 23.4% 561 | 68.8% 1,646 | 7.8% 187 |
| 1992 | 27.6% 668 | 64.2% 1,555 | 8.2% 198 |
| 1988 | 36.3% 923 | 62.9% 1,601 | 0.8% 21 |
| 1984 | 44.5% 1,017 | 54.0% 1,235 | 1.5% 35 |
| 1980 | 43.5% 1,037 | 53.4% 1,274 | 3.1% 74 |
| 1976 | 38.3% 904 | 60.9% 1,438 | 0.8% 19 |
| 1972 | 50.3% 1,165 | 49.0% 1,135 | 0.8% 18 |
| 1968 | 51.0% 1,155 | 47.2% 1,069 | 1.9% 42 |
| 1964 | 40.1% 1,014 | 59.7% 1,509 | 0.2% 4 |
| 1960 | 48.1% 1,349 | 51.9% 1,458 | |
| 1956 | 58.5% 1,736 | 41.5% 1,233 | |
| 1952 | 56.6% 1,849 | 43.3% 1,413 | 0.1% 4 |
| 1948 | 55.1% 1,893 | 44.8% 1,541 | 0.1% 3 |
| 1944 | 55.6% 1,783 | 44.4% 1,425 | 0.0% 1 |
| 1940 | 55.4% 2,440 | 44.5% 1,960 | 0.0% 1 |
| 1936 | 47.8% 2,259 | 52.1% 2,460 | 0.1% 6 |
| 1932 | 32.8% 1,444 | 67.2% 2,962 | 0.0% 1 |
| 1928 | 52.6% 1,998 | 47.4% 1,799 | |
| 1924 | 50.9% 2,197 | 48.4% 2,087 | 0.7% 32 |
| 1920 | 52.9% 2,478 | 46.5% 2,179 | 0.6% 28 |
| 1916 | 51.2% 1,590 | 48.4% 1,505 | 0.4% 13 |
| 1912 | 43.8% 1,022 | 43.0% 1,002 | 13.2% 308 |
References
- "State & County QuickFacts". United States Census Bureau. Archived from the original on June 6, 2011. Retrieved September 30, 2013.
- "Find a County". National Association of Counties. Retrieved June 7, 2011.
- "Locating Catholic Church Records in Mora County". New Mexico Genealogical Society. 2008. Archived from the original on April 26, 2015. Retrieved January 24, 2018.
- Pearce, T. M. (1965). "Mora". New Mexico Place Names: A Geographical Dictionary. Albuquerque: University of New Mexico Press. p. 104. OCLC 420847.
- Noble, David Grant (1994). "Mora". Pueblos, Villages, Forts & Trails: A Guide to New Mexico’s Past. Albuquerque: University of New Mexico Press. pp. 175–179. ISBN 0-8263-1514-3.
- Writers Program of the Work Projects Administration in the State of New Mexico (1945). New Mexico, a Guide to the Colorful State. Albuquerque: University of New Mexico Press. p. 378. ISBN 978-1-62376-030-4. Retrieved October 19, 2014.
- US Congress, Senate, Committee on Military Affairs, "Title to Certain Military and Timber Reservations", Senate Report 621, 45th Congress, 3rd Session, 1879, pp. 3-4
- Sálaz, Rubén Darío (1999). New Mexico: A Brief Multi-History. Albuquerque: Cosmic House. p. 430. ISBN 0-932492-05-3.
- Baynham, Jacob (June 2014). "Blowout". Outside: 28.
- Baynham, Jacob (June 2014). "The Mother of All Anti-fracking Tools – Deep Green Resistance Southwest Coalition". Outside Magazine. Retrieved October 19, 2014 – via DeepGreenResistance.org.
- "2010 Census Gazetteer Files". United States Census Bureau. August 22, 2012. Archived from the original on January 1, 2015. Retrieved January 2, 2015.
- "Population and Housing Unit Estimates". Retrieved December 24, 2019.
- "U.S. Decennial Census". United States Census Bureau. Retrieved January 2, 2015.
- "Historical Census Browser". University of Virginia Library. Retrieved January 2, 2015.
- "Population of Counties by Decennial Census: 1900 to 1990". United States Census Bureau. Retrieved January 2, 2015.
- "Census 2000, PHC-T-4, Ranking Tables for Counties: 1990 and 2000" (PDF). United States Census Bureau. Retrieved January 2, 2015.
- "U.S. Census website". United States Census Bureau. Retrieved January 31, 2008.
- "DP-1 Profile of General Population and Housing Characteristics: 2010 Demographic Profile Data". United States Census Bureau. Archived from the original on February 13, 2020. Retrieved January 24, 2016.
- "Population, Housing Units, Area, and Density: 2010 – County". United States Census Bureau. Archived from the original on February 13, 2020. Retrieved January 24, 2016.
- "DP02 Selected Social Characteristics in the United States – 2006–2010 American Community Survey 5-Year Estimates". United States Census Bureau. Archived from the original on February 13, 2020. Retrieved January 24, 2016.
- "DP03 Selected Economic Characteristics – 2006–2010 American Community Survey 5-Year Estimates". United States Census Bureau. Archived from the original on February 13, 2020. Retrieved January 1, 2016.
- Leip, David. "Dave Leip's Atlas of U.S. Presidential Elections". uselectionatlas.org. Retrieved April 1, 2018.
External links
Places adjacent to Mora County, New Mexico | ||||||||||
|---|---|---|---|---|---|---|---|---|---|---|
| ||||||||||
Municipalities and communities of Mora County, New Mexico, United States | ||
|---|---|---|
| Village | Map of New Mexico highlighting Mora County | |
| CDPs | ||
| Other unincorporated communities | ||
Santa Fe (capital) | ||
| Topics |
| |
| Society | ||
| Regions |
| |
| Cities | ||
| Counties | ||

| Authority control |
|
|---|