Franklin County, Washington
Franklin County is a county located in the U.S. state of Washington. As of the 2010 census, its population was 78,163.[1] The county seat and largest city is Pasco.[2] The county was formed out of Whitman County on November 28, 1883[3] and is named for Benjamin Franklin.[4]
Franklin County | |
|---|---|
| Franklin County | |
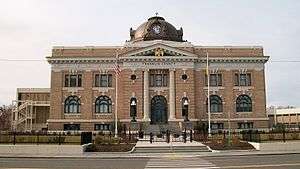 Franklin County Courthouse in Pasco | |
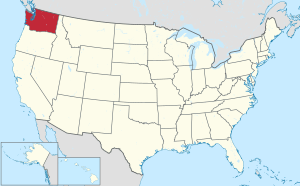
 Location within the U.S. state of Washington | |
 Washington's location within the U.S. | |
| Coordinates: 46°32′N 118°54′W | |
| Country | |
| State | |
| Founded | November 28, 1883 |
| Named for | Benjamin Franklin |
| Seat | Pasco |
| Largest city | Pasco |
| Area | |
| • Total | 1,265 sq mi (3,280 km2) |
| • Land | 1,242 sq mi (3,220 km2) |
| • Water | 23 sq mi (60 km2) 1.8%% |
| Population (2010) | |
| • Total | 78,163 |
| • Estimate (2019) | 95,222 |
| • Density | 71/sq mi (27/km2) |
| Time zone | UTC−8 (Pacific) |
| • Summer (DST) | UTC−7 (PDT) |
| Congressional district | 4th |
| Website | www |
Franklin County is included in the Kennewick-Richland, WA Metropolitan Statistical Area.
Geography
According to the U.S. Census Bureau, the county has a total area of 1,265 square miles (3,280 km2), of which 1,242 square miles (3,220 km2) is land and 23 square miles (60 km2) (1.8%) is water.[5]
Geographic features
Major highways
Adjacent counties
- Adams County - north
- Whitman County - east
- Walla Walla County - southeast
- Columbia County - southeast
- Benton County - southwest
- Grant County - northwest
National protected areas
- Hanford Reach National Monument (part)
- Saddle Mountain National Wildlife Refuge (part)
Demographics
| Historical population | |||
|---|---|---|---|
| Census | Pop. | %± | |
| 1890 | 696 | — | |
| 1900 | 486 | −30.2% | |
| 1910 | 5,153 | 960.3% | |
| 1920 | 5,877 | 14.1% | |
| 1930 | 6,137 | 4.4% | |
| 1940 | 6,307 | 2.8% | |
| 1950 | 13,563 | 115.0% | |
| 1960 | 23,342 | 72.1% | |
| 1970 | 25,816 | 10.6% | |
| 1980 | 35,025 | 35.7% | |
| 1990 | 37,473 | 7.0% | |
| 2000 | 49,347 | 31.7% | |
| 2010 | 78,163 | 58.4% | |
| Est. 2019 | 95,222 | [6] | 21.8% |
| U.S. Decennial Census[7] 1790–1960[8] 1900–1990[9] 1990–2000[10] 2010–2019[1] | |||
Franklin County, along with Adams County, have the highest per capita percentage of Latino residents in the state.[11]
2010 census
As of the 2010 United States Census, there were 78,163 people, 23,245 households, and 18,163 families residing in the county.[12] The population density was 62.9 inhabitants per square mile (24.3/km2). There were 24,423 housing units at an average density of 19.7 per square mile (7.6/km2).[13] The racial makeup of the county was 60.5% white, 1.9% black or African American, 1.8% Asian, 0.7% American Indian, 0.1% Pacific islander, 31.8% from other races, and 3.2% from two or more races. Those of Hispanic or Latino origin made up 51.2% of the population.[12] In terms of ancestry, 13.1% were German, 6.8% were English, 6.5% were Irish, and 3.3% were American.[14]
Of the 23,245 households, 49.9% had children under the age of 18 living with them, 57.9% were married couples living together, 13.4% had a female householder with no husband present, 21.9% were non-families, and 16.4% of all households were made up of individuals. The average household size was 3.28 and the average family size was 3.68. The median age was 28.4 years.[12]
The median income for a household in the county was $47,749 and the median income for a family was $52,218. Males had a median income of $40,604 versus $29,517 for females. The per capita income for the county was $18,660. About 16.5% of families and 19.9% of the population were below the poverty line, including 25.6% of those under age 18 and 13.7% of those age 65 or over.[15]
The 2019 county population is estimated to be 95,222, a 21.8% increase since 2010. This far outpaces Washington State's overall growth of 13.2% over the same time interval, and puts Franklin County among the fastest-growing counties in the nation.
In 2018 the county contained 28,647 housing units.
Communities
Census-designated places
Government
Franklin County has a Board of County Commissioners which is the governmental authority of the county. The board consists of three commissioners; they are elected by the voters and serve four-year terms.[16] Other elected county officials include Assessor, Auditor, Clerk, Coroner, Prosecuting Attorney, Sheriff, and Treasurer.[17]
Politics
| Year | Republican | Democratic | Third parties |
|---|---|---|---|
| 2016 | 53.7% 13,206 | 36.1% 8,886 | 10.3% 2,522 |
| 2012 | 60.4% 13,748 | 36.9% 8,398 | 2.7% 618 |
| 2008 | 60.8% 12,037 | 37.2% 7,361 | 2.0% 397 |
| 2004 | 66.6% 10,757 | 32.1% 5,188 | 1.3% 214 |
| 2000 | 63.1% 8,594 | 34.2% 4,653 | 2.7% 367 |
| 1996 | 49.2% 5,946 | 41.0% 4,961 | 9.8% 1,189 |
| 1992 | 41.0% 4,486 | 34.2% 3,743 | 24.8% 2,708 |
| 1988 | 56.7% 6,488 | 41.7% 4,772 | 1.7% 192 |
| 1984 | 63.0% 7,724 | 35.3% 4,328 | 1.8% 216 |
| 1980 | 61.3% 7,327 | 31.1% 3,719 | 7.7% 915 |
| 1976 | 54.5% 5,671 | 42.0% 4,369 | 3.5% 363 |
| 1972 | 56.8% 5,972 | 36.8% 3,867 | 6.5% 684 |
| 1968 | 44.2% 4,234 | 42.2% 4,038 | 13.6% 1,303 |
| 1964 | 35.9% 3,615 | 63.4% 6,375 | 0.7% 68 |
| 1960 | 44.7% 4,201 | 54.8% 5,156 | 0.6% 52 |
| 1956 | 46.5% 3,763 | 53.4% 4,322 | 0.1% 5 |
| 1952 | 53.9% 3,291 | 45.8% 2,798 | 0.3% 18 |
| 1948 | 37.3% 1,541 | 61.1% 2,525 | 1.6% 64 |
| 1944 | 41.0% 1,381 | 58.6% 1,974 | 0.5% 16 |
| 1940 | 36.3% 1,084 | 62.6% 1,868 | 1.0% 31 |
| 1936 | 24.0% 622 | 68.8% 1,784 | 7.3% 188 |
| 1932 | 33.9% 838 | 62.3% 1,540 | 3.8% 95 |
| 1928 | 62.0% 1,339 | 37.0% 799 | 1.1% 23 |
| 1924 | 31.2% 709 | 10.4% 237 | 58.4% 1,330 |
| 1920 | 44.5% 839 | 30.3% 571 | 25.3% 477 |
| 1916 | 35.0% 671 | 57.9% 1,110 | 7.1% 135 |
| 1912 | 16.4% 293 | 34.3% 612 | 49.3% 880[lower-alpha 1] |
| 1908 | 53.0% 643 | 40.0% 485 | 7.1% 86 |
| 1904 | 69.3% 572 | 27.0% 223 | 3.8% 31 |
| 1900 | 37.4% 52 | 58.3% 81 | 4.3% 6 |
| 1896 | 24.8% 38 | 73.9% 113 | 1.3% 2 |
| 1892 | 23.5% 28 | 45.4% 54 | 31.1% 37 |
Franklin is a strongly Republican county in Presidential elections. No Democratic presidential candidate has carried Franklin County since Lyndon B. Johnson’s 1964 landslide, and the last Democratic gubernatorial candidate it backed was Dixy Lee Ray in 1976.[19]
Notes
- The leading "other" candidate, Progressive Theodore Roosevelt, received 525 votes, while Socialist candidate Eugene Debs received 302 votes, Prohibition candidate Eugene Chafin received 38 votes, and Socialist Labor candidate Arthur Reimer received 15 votes.
References
- "State & County QuickFacts". United States Census Bureau. Archived from the original on July 17, 2011. Retrieved January 7, 2014.
- "Find a County". National Association of Counties. Archived from the original on May 31, 2011. Retrieved June 7, 2011.
- "Milestones for Washington State History — Part 2: 1851 to 1900". HistoryLink.org. March 6, 2003.
- Gannett, Henry (1905). The Origin of Certain Place Names in the United States. Govt. Print. Off. pp. 131.
- "2010 Census Gazetteer Files". United States Census Bureau. August 22, 2012. Retrieved July 5, 2015.
- "Population and Housing Unit Estimates". Retrieved April 11, 2020.
- "U.S. Decennial Census". United States Census Bureau. Retrieved January 7, 2014.
- "Historical Census Browser". University of Virginia Library. Retrieved January 7, 2014.
- "Population of Counties by Decennial Census: 1900 to 1990". United States Census Bureau. Retrieved January 7, 2014.
- "Census 2000 PHC-T-4. Ranking Tables for Counties: 1990 and 2000" (PDF). United States Census Bureau. Retrieved January 7, 2014.
- "Franklin County, WA". DataUSA.
In 2017, there were 1.28 times more Hispanic or Latino residents (46.8k people) in Franklin County, WA than any other race or ethnicity
- "DP-1 Profile of General Population and Housing Characteristics: 2010 Demographic Profile Data". United States Census Bureau. Archived from the original on February 13, 2020. Retrieved March 1, 2016.
- "Population, Housing Units, Area, and Density: 2010 - County". United States Census Bureau. Archived from the original on February 13, 2020. Retrieved March 1, 2016.
- "DP02 SELECTED SOCIAL CHARACTERISTICS IN THE UNITED STATES – 2006-2010 American Community Survey 5-Year Estimates". United States Census Bureau. Archived from the original on February 13, 2020. Retrieved March 1, 2016.
- "DP03 SELECTED ECONOMIC CHARACTERISTICS – 2006-2010 American Community Survey 5-Year Estimates". United States Census Bureau. Archived from the original on February 13, 2020. Retrieved March 1, 2016.
- "Franklin County Commissioner's Office". Franklin County, Washington. Retrieved 2020-04-25.
- "Franklin County Elections Department". Franklin County, Washington. Retrieved 2020-04-25.
- Leip, David. "Dave Leip's Atlas of U.S. Presidential Elections". uselectionatlas.org. Retrieved April 6, 2018.
- Dave Leip. "Gubernatorial General Election Map Comparison – Washington". Dave Leip’s U.S. Election Atlas.
Further reading
External links
- Franklin County, Washington at HistoryLink.org
- Tri-City Regional Chamber of Commerce
Places adjacent to Franklin County, Washington | ||||||||||
|---|---|---|---|---|---|---|---|---|---|---|
| ||||||||||
Municipalities and communities of Franklin County, Washington, United States | ||
|---|---|---|
| Cities | Map of Washington highlighting Franklin County | |
| CDPs | ||
| Unincorporated communities | ||
| Ghost towns | ||

| Authority control |
|
|---|