San Juan County, New Mexico
San Juan County is a county in the U.S. state of New Mexico. As of the 2010 census, the population was 130,044,[1] making it the fifth-most populous county in New Mexico. Its county seat is Aztec.[2] The county was created in 1887.[3]
San Juan County | |
|---|---|
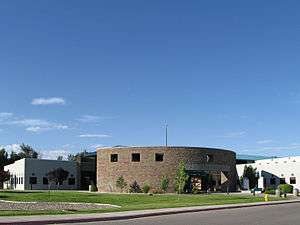 San Juan County Administration Building in Aztec | |
 Seal | |
 Location within the U.S. state of New Mexico | |
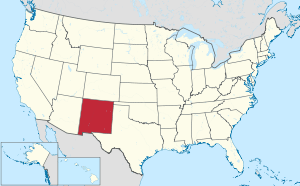 New Mexico's location within the U.S. | |
| Coordinates: 36°31′N 108°19′W | |
| Country | |
| State | |
| Founded | February 24, 1887 |
| Named for | San Juan River |
| Seat | Aztec |
| Largest city | Farmington |
| Area | |
| • Total | 5,538 sq mi (14,340 km2) |
| • Land | 5,513 sq mi (14,280 km2) |
| • Water | 25 sq mi (60 km2) 0.5%% |
| Population | |
| • Estimate (2019) | 123,958 |
| • Density | 24/sq mi (9/km2) |
| Time zone | UTC−7 (Mountain) |
| • Summer (DST) | UTC−6 (MDT) |
| Congressional district | 3rd |
| Website | www |
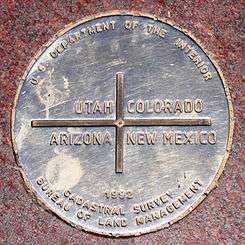
San Juan County is part of the Farmington, NM Metropolitan Statistical Area. It is in the state's northwest corner and includes the New Mexico portion of the Four Corners.
Geography
According to the U.S. Census Bureau, the county has a total area of 5,538 square miles (14,340 km2), of which 5,513 square miles (14,280 km2) is land and 25 square miles (65 km2) (0.5%) is water.[4] Indian reservations (and off-reservation trust lands) comprise 63.4 percent of the county's land area: The Navajo Nation takes up 60.45% and the Ute Mountain Ute Tribe Reservation another 2.93%.
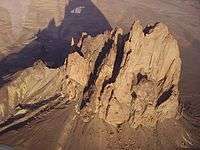
The physical features include three rivers: the San Juan, Animas, and La Plata rivers; also, the Chuska Mountains and Shiprock Pinnacle to the west, volcanic structures, buttes, mesas, badlands, and fertile river valleys.
Adjacent counties
- Rio Arriba County - east
- Sandoval County - southeast
- McKinley County - south
- Apache County, Arizona - west
- San Juan County, Utah - northwest
- Montezuma County, Colorado - north
- La Plata County, Colorado - north
- Archuleta County, Colorado - northeast
National protected areas
Major highways


Demographics
| Historical population | |||
|---|---|---|---|
| Census | Pop. | %± | |
| 1910 | 8,504 | — | |
| 1920 | 8,333 | −2.0% | |
| 1930 | 14,701 | 76.4% | |
| 1940 | 17,115 | 16.4% | |
| 1950 | 18,292 | 6.9% | |
| 1960 | 53,306 | 191.4% | |
| 1970 | 52,517 | −1.5% | |
| 1980 | 81,433 | 55.1% | |
| 1990 | 91,605 | 12.5% | |
| 2000 | 113,801 | 24.2% | |
| 2010 | 130,044 | 14.3% | |
| Est. 2019 | 123,958 | [5] | −4.7% |
| U.S. Decennial Census[6] 1790-1960[7] 1900-1990[8] 1990-2000[9] 2010-2016[1] | |||
2000 census
At the 2000 census there were 113,801 people, 37,711 households, and 28,924 families living in the county. The population density was 21 people per square mile (8/km²). There were 43,221 housing units at an average density of 8 per square mile (3/km²). The racial makeup of the county was 52.83% White, 0.44% Black or African American, 36.88% Native American, 0.27% Asian, 0.05% Pacific Islander, 6.77% from other races, and 2.78% from two or more races. 14.99% of the population were Hispanic or Latino of any race.[10] There were 37,712 households, 42.00% had children under the age of 18 living with them, 55.70% were married couples living together, 14.70% had a female head of household with no husband present, and 23.30% were non-families. 19.30% of households were one person and 6.40% were one person aged 65 or older. The average household size was 2.99 and the average family size was 3.43.
The age distribution was 32.60% under the age of 18, 10.00% from 18 to 24, 28.10% from 25 to 44, 20.20% from 45 to 64, and 9.10% 65 or older. The median age was 31 years. For every 100 females there were 98.30 males. For every 100 females age 18 and over, there were 94.70 males.
The median household income was $33,762 and the median family income was $37,382. Males had a median income of $35,066 versus $21,299 for females. The per capita income for the county was $14,282. About 18.00% of families and 21.50% of the population were below the poverty line, including 26.60% of those under age 18 and 18.20% of those age 65 or over.
2010 census
As of the 2010 census, there were 130,044 people, 44,404 households, and 32,457 families living in the county.[11] The population density was 23.6 inhabitants per square mile (9.1/km2). There were 49,341 housing units at an average density of 8.9 per square mile (3.4/km2).[12] The racial makeup of the county was 51.6% white, 36.6% American Indian, 0.6% black or African American, 0.4% Asian, 0.1% Pacific islander, 7.3% from other races, and 3.5% from two or more races. Those of Hispanic or Latino origin made up 19.1% of the population.[11] The largest ancestry groups were:[13]
- 34.8% Navajo
- 15.0% English
- 10.7% Mexican
- 9.1% German
- 5.9% Irish
- 4.4% Spanish
- 2.8% American
- 1.8% French
- 1.4% Italian
- 1.2% Scottish
- 1.1% Scotch-Irish
- 1.1% Swedish
Of the 44,404 households, 40.5% had children under the age of 18 living with them, 49.7% were married couples living together, 15.6% had a female householder with no husband present, 26.9% were non-families, and 21.9% of households were made up of individuals. The average household size was 2.89 and the average family size was 3.38. The median age was 33.0 years.[11]
The median household income was $46,189 and the median family income was $53,540. Males had a median income of $44,984 versus $30,245 for females. The per capita income for the county was $20,725. About 15.9% of families and 20.8% of the population were below the poverty line, including 28.0% of those under age 18 and 19.1% of those age 65 or over.[14]
Communities
Cities
Census-designated places
- Beclabito
- Blanco
- Cedar Hill
- Crystal‡
- Flora Vista
- Huerfano (former)
- Kirtland
- La Plata
- Lake Valley
- Lee Acres
- Nageezi
- Napi Headquarters
- Naschitti
- Navajo Dam
- Nenahnezad
- Newcomb
- North Light Plant
- Ojo Amarillo
- Sanostee
- Sheep Springs
- Shiprock
- Spencerville
- Upper Fruitland
- Waterflow
- West Hammond
- White Rock
- Young Place
Politics
| Year | Republican | Democratic | Third parties |
|---|---|---|---|
| 2016 | 60.6% 27,946 | 27.9% 12,865 | 11.5% 5,299 |
| 2012 | 62.4% 28,849 | 34.3% 15,855 | 3.3% 1,533 |
| 2008 | 59.9% 27,869 | 38.8% 18,028 | 1.3% 614 |
| 2004 | 65.6% 29,525 | 33.0% 14,843 | 1.4% 638 |
| 2000 | 61.9% 21,434 | 34.6% 11,980 | 3.6% 1,243 |
| 1996 | 53.7% 17,478 | 37.1% 12,070 | 9.2% 3,005 |
| 1992 | 44.3% 13,415 | 37.3% 11,302 | 18.4% 5,564 |
| 1988 | 58.4% 16,202 | 40.0% 11,094 | 1.6% 454 |
| 1984 | 67.0% 18,690 | 32.1% 8,963 | 0.9% 257 |
| 1980 | 66.3% 15,579 | 28.5% 6,705 | 5.2% 1,215 |
| 1976 | 55.1% 10,852 | 43.8% 8,615 | 1.1% 216 |
| 1972 | 67.6% 10,788 | 26.9% 4,296 | 5.6% 886 |
| 1968 | 54.0% 7,664 | 28.5% 4,036 | 17.5% 2,485 |
| 1964 | 49.0% 6,808 | 49.7% 6,901 | 1.3% 183 |
| 1960 | 57.0% 7,521 | 40.7% 5,370 | 2.2% 294 |
| 1956 | 67.5% 5,194 | 31.5% 2,425 | 0.9% 71 |
| 1952 | 69.7% 3,864 | 29.9% 1,659 | 0.3% 18 |
| 1948 | 60.7% 2,407 | 38.9% 1,544 | 0.4% 14 |
| 1944 | 56.6% 1,438 | 43.0% 1,093 | 0.4% 9 |
| 1940 | 54.8% 1,757 | 45.1% 1,445 | 0.2% 5 |
| 1936 | 45.7% 1,345 | 52.0% 1,530 | 2.3% 69 |
| 1932 | 35.1% 925 | 57.2% 1,506 | 7.7% 204 |
| 1928 | 66.4% 1,436 | 33.5% 724 | 0.2% 4 |
| 1924 | 44.9% 889 | 41.3% 819 | 13.8% 273 |
| 1920 | 53.4% 985 | 45.1% 831 | 1.5% 28 |
| 1916 | 36.1% 385 | 59.6% 637 | 4.3% 46 |
| 1912 | 19.0% 203 | 46.3% 493 | 34.7% 370 |
See also
References
- "State & County QuickFacts". United States Census Bureau. Retrieved September 30, 2013.
- "Find a County". National Association of Counties. Retrieved June 7, 2011.
- "New Mexico: Consolidated Chronology of State and County Boundaries". New Mexico Atlas of Historical County Boundaries. The Newberry Library. 2007. Retrieved January 2, 2015.
- "2010 Census Gazetteer Files". United States Census Bureau. August 22, 2012. Archived from the original on January 1, 2015. Retrieved January 2, 2015.
- "Population and Housing Unit Estimates". Retrieved December 23, 2019.
- "U.S. Decennial Census". United States Census Bureau. Retrieved January 2, 2015.
- "Historical Census Browser". University of Virginia Library. Retrieved January 2, 2015.
- "Population of Counties by Decennial Census: 1900 to 1990". United States Census Bureau. Retrieved January 2, 2015.
- "Census 2000 PHC-T-4. Ranking Tables for Counties: 1990 and 2000" (PDF). United States Census Bureau. Retrieved January 2, 2015.
- "U.S. Census website". United States Census Bureau. Retrieved January 31, 2008.
- "DP-1 Profile of General Population and Housing Characteristics: 2010 Demographic Profile Data". United States Census Bureau. Archived from the original on February 13, 2020. Retrieved January 24, 2016.
- "Population, Housing Units, Area, and Density: 2010 - County". United States Census Bureau. Archived from the original on February 13, 2020. Retrieved January 24, 2016.
- "DP02 SELECTED SOCIAL CHARACTERISTICS IN THE UNITED STATES – 2006-2010 American Community Survey 5-Year Estimates". United States Census Bureau. Archived from the original on February 13, 2020. Retrieved January 24, 2016.
- "DP03 SELECTED ECONOMIC CHARACTERISTICS – 2006-2010 American Community Survey 5-Year Estimates". United States Census Bureau. Archived from the original on February 13, 2020. Retrieved January 24, 2016.
- Leip, David. "Dave Leip's Atlas of U.S. Presidential Elections". uselectionatlas.org. Retrieved April 2, 2018.
Places adjacent to San Juan County, New Mexico | |
|---|---|
Municipalities and communities of San Juan County, New Mexico, United States | ||
|---|---|---|
| Cities | Map of New Mexico highlighting San Juan County | |
| CDPs |
| |
| Unincorporated communities | ||
| Indian reservations | ||
| Footnotes | ‡This populated place also has portions in an adjacent county or counties | |
Santa Fe (capital) | ||
| Topics |
| |
| Society | ||
| Regions |
| |
| Cities | ||
| Counties | ||

| Authority control |
|
|---|