Lea County, New Mexico
Lea County is a county located in the U.S. state of New Mexico. As of the 2010 census, the population was 64,727.[1] Because of oil lease sales in September 2018, the population is expected to double.[2]
Lea County | |
|---|---|
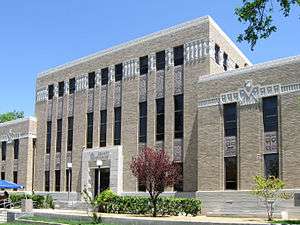 Lea County Courthouse in Lovington | |
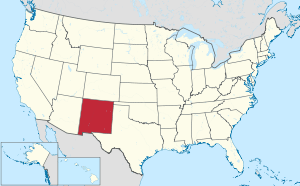
 Location within the U.S. state of New Mexico | |
 New Mexico's location within the U.S. | |
| Coordinates: 32°48′N 103°25′W | |
| Country | |
| State | |
| Founded | March 17, 1917 |
| Seat | Lovington |
| Largest city | Hobbs |
| Area | |
| • Total | 4,394 sq mi (11,380 km2) |
| • Land | 4,391 sq mi (11,370 km2) |
| • Water | 3.3 sq mi (9 km2) 0.07%% |
| Population | |
| • Estimate (2019) | 71,070 |
| • Density | 15/sq mi (6/km2) |
| Time zone | UTC−7 (Mountain) |
| • Summer (DST) | UTC−6 (MDT) |
| Congressional district | 2nd |
| Website | www |
Its county seat is Lovington, New Mexico.[3] It is both west and north of the Texas state line. Lea County comprises the Hobbs, NM Micropolitan Statistical Area.
Geography
According to the U.S. Census Bureau, the county has a total area of 4,394 square miles (11,380 km2), of which 4,391 square miles (11,370 km2) is land and 3.3 square miles (8.5 km2) (0.07%) is water.[4] Lea County is located in the southeast corner of New Mexico and borders Texas to the south and east.
The Permian Basin, 250 miles wide and 350 miles long, underlies Lea County and adjacent Eddy County as well as a big piece of West Texas. It produces 500,00 barrels of crude a day, and this number was expected to double in 2019. The shale in this basin lies 3,000 to 15,000 feet below the surface, below a salt bed and a groundwater aquifer.[2]
Adjacent counties
- Roosevelt County – north
- Chaves County – west
- Eddy County – west
- Loving County, Texas – south
- Winkler County, Texas – southeast
- Andrews County, Texas – east
- Gaines County, Texas – east
- Yoakum County, Texas – east
- Cochran County, Texas – northeast
Demographics
| Historical population | |||
|---|---|---|---|
| Census | Pop. | %± | |
| 1920 | 3,545 | — | |
| 1930 | 6,144 | 73.3% | |
| 1940 | 21,154 | 244.3% | |
| 1950 | 30,717 | 45.2% | |
| 1960 | 53,429 | 73.9% | |
| 1970 | 49,554 | −7.3% | |
| 1980 | 55,993 | 13.0% | |
| 1990 | 55,765 | −0.4% | |
| 2000 | 55,511 | −0.5% | |
| 2010 | 64,727 | 16.6% | |
| Est. 2019 | 71,070 | [5] | 9.8% |
| U.S. Decennial Census[6] 1790-1960[7] 1900-1990[8] 1990-2000[9] 2010-2016[1] | |||
2000 census
As of the 2000 census,[10] there were 55,511 people, 19,699 households, and 14,715 families living in the county. The population density was 13 people per square mile (5/km²). There were 23,405 housing units at an average density of 5 per square mile (2/km²). The racial makeup of the county was 67.13% White, 4.37% Black or African American, 0.99% Native American, 0.39% Asian, 0.04% Pacific Islander, 23.81% from other races, and 3.27% from two or more races. 39.65% of the population were Hispanic or Latino of any race.
There were 19,699 households out of which 39.30% had children under the age of 18 living with them, 57.80% were married couples living together, 12.20% had a female householder with no husband present, and 25.30% were non-families. 22.50% of all households were made up of individuals and 9.90% had someone living alone who was 65 years of age or older. The average household size was 2.73 and the average family size was 3.20.
In the county, the population was spread out with 30.10% under the age of 18, 10.10% from 18 to 24, 27.30% from 25 to 44, 20.30% from 45 to 64, and 12.20% who were 65 years of age or older. The median age was 33 years. For every 100 females there were 100.30 males. For every 100 females age 18 and over, there were 99.00 males.
The median income for a household in the county was $29,799, and the median income for a family was $34,665. Males had a median income of $32,005 versus $20,922 for females. The per capita income for the county was $14,184. About 17.30% of families and 21.10% of the population were below the poverty line, including 28.00% of those under age 18 and 14.90% of those age 65 or over.
2010 census
As of the 2010 census, there were 64,727 people, 22,236 households, and 16,260 families living in the county.[11] The population density was 14.7 inhabitants per square mile (5.7/km2). There were 24,919 housing units at an average density of 5.7 per square mile (2.2/km2).[12] The racial makeup of the county was 75.0% white, 4.1% black or African American, 1.2% American Indian, 0.5% Asian, 0.1% Pacific islander, 16.6% from other races, and 2.6% from two or more races. Those of Hispanic or Latino origin made up 51.1% of the population.[11] In terms of ancestry, 9.3% were German, 7.6% were Irish, 7.2% were English, and 6.3% were American.[13]
Of the 22,236 households, 41.9% had children under the age of 18 living with them, 52.8% were married couples living together, 13.4% had a female householder with no husband present, 26.9% were non-families, and 22.6% of all households were made up of individuals. The average household size was 2.82 and the average family size was 3.30. The median age was 31.9 years.[11]
The median income for a household in the county was $43,910 and the median income for a family was $48,980. Males had a median income of $44,714 versus $25,847 for females. The per capita income for the county was $19,637. About 15.2% of families and 17.7% of the population were below the poverty line, including 23.5% of those under age 18 and 11.1% of those age 65 or over.[14]
Transportation
Airports
The following public-use airports are located in the county:[15]
- Lea County Regional Airport (HOB) – Hobbs
- Lea County-Jal Airport (E26) – Jal
- Lea County-Zip Franklin Memorial Airport (E06) – Lovington
- Tatum Airport (18T) – Tatum
Politics
In the 2004 Presidential election, Lea County was the top New Mexico county, as far as percentage, for Republican George W. Bush. He beat John Kerry 79%-20%. In 2008, the Republican candidate John McCain beat Democratic candidate Barack Obama by a wide but slightly smaller margin, 72% to 27%.[16]
| Year | Republican | Democratic | Third parties |
|---|---|---|---|
| 2016 | 70.6% 12,495 | 22.2% 3,930 | 7.3% 1,287 |
| 2012 | 73.8% 12,548 | 24.0% 4,080 | 2.3% 387 |
| 2008 | 71.6% 13,347 | 27.4% 5,108 | 1.0% 190 |
| 2004 | 79.4% 14,430 | 20.1% 3,646 | 0.6% 105 |
| 2000 | 71.3% 10,157 | 27.0% 3,855 | 1.7% 244 |
| 1996 | 52.2% 7,661 | 36.8% 5,393 | 11.0% 1,612 |
| 1992 | 48.6% 7,921 | 30.9% 5,047 | 20.5% 3,343 |
| 1988 | 65.4% 11,309 | 34.0% 5,879 | 0.7% 115 |
| 1984 | 75.3% 14,569 | 23.6% 4,558 | 1.2% 230 |
| 1980 | 66.3% 10,727 | 30.9% 5,006 | 2.8% 452 |
| 1976 | 56.8% 8,773 | 42.3% 6,533 | 0.9% 135 |
| 1972 | 76.4% 12,478 | 21.0% 3,429 | 2.6% 424 |
| 1968 | 48.2% 7,415 | 30.9% 4,751 | 20.9% 3,216 |
| 1964 | 44.1% 7,033 | 55.6% 8,862 | 0.3% 53 |
| 1960 | 48.8% 7,548 | 50.5% 7,806 | 0.8% 120 |
| 1956 | 47.7% 5,661 | 51.7% 6,140 | 0.7% 78 |
| 1952 | 47.5% 4,738 | 52.2% 5,204 | 0.3% 29 |
| 1948 | 21.1% 1,273 | 78.1% 4,708 | 0.7% 44 |
| 1944 | 29.4% 1,227 | 70.5% 2,938 | 0.1% 3 |
| 1940 | 23.0% 1,286 | 76.8% 4,295 | 0.2% 11 |
| 1936 | 12.2% 549 | 87.0% 3,905 | 0.8% 37 |
| 1932 | 9.8% 271 | 86.0% 2,371 | 4.1% 114 |
| 1928 | 53.0% 537 | 46.8% 474 | 0.3% 3 |
| 1924 | 18.8% 138 | 75.0% 552 | 6.3% 46 |
| 1920 | 25.2% 255 | 72.5% 733 | 2.3% 23 |
Communities
Town
Census-designated places
Other unincorporated communities
Notable people
- Roy Cooper. Rodeo cowboy
- Kathy Whitworth, professional golfer
- Brian Urlacher, Chicago Bears football linebacker (2000–2012)
References
- "State & County QuickFacts". United States Census Bureau. Archived from the original on June 6, 2011. Retrieved September 29, 2013.
- John L. Smith (December 29, 2018). "Oil: Black gold or prime polluter?: Oil leases bring jobs, strains, to southeast New Mexico". Gallup Independent. Searchlight New Mexico. p. 1.
- "Find a County". National Association of Counties. Retrieved June 7, 2011.
- "2010 Census Gazetteer Files". United States Census Bureau. August 22, 2012. Archived from the original on January 1, 2015. Retrieved January 2, 2015.
- "Population and Housing Unit Estimates". Retrieved December 23, 2019.
- "U.S. Decennial Census". United States Census Bureau. Retrieved January 2, 2015.
- "Historical Census Browser". University of Virginia Library. Retrieved January 2, 2015.
- "Population of Counties by Decennial Census: 1900 to 1990". United States Census Bureau. Retrieved January 2, 2015.
- "Census 2000 PHC-T-4. Ranking Tables for Counties: 1990 and 2000" (PDF). United States Census Bureau. Retrieved January 2, 2015.
- "U.S. Census website". United States Census Bureau. Retrieved January 31, 2008.
- "DP-1 Profile of General Population and Housing Characteristics: 2010 Demographic Profile Data". United States Census Bureau. Archived from the original on February 13, 2020. Retrieved January 24, 2016.
- "Population, Housing Units, Area, and Density: 2010 – County". United States Census Bureau. Archived from the original on February 13, 2020. Retrieved January 24, 2016.
- "DP02 SELECTED SOCIAL CHARACTERISTICS IN THE UNITED STATES – 2006-2010 American Community Survey 5-Year Estimates". United States Census Bureau. Archived from the original on February 13, 2020. Retrieved January 24, 2016.
- "DP03 SELECTED ECONOMIC CHARACTERISTICS – 2006-2010 American Community Survey 5-Year Estimates". United States Census Bureau. Archived from the original on February 13, 2020. Retrieved January 24, 2016.
- Public and Private Airports, Lea County, New Mexico
- "County Results – Election Center 2008 – Elections & Politics from CNN.com". www.cnn.com. Retrieved April 1, 2018.
- Leip, David. "Dave Leip's Atlas of U.S. Presidential Elections". uselectionatlas.org. Retrieved April 1, 2018.
Places adjacent to Lea County, New Mexico | ||||||||||
|---|---|---|---|---|---|---|---|---|---|---|
| ||||||||||
Municipalities and communities of Lea County, New Mexico, United States | ||
|---|---|---|
| Cities | Map of New Mexico highlighting Lea County | |
| Town | ||
| CDPs | ||
| Other unincorporated communities | ||
Santa Fe (capital) | ||
| Topics |
| |
| Society | ||
| Regions |
| |
| Cities | ||
| Counties | ||

| Authority control |
|
|---|