San Bernardino County, California
San Bernardino County, officially the County of San Bernardino, is a county located in the southern portion of the U.S. state of California, and is located within the Inland Empire area. As of the 2010 U.S. Census, the population was 2,035,210,[3] making it the fifth-most populous county in California and the 14th-most populous in the United States. The county seat is San Bernardino.[5]
San Bernardino County | |
|---|---|
| County of San Bernardino | |
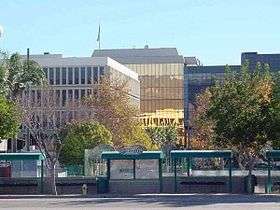 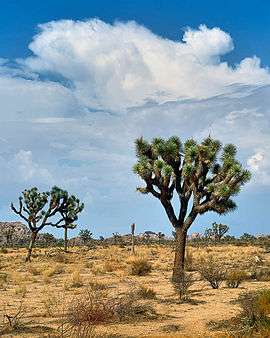 .jpg) 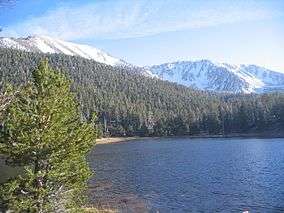 From top to bottom: County Seat, Joshua Tree National Park, Calico ghost town and San Bernardino Mountains | |
 Flag  Coat of arms | |
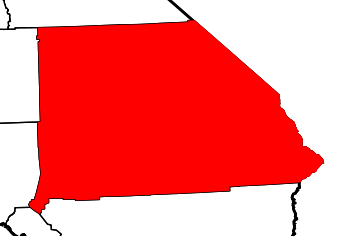
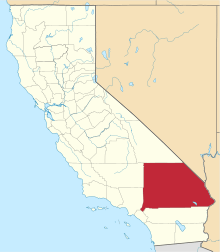 Location in the U.S. state of California | |
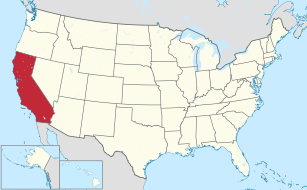 California's location in the contiguous United States | |
| Country | |
| State | |
| Established | April 26, 1853[1] |
| Named for | San Bernardino, named for San Bernardino de Sena Estancia, named in turn for Saint Bernardino of Siena |
| County seat | San Bernardino |
| Largest city | San Bernardino |
| Area | |
| • Total | 20,105 sq mi (52,070 km2) |
| • Land | 20,057 sq mi (51,950 km2) |
| • Water | 48 sq mi (120 km2) |
| Highest elevation | 11,503 ft (3,506 m) |
| Population | |
| • Total | 2,035,210 |
| • Estimate (2019)[4] | 2,180,085 |
| • Density | 100/sq mi (39/km2) |
| Time zone | UTC−8 (Pacific Time Zone) |
| • Summer (DST) | UTC−7 (Pacific Daylight Time) |
| Area codes | 442/760, 909, 951 |
| FIPS code | 06-071 |
| Website | www |
While included within the Greater Los Angeles area, San Bernardino County is included in the Riverside–San Bernardino–Ontario metropolitan statistical area, as well as the Los Angeles–Long Beach combined statistical area.
With an area of 20,105 square miles (52,070 km2), San Bernardino County is the largest county in the contiguous United States by area, although some of Alaska's boroughs and census areas are larger. The county is close to the size of West Virginia.
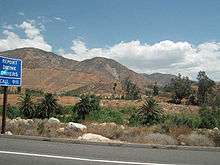
This vast county stretches from where the bulk of the county population resides in three Census County Divisions (Fontana, San Bernardino, & Victorville-Hesperia), counting 1,793,186 people as of the 2010 Census, covering the 1,730 square miles (4,480 km2), across the thinly populated deserts and mountains. It spans an area from south of the San Bernardino Mountains in San Bernardino Valley, to the Nevada border and the Colorado River.
History
Spanish Missionaries from Mission San Gabriel Arcángel established a church at the village of Politania in 1810. Father Francisco Dumetz named the church San Bernardino on May 20, 1810, after the feast day of St. Bernardino of Siena. The Franciscans also gave the name San Bernardino to the snowcapped peak in Southern California, in honor of the saint and it is from him that the county derives its name.[6] In 1819, they established the San Bernardino de Sena Estancia, a mission farm in what is now Redlands.
Following Mexican independence from Spain in 1821, Mexican citizens were granted land grants to establish ranchos in the area of the county. Rancho Jurupa in 1838, Rancho Cucamonga and El Rincon in 1839, Rancho Santa Ana del Chino in 1841, Rancho San Bernardino in 1842 and Rancho Muscupiabe in 1844.
Agua Mansa was the first town in what became San Bernardino County, settled by immigrants from New Mexico on land donated from the Rancho Jurupa in 1841.
Following the purchase of Rancho San Bernardino, and the establishment of the town of San Bernardino in 1851 by Mormon colonists, San Bernardino County was formed in 1853 from parts of Los Angeles County. Some of the southern parts of the county's territory were given to Riverside County in 1893.
Geography
According to the U.S. Census Bureau, the county has a total area of 20,105 square miles (52,070 km2), of which 20,057 square miles (51,950 km2) is land and 48 square miles (120 km2) (0.2%) is water.[7] It is the largest county by area in California and the largest in the United States (excluding boroughs in Alaska).[8] It is slightly larger than the states of New Jersey, Connecticut, Delaware and Rhode Island combined, and is also slightly larger than Switzerland in square miles. It borders both Nevada and Arizona.
The bulk of the population, nearly two million, live in the roughly 480 square miles south of the San Bernardino Mountains adjacent to Riverside and in the San Bernardino Valley in the southwestern portion of the county. About 390,000 others live just north of the San Bernardino Mountains, agglomerating around Victorville covering roughly 280 square miles in the Victor Valley. Roughly another 100,000 people live scattered across the rest of the sprawling county.
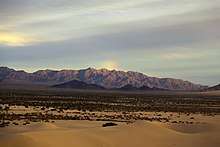
The Mojave National Preserve covers some of the eastern desert, especially between Interstate 15 and Interstate 40. The desert portion also includes the cities of Needles next to the Colorado River and Barstow at the junction in Interstate 15 and Interstate 40. Trona is at the northwestern part of the county, west of Death Valley. This national park, mostly within Inyo County, also has a small portion of land within San Bernardino County. The largest metropolitan area in the Mojave Desert part of the county is the Victor Valley, with the incorporated localities of Adelanto, Apple Valley, Hesperia, and Victorville. Further south, a portion of Joshua Tree National Park overlaps the county near the High Desert area, in the vicinity of Twentynine Palms. The remaining towns make up the remainder of the High Desert: Pioneertown, Yucca Valley, Joshua Tree, Landers, and Morongo Valley.
The mountains are home to the San Bernardino National Forest, and include the communities of Crestline, Lake Arrowhead, Running Springs, Big Bear City, Forest Falls, and Big Bear Lake.
The San Bernardino Valley is at the eastern end of the San Gabriel Valley. The San Bernardino Valley includes the cities of Ontario, Chino, Chino Hills, Upland, Fontana, Rialto, Colton, Grand Terrace, Montclair, Rancho Cucamonga, San Bernardino, Loma Linda, Highland, Redlands, and Yucaipa.
Adjacent counties
National protected areas
- Angeles National Forest (part)
- Death Valley National Park (part)
- Havasu National Wildlife Refuge (part)
- Joshua Tree National Park (part)
- Mojave National Preserve
- San Bernardino National Forest (part)
More than 80% of the county is owned by the federal government.[9] There are at least 35 official wilderness areas in the county that are part of the National Wilderness Preservation System. This is the largest number of any county in the United States (although not the largest in total area). The majority are managed by the Bureau of Land Management, but some are integral components of the above listed national protected areas. Most of these wilderness areas lie entirely within the county, but a few are shared with neighboring counties (and two of these are shared with the neighboring states of Arizona and Nevada).
Except as noted, these wilderness areas are managed solely by the Bureau of Land Management and lie within San Bernardino County:
- Bigelow Cholla Garden Wilderness
- Bighorn Mountain Wilderness (part)
- Black Mountain Wilderness
- Bristol Mountains Wilderness
- Cadiz Dunes Wilderness
- Chemehuevi Mountains Wilderness
- Cleghorn Lakes Wilderness
- Clipper Mountain Wilderness
- Cucamonga Wilderness
- Dead Mountains Wilderness
- Death Valley Wilderness (part)
- Golden Valley Wilderness
- Grass Valley Wilderness
- Havasu Wilderness (part)
- Hollow Hills Wilderness
- Joshua Tree Wilderness (part)
- Kelso Dunes Wilderness
- Kingston Range Wilderness
- Mesquite Wilderness
- Mojave Wilderness
- Newberry Mountains Wilderness
- North Mesquite Mountains Wilderness
- Old Woman Mountains Wilderness
- Pahrump Valley Wilderness (part)
- Piute Mountains Wilderness
- Rodman Mountains Wilderness
- Saddle Peak Hills Wilderness (part)
- San Gorgonio Wilderness (part)
- Sheep Mountain Wilderness (part)
- Sheephole Valley Wilderness
- Stateline Wilderness
- Stepladder Mountains Wilderness
- Trilobite Wilderness
- Turtle Mountains Wilderness
- Whipple Mountains Wilderness
Demographics
2011
| Population, race, and income | |||||
|---|---|---|---|---|---|
| Total population[10] | 2,023,452 | ||||
| White[10] | 1,240,228 | 61.3% | |||
| Black or African American[10] | 176,209 | 8.7% | |||
| American Indian or Alaska Native[10] | 20,762 | 1.0% | |||
| Asian[10] | 126,991 | 6.3% | |||
| Native Hawaiian or other Pacific Islander[10] | 5,984 | 0.3% | |||
| Some other race[10] | 364,236 | 18.0% | |||
| Two or more races[10] | 89,042 | 4.4% | |||
| Hispanic or Latino (of any race)[11] | 984,022 | 48.6% | |||
| Per capita income[12] | $21,932 | ||||
| Median household income[13] | $55,853 | ||||
| Median family income[14] | $61,525 | ||||
Places by population, race, and income
| Places by population and race | ||||||||
|---|---|---|---|---|---|---|---|---|
| Place | Type[15] | Population[10] | White[10] | Other[10] [note 1] |
Asian[10] | Black or African American[10] |
Native American[10] [note 2] |
Hispanic or Latino (of any race)[11] |
| Adelanto | City | 30,670 | 55.5% | 19.4% | 2.4% | 21.1% | 1.5% | 51.8% |
| Apple Valley | Town | 68,316 | 76.6% | 10.1% | 2.0% | 10.4% | 0.9% | 28.7% |
| Baker | CDP | 713 | 37.0% | 52.5% | 0.0% | 8.7% | 1.8% | 69.6% |
| Barstow | City | 22,913 | 58.8% | 18.0% | 1.7% | 16.4% | 5.0% | 39.6% |
| Big Bear City | CDP | 11,504 | 82.3% | 13.7% | 1.1% | 1.3% | 1.6% | 23.7% |
| Big Bear Lake | City | 5,109 | 74.9% | 20.9% | 0.0% | 1.8% | 2.3% | 24.0% |
| Big River | CDP | 1,213 | 88.0% | 8.9% | 0.0% | 0.0% | 3.1% | 12.1% |
| Bloomington | CDP | 25,234 | 60.9% | 33.2% | 0.8% | 3.5% | 1.6% | 83.5% |
| Bluewater | CDP | 114 | 100.0% | 0.0% | 0.0% | 0.0% | 0.0% | 10.5% |
| Chino | City | 78,050 | 60.8% | 22.2% | 9.8% | 6.4% | 0.9% | 54.3% |
| Chino Hills | City | 74,765 | 55.6% | 11.8% | 28.3% | 3.8% | 0.5% | 30.2% |
| Colton | City | 52,283 | 50.2% | 32.5% | 5.2% | 10.4% | 1.6% | 68.0% |
| Crestline | CDP | 8,743 | 87.5% | 9.7% | 0.8% | 1.2% | 0.8% | 14.2% |
| Fontana | City | 192,779 | 58.2% | 24.8% | 6.4% | 9.7% | 0.9% | 65.9% |
| Fort Irwin | CDP | 9,781 | 69.4% | 10.1% | 7.1% | 10.2% | 3.2% | 25.5% |
| Grand Terrace | City | 12,132 | 65.4% | 20.8% | 7.6% | 5.6% | 0.6% | 37.9% |
| Hesperia | City | 88,247 | 74.9% | 15.0% | 2.1% | 6.3% | 1.7% | 47.9% |
| Highland | City | 52,777 | 52.4% | 29.5% | 7.1% | 10.1% | 0.9% | 47.9% |
| Homestead Valley | CDP | 3,072 | 94.7% | 3.6% | 1.3% | 0.0% | 0.4% | 3.8% |
| Joshua Tree | CDP | 7,194 | 82.4% | 10.6% | 2.7% | 3.0% | 1.3% | 16.4% |
| Lake Arrowhead | CDP | 9,434 | 81.0% | 16.4% | 0.6% | 1.4% | 0.6% | 23.7% |
| Lenwood | CDP | 3,784 | 63.3% | 25.1% | 0.4% | 9.4% | 1.8% | 44.7% |
| Loma Linda | City | 23,081 | 48.4% | 15.0% | 28.7% | 6.8% | 1.1% | 22.8% |
| Lucerne Valley | CDP | 6,029 | 76.4% | 6.6% | 1.7% | 12.1% | 3.1% | 21.3% |
| Lytle Creek | CDP | 735 | 86.8% | 2.3% | 8.2% | 0.0% | 2.7% | 27.3% |
| Mentone | CDP | 8,670 | 75.5% | 12.0% | 4.2% | 7.7% | 0.7% | 29.7% |
| Montclair | City | 36,802 | 43.1% | 39.8% | 10.2% | 4.6% | 2.3% | 67.1% |
| Morongo Valley | CDP | 3,550 | 81.7% | 15.3% | 0.1% | 0.0% | 2.9% | 25.4% |
| Mountain View Acres | CDP | 3,376 | 68.5% | 18.2% | 1.9% | 11.1% | 0.4% | 58.4% |
| Muscoy | CDP | 11,573 | 52.2% | 41.8% | 3.2% | 1.7% | 1.0% | 82.8% |
| Needles | City | 4,910 | 74.5% | 9.3% | 1.6% | 3.0% | 11.5% | 16.0% |
| Oak Glen | CDP | 502 | 95.6% | 1.4% | 0.0% | 3.0% | 0.0% | 20.9% |
| Oak Hills | CDP | 8,780 | 84.2% | 9.6% | 3.5% | 0.7% | 2.1% | 34.5% |
| Ontario | City | 165,120 | 52.6% | 33.9% | 4.6% | 7.6% | 1.4% | 66.5% |
| Phelan | CDP | 12,851 | 78.5% | 14.8% | 4.0% | 1.2% | 1.4% | 29.5% |
| Piñon Hills | CDP | 6,130 | 93.4% | 5.1% | 0.4% | 1.0% | 0.0% | 18.0% |
| Rancho Cucamonga | City | 163,151 | 63.2% | 16.4% | 10.5% | 8.4% | 1.5% | 34.8% |
| Redlands | City | 68,995 | 69.6% | 15.9% | 7.9% | 5.3% | 1.3% | 29.5% |
| Rialto | City | 99,501 | 59.2% | 22.5% | 2.4% | 14.9% | 0.9% | 67.2% |
| Running Springs | CDP | 5,027 | 84.4% | 11.2% | 0.9% | 0.4% | 3.1% | 17.6% |
| San Antonio Heights | CDP | 3,914 | 74.0% | 18.0% | 7.1% | 0.1% | 0.8% | 21.5% |
| San Bernardino | City | 210,100 | 44.8% | 34.9% | 4.4% | 14.9% | 1.1% | 58.8% |
| Searles Valley | CDP | 1,812 | 91.9% | 5.0% | 0.0% | 2.2% | 0.8% | 9.9% |
| Silver Lakes | CDP | 4,508 | 88.1% | 4.3% | 3.7% | 3.2% | 0.7% | 14.2% |
| Spring Valley Lake | CDP | 8,080 | 91.3% | 5.4% | 1.9% | 1.0% | 0.3% | 21.1% |
| Twentynine Palms | City | 25,786 | 74.8% | 10.1% | 3.6% | 7.4% | 4.1% | 19.8% |
| Upland | City | 74,021 | 61.0% | 22.5% | 9.3% | 5.5% | 1.8% | 37.8% |
| Victorville | City | 111,704 | 62.0% | 17.1% | 4.5% | 15.4% | 1.1% | 47.5% |
| Wrightwood | CDP | 4,556 | 96.6% | 2.5% | 0.9% | 0.0% | 0.0% | 10.1% |
| Yucaipa | City | 50,862 | 81.0% | 13.6% | 2.5% | 1.9% | 1.0% | 26.3% |
| Yucca Valley | Town | 20,508 | 82.7% | 11.0% | 2.6% | 2.4% | 1.4% | 14.1% |
| Places by population and income | |||||
|---|---|---|---|---|---|
| Place | Type[15] | Population[16] | Per capita income[12] | Median household income[13] | Median family income[14] |
| Adelanto | City | 30,670 | $11,771 | $42,208 | $45,187 |
| Apple Valley | Town | 68,316 | $23,229 | $50,664 | $57,811 |
| Baker | CDP | 713 | $11,235 | $33,000 | $43,047 |
| Barstow | City | 22,913 | $20,571 | $45,417 | $55,403 |
| Big Bear City | CDP | 11,504 | $21,008 | $41,509 | $54,881 |
| Big Bear Lake | City | 5,109 | $22,207 | $31,541 | $36,750 |
| Big River | CDP | 1,213 | $24,254 | $29,219 | $43,611 |
| Bloomington | CDP | 25,234 | $13,492 | $44,673 | $44,855 |
| Bluewater | CDP | 114 | $25,664 | $32,500 | $41,250 |
| Chino | City | 78,050 | $22,918 | $73,400 | $80,411 |
| Chino Hills | City | 74,765 | $35,157 | $101,905 | $108,140 |
| Colton | City | 52,283 | $16,385 | $41,788 | $46,195 |
| Crestline | CDP | 8,743 | $24,872 | $51,478 | $58,171 |
| Fontana | City | 192,779 | $19,297 | $64,058 | $65,652 |
| Fort Irwin | CDP | 9,781 | $18,214 | $52,798 | $53,774 |
| Grand Terrace | City | 12,132 | $29,591 | $64,337 | $82,898 |
| Hesperia | City | 88,247 | $17,589 | $48,624 | $52,894 |
| Highland | City | 52,777 | $22,494 | $59,419 | $66,445 |
| Homestead Valley | CDP | 3,072 | $19,107 | $26,356 | $38,838 |
| Joshua Tree | CDP | 7,194 | $25,501 | $43,510 | $49,221 |
| Lake Arrowhead | CDP | 9,434 | $35,810 | $63,117 | $68,462 |
| Lenwood | CDP | 3,784 | $16,799 | $43,000 | $53,938 |
| Loma Linda | City | 23,081 | $31,242 | $61,116 | $71,844 |
| Lucerne Valley | CDP | 6,029 | $16,034 | $25,323 | $34,167 |
| Lytle Creek | CDP | 735 | $21,703 | $65,982 | $74,050 |
| Mentone | CDP | 8,670 | $25,747 | $56,075 | $57,198 |
| Montclair | City | 36,802 | $17,173 | $50,959 | $51,434 |
| Morongo Valley | CDP | 3,550 | $23,084 | $37,734 | $57,321 |
| Mountain View Acres | CDP | 3,376 | $17,573 | $54,427 | $58,125 |
| Muscoy | CDP | 11,573 | $11,294 | $44,853 | $50,236 |
| Needles | City | 4,910 | $19,818 | $30,139 | $34,968 |
| Oak Glen | CDP | 502 | $23,376 | $63,902 | $68,462 |
| Oak Hills | CDP | 8,780 | $29,805 | $76,882 | $84,158 |
| Ontario | City | 165,120 | $19,123 | $55,902 | $57,731 |
| Phelan | CDP | 12,851 | $23,682 | $52,863 | $61,746 |
| Piñon Hills | CDP | 6,130 | $26,576 | $38,140 | $58,542 |
| Rancho Cucamonga | City | 163,151 | $32,738 | $78,782 | $88,362 |
| Redlands | City | 68,995 | $32,586 | $68,015 | $82,420 |
| Rialto | City | 99,501 | $15,967 | $50,452 | $54,271 |
| Running Springs | CDP | 5,027 | $28,608 | $60,833 | $76,121 |
| San Antonio Heights | CDP | 3,914 | $46,524 | $97,960 | $102,692 |
| San Bernardino | City | 210,100 | $15,762 | $40,161 | $42,771 |
| Searles Valley | CDP | 1,812 | $22,908 | $31,970 | $65,472 |
| Silver Lakes | CDP | 4,508 | $30,517 | $64,058 | $73,405 |
| Spring Valley Lake | CDP | 8,080 | $24,390 | $54,344 | $67,877 |
| Twentynine Palms | City | 25,786 | $21,546 | $43,412 | $45,225 |
| Upland | City | 74,021 | $29,614 | $67,449 | $75,304 |
| Victorville | City | 111,704 | $17,249 | $52,357 | $53,667 |
| Wrightwood | CDP | 4,556 | $36,747 | $80,793 | $89,583 |
| Yucaipa | City | 50,862 | $26,985 | $59,596 | $73,302 |
| Yucca Valley | Town | 20,508 | $21,990 | $45,502 | $52,942 |
2010
| Historical population | |||
|---|---|---|---|
| Census | Pop. | %± | |
| 1860 | 5,551 | — | |
| 1870 | 3,988 | −28.2% | |
| 1880 | 7,786 | 95.2% | |
| 1890 | 25,497 | 227.5% | |
| 1900 | 27,929 | 9.5% | |
| 1910 | 56,706 | 103.0% | |
| 1920 | 73,401 | 29.4% | |
| 1930 | 133,900 | 82.4% | |
| 1940 | 161,108 | 20.3% | |
| 1950 | 281,642 | 74.8% | |
| 1960 | 503,591 | 78.8% | |
| 1970 | 684,072 | 35.8% | |
| 1980 | 895,016 | 30.8% | |
| 1990 | 1,418,380 | 58.5% | |
| 2000 | 1,709,434 | 20.5% | |
| 2010 | 2,035,210 | 19.1% | |
| Est. 2019 | 2,180,085 | [4] | 7.1% |
| U.S. Decennial Census[17] 1790–1960[18] 1900–1990[19] 1990–2000[20] 2010–2018[3] | |||
The 2010 United States Census reported that San Bernardino County had a population of 2,035,210. The racial makeup of San Bernardino County was 1,153,161 (56.7%) White, 181,862 (8.9%) African American, 22,689 (1.1%) Native American, 128,603 (6.3%) Asian, 6,870 (0.3%) Pacific Islander, 439,661 (21.6%) from other races, and 102,364 (5.0%) from two or more races. Hispanic or Latino of any race were 1,001,145 persons (49.2%).[21]
| Population reported at 2010 United States Census | |||||||||
|---|---|---|---|---|---|---|---|---|---|
| The county | Total Population | White | African American | Native American | Asian | Pacific Islander | other races | two or more races | Hispanic or Latino (of any race) |
| San Bernardino County | 2,035,210 | 1,153,161 | 181,862 | 22,689 | 128,603 | 6,870 | 439,661 | 102,364 | 1,001,145 |
| Incorporated cities and towns | Total Population | White | African American | Native American | Asian | Pacific Islander | other races | two or more races | Hispanic or Latino (of any race) |
| Adelanto | 31,765 | 13,909 | 6,511 | 411 | 617 | 194 | 8,337 | 1,786 | 18,513 |
| Apple Valley | 69,135 | 47,762 | 6,321 | 779 | 2,020 | 294 | 8,345 | 3,614 | 20,156 |
| Barstow | 22,639 | 11,840 | 3,313 | 477 | 723 | 278 | 4,242 | 1,766 | 9,700 |
| Big Bear Lake | 5,019 | 4,204 | 22 | 48 | 78 | 10 | 491 | 166 | 1,076 |
| Chino | 77,983 | 43,981 | 4,829 | 786 | 8,159 | 168 | 16,503 | 3,557 | 41,993 |
| Chino Hills | 74,799 | 38,035 | 3,415 | 379 | 22,676 | 115 | 6,520 | 3,659 | 21,802 |
| Colton | 52,154 | 22,613 | 5,055 | 661 | 2,590 | 176 | 18,413 | 2,646 | 37,039 |
| Fontana | 196,069 | 92,978 | 19,574 | 1,957 | 12,948 | 547 | 58,449 | 9,616 | 130,957 |
| Grand Terrace | 12,040 | 7,912 | 673 | 120 | 778 | 32 | 1,898 | 627 | 4,708 |
| Hesperia | 90,173 | 55,129 | 5,226 | 1,118 | 1,884 | 270 | 22,115 | 4,431 | 44,091 |
| Highland | 53,104 | 27,836 | 5,887 | 542 | 3,954 | 168 | 11,826 | 2,891 | 25,556 |
| Loma Linda | 23,261 | 11,122 | 2,032 | 97 | 6,589 | 154 | 2,022 | 1,245 | 5,171 |
| Montclair | 36,664 | 19,337 | 1,908 | 434 | 3,425 | 74 | 9,882 | 1,604 | 25,744 |
| Needles | 4,844 | 3,669 | 95 | 399 | 35 | 9 | 323 | 314 | 1,083 |
| Ontario | 163,924 | 83,683 | 10,561 | 1,686 | 8,453 | 514 | 51,373 | 7,654 | 113,085 |
| Rancho Cucamonga | 165,269 | 102,401 | 15,246 | 1,134 | 17,208 | 443 | 19,878 | 8,959 | 57,688 |
| Redlands | 68,747 | 47,452 | 3,564 | 625 | 5,216 | 235 | 8,266 | 3,389 | 20,810 |
| Rialto | 99,171 | 43,592 | 16,236 | 1,062 | 2,258 | 361 | 30,993 | 4,669 | 67,038 |
| San Bernardino | 209,924 | 95,734 | 31,582 | 2,822 | 8,454 | 839 | 59,827 | 10,666 | 125,994 |
| Twentynine Palms | 25,048 | 17,938 | 2,063 | 329 | 979 | 345 | 1,678 | 1,716 | 5,212 |
| Upland | 73,732 | 48,364 | 5,400 | 522 | 6,217 | 159 | 9,509 | 3,561 | 28,035 |
| Victorville | 115,903 | 56,258 | 19,483 | 1,665 | 4,641 | 489 | 26,036 | 7,331 | 55,359 |
| Yucaipa | 51,367 | 40,824 | 837 | 485 | 1,431 | 74 | 5,589 | 2,127 | 13,943 |
| Yucca Valley | 20,700 | 17,280 | 666 | 232 | 469 | 44 | 1,185 | 824 | 3,679 |
| Census-designated places | Total Population | White | African American | Native American | Asian | Pacific Islander | other races | two or more races | Hispanic or Latino (of any race) |
| Baker | 735 | 302 | 1 | 5 | 10 | 14 | 380 | 23 | 502 |
| Big Bear City | 12,304 | 10,252 | 83 | 202 | 103 | 31 | 1,089 | 544 | 2,323 |
| Big River | 1,327 | 1,137 | 14 | 50 | 2 | 0 | 54 | 70 | 160 |
| Bloomington | 23,851 | 12,988 | 649 | 309 | 330 | 47 | 8,600 | 928 | 19,326 |
| Bluewater | 172 | 156 | 2 | 1 | 0 | 1 | 9 | 3 | 11 |
| Crestline | 10,770 | 9,289 | 107 | 135 | 96 | 20 | 526 | 597 | 1,775 |
| Fort Irwin | 8,845 | 5,481 | 1,086 | 103 | 402 | 120 | 916 | 737 | 2,261 |
| Homestead Valley | 3,032 | 2,594 | 34 | 58 | 30 | 9 | 196 | 111 | 517 |
| Joshua Tree | 7,414 | 6,176 | 234 | 84 | 104 | 18 | 368 | 430 | 1,308 |
| Lake Arrowhead | 12,424 | 10,729 | 95 | 93 | 152 | 33 | 847 | 475 | 2,709 |
| Lenwood | 3,543 | 2,133 | 219 | 94 | 37 | 25 | 813 | 222 | 1,675 |
| Lucerne Valley | 5,811 | 4,507 | 170 | 106 | 90 | 0 | 676 | 262 | 1,447 |
| Lytle Creek | 701 | 606 | 6 | 7 | 23 | 0 | 25 | 34 | 98 |
| Mentone | 8,720 | 6,114 | 438 | 122 | 352 | 32 | 1,234 | 428 | 3,085 |
| Morongo Valley | 3,552 | 3,076 | 40 | 73 | 31 | 4 | 187 | 141 | 531 |
| Mountain View Acres | 3,130 | 1,748 | 215 | 48 | 98 | 17 | 861 | 143 | 1,647 |
| Muscoy | 10,644 | 4,459 | 454 | 125 | 101 | 16 | 4,992 | 497 | 8,824 |
| Oak Glen | 638 | 545 | 50 | 13 | 2 | 1 | 14 | 13 | 123 |
| Oak Hills | 8,879 | 6,796 | 266 | 100 | 226 | 28 | 1,166 | 297 | 2,719 |
| Phelan | 14,304 | 10,807 | 276 | 139 | 446 | 20 | 1,993 | 623 | 4,128 |
| Piñon Hills | 7,272 | 5,966 | 58 | 65 | 189 | 4 | 659 | 331 | 1,738 |
| Running Springs | 4,862 | 4,325 | 23 | 47 | 50 | 6 | 146 | 265 | 695 |
| San Antonio Heights | 3,371 | 2,765 | 67 | 24 | 284 | 15 | 115 | 101 | 612 |
| Searles Valley | 1,739 | 1,405 | 69 | 56 | 16 | 6 | 83 | 104 | 293 |
| Silver Lakes | 5,623 | 4,566 | 315 | 39 | 198 | 15 | 270 | 220 | 907 |
| Spring Valley Lake | 8,220 | 6,450 | 403 | 55 | 381 | 23 | 481 | 427 | 1,528 |
| Wrightwood | 4,525 | 4,126 | 38 | 28 | 51 | 7 | 112 | 163 | 538 |
| Other unincorporated areas | Total Population | White | African American | Native American | Asian | Pacific Islander | other races | two or more races | Hispanic or Latino (of any race) |
| All others not CDPs (combined) | 115,368 | 69,810 | 5,951 | 1,738 | 2,997 | 366 | 29,149 | 5,357 | 61,233 |
2000
As of the census[22] of 2000, there were 1,709,434 people, 528,594 households, and 404,374 families residing in the county. The population density was 85 people per square mile (33/km²). There were 601,369 housing units at an average density of 30 per square mile (12/km²). The racial makeup of the county was 58.9% White, 9.1% African American, 1.2% Native American, 4.7% Asian, 0.3% Pacific Islander, 20.8% from other races, and 5.0% from two or more races. 39.2% of the population were Hispanic or Latino of any race. 8.3% were of German, 5.5% English and 5.1% Irish ancestry. 66.1% spoke English, 27.7% Spanish and 1.1% Tagalog as their first language.
There were 528,594 households, out of which 43.7% had children under the age of 18 living with them, 55.8% were married couples living together, 14.8% had a female householder with no husband present, and 23.5% were non-families. 18.4% of all households were made up of individuals, and 6.6% had someone 65 years of age or older living alone. The average household size was 3.2 people, and the average family size was 3.6 people.
The number of homeless in San Bernardino County grew from 5,270 in 2002 to 7,331 in 2007, a 39% increase.[23]
In the county, the population was spread out—with 32.3% under the age of 18, 10.3% from 18 to 24, 30.2% from 25 to 44, 18.7% from 45 to 64, and 8.6% who were 65 years of age or older. The median age was 30 years. For every 100 females, there were 99.6 males. For every 100 females age 18 and over, there were 97.2 males.
The median income for a household in the county was $42,066, and the median income for a family was $46,574. Males had a median income of $37,025 versus $27,993 for females. The per capita income for the county was $16,856. About 12.6% of families and 15.80% of the population were below the poverty line, including 20.6% of those under age 18 and 8.4% of those age 65 or over.
Government and policing
County government
The San Bernardino County Board of Supervisors has 5 members elected from their districts:[24]
- Robert A. Lovingood (First District),
- Janice Rutherford (Second District),
- Dawn Rowe (Third District),
- Chairman Curt Hagman (Fourth District), and
- Vice Chair Josie Gonzales (Fifth District).
Other County of San Bernardino Elected Officials [25]
- Ensen Mason (Auditor-Controller/Treasurer/Tax Collector)
- Bob Dutton (Assessor/Recorder)
- Theodore Alejandre (County Superintendent of Schools)
- Jason Anderson (District Attorney)
- John McMahon (Sheriff/Coroner/Public Administrator)
State and federal representation
In the United States House of Representatives, San Bernardino County is split between 5 congressional districts:[26]
- California's 8th congressional district, represented by Republican Paul Cook,
- California's 27th congressional district, represented by Democrat Judy Chu,
- California's 31st congressional district, represented by Democrat Pete Aguilar,
- California's 35th congressional district, represented by Democrat Norma Torres, and
- California's 39th congressional district, represented by Democrat Gil Cisneros.
In the California State Assembly, San Bernardino County is split between 8 assembly districts:[27]
- the 33rd Assembly District, represented by Republican Jay Obernolte,
- the 36th Assembly District, represented by Republican Tom Lackey,
- the 40th Assembly District, represented by Democrat James Ramos,
- the 41st Assembly District, represented by Democrat Chris Holden,
- the 42nd Assembly District, represented by Independent Chad Mayes,
- the 47th Assembly District, represented by Democrat Eloise Reyes,
- the 52nd Assembly District, represented by Democrat Freddie Rodriguez, and
- the 55th Assembly District, represented by Republican Phillip Chen.
In the California State Senate, San Bernardino County is split between 6 districts:[28]
- the 16th Senate District, represented by Republican Shannon Grove,
- the 20th Senate District, represented by Democrat Connie Leyva,
- the 21st Senate District, represented by Republican Scott Wilk,
- the 23rd Senate District, represented by Republican Mike Morrell,
- the 25th Senate District, represented by Democrat Anthony Portantino, and
- the 29th Senate District, represented by Republican Ling Ling Chang.
Policing
Sheriff
The San Bernardino County Sheriff provides court protection, jail administration, and coroner services for all of San Bernardino County. It provides police patrol, detective, and marshal services for the unincorporated areas of the county.
Municipal police
Municipal police departments in the county are: Fontana, San Bernardino, Rialto, Ontario, Upland, Montclair, chino, Redlands, Colton, and Barstow. The San Bernardino County Sheriff provides contract law enforcement services to 14 incorporated cities and towns: Adelanto, Apple Valley, Big Bear, Chino Hills, Grand Terrace, Hesperia, Highland, Loma Linda, Needles, Rancho Cucamonga, Twentynine Palms, Victorville, Yucaipa, and Yucca Valley. Also for the San Manuel Band of Mission Indians. The Sheriff's Commanders assigned to these stations acts as each municipality's Chief of Police.
Politics
Voter registration
| Population and registered voters | ||
|---|---|---|
| Total population[10] | 2,023,452 | |
| Registered voters[29][note 3] | 869,637 | 43.0% |
| Democratic[29] | 339,603 | 39.1% |
| Republican[29] | 307,945 | 35.4% |
| Democratic–Republican spread[29] | +31,658 | +3.7% |
| Independent[29] | 31,121 | 3.6% |
| Green[29] | 3,174 | 0.4% |
| Libertarian[29] | 5,121 | 0.6% |
| Peace and Freedom[29] | 3,204 | 0.4% |
| Americans Elect[29] | 68 | 0.0% |
| Other[29] | 1,941 | 0.2% |
| No party preference[29] | 177,460 | 20.4% |
Cities by population and voter registration
| Cities by population and voter registration | |||||||
|---|---|---|---|---|---|---|---|
| City | Population[10] | Registered voters[29] [note 3] |
Democratic[29] | Republican[29] | D–R spread[29] | Other[29] | No party preference[29] |
| Adelanto | 30,670 | 29.8% | 48.8% | 21.7% | +27.1% | 11.1% | 23.2% |
| Apple Valley | 68,316 | 52.3% | 29.1% | 46.1% | -17.0% | 11.5% | 18.4% |
| Barstow | 22,913 | 37.2% | 41.5% | 29.0% | +12.5% | 11.0% | 23.3% |
| Big Bear Lake | 5,109 | 56.7% | 23.9% | 51.6% | -27.7% | 10.8% | 17.9% |
| Chino | 78,050 | 42.0% | 39.2% | 36.9% | +2.3% | 7.1% | 19.8% |
| Chino Hills | 74,765 | 52.6% | 31.8% | 40.6% | -8.8% | 6.9% | 23.4% |
| Colton | 52,283 | 38.9% | 49.9% | 25.4% | +24.5% | 7.5% | 20.2% |
| Fontana | 192,779 | 38.2% | 48.6% | 24.7% | +23.9% | 7.0% | 22.5% |
| Grand Terrace | 12,132 | 54.9% | 37.0% | 39.3% | -2.3% | 8.1% | 18.9% |
| Hesperia | 88,247 | 41.7% | 34.3% | 38.2% | -3.9% | 10.9% | 21.2% |
| Highland | 52,777 | 45.5% | 38.4% | 37.4% | +1.0% | 8.0% | 19.5% |
| Loma Linda | 23,081 | 46.2% | 32.9% | 36.3% | -3.4% | 8.5% | 25.8% |
| Montclair | 36,802 | 35.8% | 50.2% | 23.5% | +26.7% | 7.1% | 21.8% |
| Needles | 4,910 | 39.1% | 40.8% | 28.7% | +12.1% | 13.8% | 22.8% |
| Ontario | 165,120 | 36.7% | 46.9% | 28.5% | +18.4% | 7.1% | 20.3% |
| Rancho Cucamonga | 163,151 | 53.8% | 35.6% | 39.5% | -3.9% | 8.0% | 20.3% |
| Redlands | 68,995 | 56.1% | 33.9% | 42.4% | -8.5% | 8.9% | 18.4% |
| Rialto | 99,501 | 39.6% | 52.0% | 23.7% | +28.3% | 6.9% | 20.1% |
| San Bernardino | 210,100 | 36.8% | 46.5% | 29.5% | +17.0% | 7.7% | 19.4% |
| Twentynine Palms | 25,786 | 22.1% | 27.5% | 41.1% | -13.6% | 11.1% | 24.9% |
| Upland | 74,021 | 52.0% | 35.4% | 40.7% | -5.3% | 7.6% | 19.3% |
| Victorville | 111,704 | 38.4% | 43.5% | 29.6% | +13.9% | 10.0% | 21.1% |
| Yucaipa | 50,862 | 54.1% | 27.5% | 48.9% | -21.4% | 10.4% | 17.5% |
| Yucca Valley | 20,508 | 48.0% | 28.1% | 45.3% | -17.2% | 11.4% | 20.1% |
Overview
| Year | GOP | DEM | Others |
|---|---|---|---|
| 2016 | 41.5% 271,240 | 52.1% 340,833 | 6.4% 41,910 |
| 2012 | 45.0% 262,358 | 52.3% 305,109 | 2.7% 15,463 |
| 2008 | 45.8% 277,408 | 52.1% 315,720 | 2.2% 13,206 |
| 2004 | 55.3% 289,306 | 43.5% 227,789 | 1.2% 6,181 |
| 2000 | 48.8% 221,757 | 47.2% 214,749 | 4.0% 18,387 |
| 1996 | 43.6% 180,135 | 44.4% 183,372 | 12.1% 49,848 |
| 1992 | 37.2% 176,563 | 38.7% 183,634 | 24.0% 113,873 |
| 1988 | 60.0% 235,167 | 38.6% 151,118 | 1.5% 5,723 |
| 1984 | 64.8% 222,071 | 34.0% 116,454 | 1.2% 4,180 |
| 1980 | 59.7% 172,957 | 31.7% 91,790 | 8.7% 25,065 |
| 1976 | 49.5% 113,265 | 47.9% 109,636 | 2.6% 5,984 |
| 1972 | 59.7% 144,689 | 35.5% 85,986 | 4.8% 11,581 |
| 1968 | 50.1% 111,974 | 40.0% 89,418 | 9.9% 22,224 |
| 1964 | 42.8% 92,145 | 57.1% 123,012 | 0.1% 243 |
| 1960 | 52.0% 99,481 | 47.5% 90,888 | 0.5% 944 |
| 1956 | 56.9% 86,263 | 42.8% 64,946 | 0.3% 443 |
| 1952 | 57.3% 77,718 | 41.8% 56,663 | 0.9% 1,153 |
| 1948 | 48.6% 46,570 | 47.7% 45,691 | 3.7% 3,577 |
| 1944 | 46.5% 34,084 | 52.6% 38,530 | 0.9% 646 |
| 1940 | 44.3% 30,511 | 54.5% 37,520 | 1.2% 847 |
| 1936 | 39.0% 22,219 | 59.6% 33,955 | 1.5% 842 |
| 1932 | 44.6% 22,094 | 50.2% 24,889 | 5.2% 2,565 |
| 1928 | 74.7% 29,229 | 24.1% 9,436 | 1.1% 447 |
| 1924 | 56.9% 15,974 | 9.4% 2,634 | 33.7% 9,453 |
| 1920 | 62.8% 12,518 | 28.2% 5,620 | 9.0% 1,783 |
| 1916 | 50.7% 11,932 | 39.9% 9,398 | 9.4% 2,215 |
| 1912 | 1.1% 172 | 38.0% 5,835 | 60.9% 9,336 |
| 1908 | 52.9% 4,729 | 30.0% 2,685 | 17.0% 1,526 |
| 1904 | 58.2% 3,884 | 23.6% 1,573 | 18.1% 1,213 |
| 1900 | 52.2% 3,135 | 39.1% 2,347 | 8.8% 529 |
| 1896 | 48.5% 2,818 | 47.2% 2,740 | 4.3% 247 |
| 1892 | 48.7% 3,686 | 33.7% 2,546 | 17.6% 1,335 |
San Bernardino County is a county in which candidates from both major political parties have won in recent elections. Democrat Hillary Clinton carried the county by a majority and by double digits in 2016. The Democratic Party also carried the county in 2008 and 2012, when Barack Obama won majorities of the county's votes, and in 1992 and 1996, when Bill Clinton won pluralities. Republican George W. Bush took the county in 2000 by a plurality and in 2004 by a majority. The county is split between heavily Latino, middle-class, and Democratic areas and more wealthy conservative areas. The heavily Latino cities of Ontario and San Bernardino went for John Kerry in 2004, but with a relatively low voter turnout. In 2006, San Bernardino's population exceeded 201,000, and in 2004, only 42,520 votes were cast in the city; in 2006, strongly Republican Rancho Cucamonga had over 145,000 residents, of whom 53,054 voted.
According to the California Secretary of State, as of February 2020, there were 1,016,190 registered voters in San Bernardino County. Of those, 410,197 (40.37%) were registered Democrats, 298,234 (29.35%) were registered Republicans, with the remainder belonging to minor political parties or declining to state.[31]
On November 4, 2008, San Bernardino County voted 67% for Proposition 8, which amended the California Constitution to ban same-sex marriages.[32]
Public safety
Law enforcement

The current district attorney is Jason Anderson, who was elected in March 2018 and took office on January 1, 2019.
The county's primary law enforcement agency is the San Bernardino County Sheriff's Department. The department provides law enforcement services in the unincorporated areas of the county and in 14 contract cities, operates the county jail system, provides marshal services in the county superior courts, and has numerous other divisions to serve the residents of the county.
Sergeant Phil Brown of the San Bernardino County Sheriff's Department has said that gangs are growing more violent in the farthest reaches of the county, including the High Desert. Racial tensions among Chicano gangs and African-American gangs have increased dramatically in the Inland Empire, affecting even the most rural areas. "It's getting out in more remote areas," Brown said. "They go gang against gang. There's more gang violence to the general public and it's becoming more random..."[33]
Fire rescue
The county operates the San Bernardino County Consolidated Fire District (commonly known as the San Bernardino County Fire Department). The department provides "all-risk" fire, rescue, and emergency medical services to all unincorporated areas in the county except for several areas served by independent fire protection districts, and several cities that chose to contract with the department.
Crime
The following table includes the number of incidents reported and the rate per 1,000 persons for each type of offense.
| Population and crime rates | ||
|---|---|---|
| Population[10] | 2,023,452 | |
| Violent crime[34] | 10,038 | 4.96 |
| Homicide[34] | 121 | 0.06 |
| Forcible rape[34] | 500 | 0.25 |
| Robbery[34] | 3,017 | 1.49 |
| Aggravated assault[34] | 6,400 | 3.16 |
| Property crime[34] | 35,314 | 17.45 |
| Burglary[34] | 15,178 | 7.50 |
| Larceny-theft[34][note 4] | 31,697 | 15.66 |
| Motor vehicle theft[34] | 9,730 | 4.81 |
| Arson[34] | 512 | 0.25 |
Cities by population and crime rates
| Cities by population and crime rates | ||||||||
|---|---|---|---|---|---|---|---|---|
| City | Population[35] | Violent crimes[35] | Violent crime rate per 1,000 persons |
Property crimes[35] | Property crime rate per 1,000 persons | |||
| Adelanto | 32,520 | 199 | 6.12 | 924 | 28.41 | |||
| Apple Valley | 70,823 | 221 | 3.12 | 1,874 | 26.46 | |||
| Barstow | 23,188 | 207 | 8.93 | 843 | 36.36 | |||
| Big Bear Lake | 5,141 | 42 | 8.17 | 313 | 60.88 | |||
| Chino | 79,792 | 291 | 3.65 | 2,116 | 26.52 | |||
| Chino Hills | 76,632 | 64 | 0.84 | 956 | 12.48 | |||
| Colton | 53,431 | 189 | 3.54 | 1,907 | 35.69 | |||
| Fontana | 200,874 | 850 | 4.23 | 4,494 | 22.37 | |||
| Grand Terrace | 12,333 | 29 | 2.35 | 285 | 23.11 | |||
| Hesperia | 92,383 | 402 | 4.35 | 2,502 | 27.08 | |||
| Highland | 54,403 | 296 | 5.44 | 1,616 | 29.70 | |||
| Loma Linda | 23,819 | 43 | 1.81 | 626 | 26.28 | |||
| Montclair | 37,556 | 197 | 5.25 | 1,703 | 45.35 | |||
| Needles | 4,963 | 23 | 4.63 | 213 | 42.92 | |||
| Ontario | 167,933 | 534 | 3.18 | 5,056 | 30.11 | |||
| Rancho Cucamonga | 169,276 | 321 | 1.90 | 4,362 | 25.77 | |||
| Redlands | 70,399 | 221 | 3.14 | 2,992 | 42.50 | |||
| Rialto | 101,595 | 509 | 5.01 | 3,571 | 35.15 | |||
| San Bernardino | 214,987 | 2,022 | 9.41 | 10,510 | 48.89 | |||
| Twentynine Palms | 25,612 | 81 | 3.16 | 463 | 18.08 | |||
| Upland | 75,531 | 148 | 1.96 | 2,328 | 30.82 | |||
| Victorville | 118,687 | 676 | 5.70 | 4,465 | 37.62 | |||
| Yucaipa | 52,622 | 119 | 2.26 | 944 | 17.94 | |||
| Yucca Valley | 21,204 | 90 | 4.24 | 560 | 26.41 | |||
Education
Colleges and universities
- Barstow Community College
- Brandman University (Ontario campus)
- California State University, San Bernardino
- Chaffey College
- Copper Mountain College
- Crafton Hills College
- Loma Linda University
- National University (campuses in Ontario and San Bernardino)
- Palo Verde Community College (Needles campus)
- San Bernardino Valley College
- University of Redlands
- Victor Valley College
Libraries
The San Bernardino County Library System consists of 33 branches across the county. The library system also has inter-library loan partnerships with libraries in College of the Desert, Moreno Valley, Murrieta, and Victorville.[36] Library services offered vary from branch to branch, but include internet access, children's story times, adult literacy services, book clubs, classes, and special events.[37] The library system also offers e-books, digital music and movie downloads, free access to online learning through Lynda.com, and many other digital services.[38]
City-sponsored public libraries also exist in San Bernardino County, including A. K. Smiley Public Library in Redlands, California, which was built in 1898.[39] Other public libraries in the County include: The San Bernardino City Public Library System, Rancho Cucamonga Public Library, Upland Public Library, Colton City Library, and the Ontario City Library.[40] These libraries are separate from the county system and do not share circulation privileges.
Transportation
Major highways
Public transportation
- Morongo Basin Transit Authority provides bus service in Yucca Valley, Joshua Tree and Twentynine Palms (including the Marine base). Limited service is also provided to Palm Springs.
- Mountain Area Regional Transit Authority (MARTA) covers the Lake Arrowhead and Big Bear regions. Limited service is also provided to Downtown San Bernardino.
- Needles Area Transit serves Needles and the surrounding county area.
- Omnitrans provides transit service in the urbanized portion of San Bernardino County, serving the City of San Bernardino, as well as the area between Montclair and Yucaipa.
- Victor Valley Transit Authority operates buses in Victorville, Hesperia, Adelanto, Apple Valley and the surrounding county area.
- Foothill Transit connects the Inland Empire area to the San Gabriel Valley and downtown Los Angeles.
- RTA connects Montclair, and Anaheim to Riverside County.
- San Bernardino County is also served by Greyhound buses and Amtrak trains. Metrolink commuter trains connect the urbanized portion of the county with Los Angeles, Orange, and Riverside Counties.
Airports
- Commercial passenger flights are available at Ontario International Airport.
- San Bernardino International Airport is being remodeled and is expected to serve the region as an international airport. The airport will have access through I-215 and I-10 via Mill Street. Terminal construction recently finished, and commercial flights are planned, awaiting carriers to select SBD as a destination airport.
- Southern California Logistics Airport (Victorville) is a major airplane graveyard, general aviation airport, and a Partial Air Force Installation.
- The County of San Bernardino owns six general aviation airports: Apple Valley Airport, Baker Airport, Barstow-Daggett Airport, Chino Airport, Needles Airport, and Twentynine Palms Airport.
- Other general aviation airports in the county include: Big Bear City Airport, Cable Airport (Upland), Hesperia Airport (not listed in NPIAS),[41] and Redlands Municipal Airport
Environmental quality
California Attorney General Jerry Brown sued the county in April 2007 under the state's environmental quality act for failing to account for the impact of global warming in the county's 25-year growth plan, approved in March. The Center for Biological Diversity, the Sierra Club and the Audubon Society also sued in a separate case. According to Brendan Cummings, a senior attorney for the plaintiffs: "San Bernardino has never seen a project it didn't like. They rubber-stamp development. It's very much of a frontier mentality." The plaintiffs want the county to rewrite its growth plan's environmental impact statement to include methods to measure greenhouse gases and take steps to reduce them.[42]
According to county spokesman David Wert, only 15% of the county is controlled by the county; the rest is cities and federal and state land. However, the county says it will make sure employment centers and housing are near transportation corridors to reduce traffic and do more to promote compact development and mass transit. The county budgeted $325,000 to fight the lawsuit.[42]
The state and the county reached a settlement in August 2007.[43] The county agreed to amend its general plan to include a Greenhouse Gas Emissions Reduction Plan, including an emissions inventory and reduction targets.
Climate
| ||||||||||||||||||||||||||||||||||||||||||||||||||||||||||||||||||||||||||||||||||||||||||||||||||||||||||||||||||||||||||||
Communities
Cities
| City | Year incorporated |
Population, 2018[45] |
Median income, 2012[46] |
Land area sq mi (km2) |
|---|---|---|---|---|
| Adelanto | 1970 | 34,160 | $34,925 | 56.009 (145.062) |
| Apple Valley | 1988 | 73,508 | $40,313 | 73.193 (189.57) |
| Barstow | 1947 | 23,972 | $41,556 | 41.385 (107.186) |
| Big Bear Lake | 1981 | 5,281 | $32,869 | 6.346 (16.435) |
| Chino | 1910 | 91,583 | $66,035 | 29.639 (76.766) |
| Chino Hills | 1991 | 83,447 | $82,241 | 44.681 (115.723) |
| Colton | 1887 | 54,741 | $38,329 | 15.324 (39.689) |
| Fontana | 1952 | 213,739 | $61,085 | 42.432 (109.899) |
| Grand Terrace | 1978 | 12,584 | $64,073 | 3.502 (9.07) |
| Hesperia | 1988 | 95,274 | $38,058 | 73.096 (189.316) |
| Highland | 1987 | 55,406 | $53,524 | 18.755 (48.575) |
| Loma Linda | 1970 | 24,382 | $59,358 | 7.516 (19.467) |
| Montclair | 1956 | 39,437 | $47,360 | 5.517 (14.289) |
| Needles | 1913 | 4,982 | $29,613 | 30.808 (79.793) |
| Ontario | 1891 | 181,107 | $52,014 | 49.941 (129.345) |
| Rancho Cucamonga | 1977 | 177,751 | $74,118 | 39.851 (103.212) |
| Redlands | 1888 | 71,586 | $61,681 | 36.126 (93.565) |
| Rialto | 1911 | 103,440 | $48,197 | 22.351 (57.889) |
| San Bernardino | 1854 | 215,941 | $37,244 | 59.201 (153.33) |
| Twentynine Palms | 1987 | 26,418 | $40,975 | 59.143 (153.179) |
| Upland | 1906 | 77,000 | $56,480 | 15.617 (40.448) |
| Victorville | 1962 | 122,312 | $44,426 | 73.178 (189.529) |
| Yucaipa | 1989 | 53,682 | $57,539 | 27.888 (72.231) |
| Yucca Valley | 1991 | 21,726 | $40,057 | 40.015 (103.639) |
Census-designated places
- Baker
- Big Bear City
- Big River
- Bloomington
- Bluewater
- Crestline
- Fort Irwin
- Homestead Valley
- Joshua Tree
- Lake Arrowhead
- Lenwood
- Lucerne Valley
- Lytle Creek
- Mentone
- Morongo Valley
- Mountain View Acres
- Muscoy
- Oak Glen
- Oak Hills
- Phelan
- Pinon Hills
- Running Springs
- San Antonio Heights
- Searles Valley
- Silver Lakes
- Spring Valley Lake
- Wrightwood
Unincorporated communities
- Amboy
- Angelus Oaks
- Argus
- Arrowbear Lake
- Arrowhead Farms
- Arrowhead Highlands
- Arrowhead Junction
- Baldwin Lake
- Baldy Mesa
- Bell Mountain
- Blue Jay
- Bryman
- Cadiz
- Cajon Junction
- Cedar Glen
- Cedarpines Park
- Cima
- Crafton
- Crest Park
- Cushenbury
- Daggett
- Danby
- Declezville
- Earp
- El Mirage
- Essex
- Fawnskin
- Fenner
- Forest Falls
- Goffs
- Green Valley Lake
- Guasti
- Halloran Springs
- Havasu Lake
- Helendale
- Hinkley
- Hodge
- Ivanpah
- Johnson Valley
- Kingston
- Kramer
- Kramer Hills
- Kramer Junction
- La Delta
- Landers
- Ludlow
- Mars
- Midway
- Mojave Heights
- Mount Baldy
- Mountain Home Village
- Mountain Pass
- Newberry Springs
- Nipton
- Oro Grande
- Parker Dam
- Patton
- Pioneer Point
- Pioneertown
- Red Mountain
- Rimforest
- Skyforest
- Sugarloaf
- Sunfair
- Sunfair Heights
- Trona
- Twentynine Palms Base
- Twin Peaks
- Venus
- Vidal
- Vidal Junction
- Wonder Valley
- Yermo
- Zzyzx
Indian Reservations
- Chemehuevi Indian Reservation
- Colorado River Indian Reservation (partially in Riverside County, and La Paz County, Arizona)
- Fort Mojave Indian Reservation (partially in Mohave County, Arizona, and Clark County, Nevada)
- San Manuel Indian Reservation
- Twenty-Nine Palms Indian Reservation (partially in Riverside County)
Population ranking
The population ranking of the following table is based on the 2010 census of San Bernardino County.[47]
† county seat
| Rank | City/Town/etc. | Municipal type | Population (2010 Census) |
|---|---|---|---|
| 1 | † San Bernardino | City | 209,924 |
| 2 | Fontana | City | 196,069 |
| 3 | Rancho Cucamonga | City | 165,269 |
| 4 | Ontario | City | 163,924 |
| 5 | Victorville | City | 115,903 |
| 6 | Rialto | City | 99,171 |
| 7 | Hesperia | City | 90,173 |
| 8 | Chino | City | 77,983 |
| 9 | Chino Hills | City | 74,799 |
| 10 | Upland | City | 73,732 |
| 11 | Apple Valley | Town | 69,134 |
| 12 | Redlands | City | 68,747 |
| 13 | Highland | City | 53,104 |
| 14 | Colton | City | 52,154 |
| 15 | Yucaipa | City | 51,367 |
| 16 | Montclair | City | 36,664 |
| 17 | Adelanto | City | 31,765 |
| 18 | Twentynine Palms | City | 25,048 |
| 19 | Bloomington | CDP | 23,851 |
| 20 | Loma Linda | City | 23,261 |
| 21 | Barstow | City | 22,639 |
| 22 | Yucca Valley | Town | 20,700 |
| 23 | Phelan | CDP | 14,304 |
| 24 | Lake Arrowhead | CDP | 12,424 |
| 25 | Big Bear City | CDP | 12,304 |
| 26 | Grand Terrace | City | 12,040 |
| 27 | Crestline | CDP | 10,770 |
| 28 | Muscoy | CDP | 10,644 |
| 29 | Oak Hills | CDP | 8,879 |
| 30 | Fort Irwin | CDP | 8,845 |
| 31 | Mentone | CDP | 8,720 |
| 32 | Spring Valley Lake | CDP | 8,220 |
| 33 | Joshua Tree | CDP | 7,414 |
| 34 | Piñon Hills | CDP | 7,272 |
| 35 | Lucerne Valley | CDP | 5,811 |
| 36 | Silver Lakes | CDP | 5,623 |
| 37 | Big Bear Lake | City | 5,019 |
| 38 | Running Springs | CDP | 4,862 |
| 39 | Needles | City | 4,844 |
| 40 | Wrightwood | CDP | 4,525 |
| 41 | Landers | Town | 3,910 |
| 42 | Morongo Valley | CDP | 3,552 |
| 43 | Lenwood | CDP | 3,543 |
| 44 | San Antonio Heights | CDP | 3,371 |
| 45 | Mountain View Acres | CDP | 3,130 |
| 46 | Homestead Valley | CDP | 3,032 |
| 47 | Searles Valley | CDP | 1,739 |
| 48 | Colorado River Indian Reservation[48] | AIAN | 1,687 |
| 49 | Big River | CDP | 1,327 |
| 50 | Baker | CDP | 735 |
| 51 | Lytle Creek | CDP | 701 |
| 52 | Oak Glen | CDP | 638 |
| 53 | Chemehuevi Reservation[49] | AIAN | 308 |
| 54 | Fort Mojave Indian Reservation[50] | AIAN | 250 |
| 55 | Bluewater | CDP | 172 |
| 56 | San Manuel Reservation[51] | AIAN | 112 |
| 57 | Twenty-Nine Palms Reservation[52] | AIAN | 12 |
Places of interest
- The Mojave National Preserve
- Calico Ghost Town — northeast of Barstow via Interstate 15
- Zzyzx — a small desert settlement that used to be a health spa and is now the Desert Studies Center
- Downtown San Bernardino
- Joshua Tree National Park
- San Bernardino National Forest — home to Big Bear Lake outdoor activities
- Goldstone Deep Space Communications Complex
- Snow Summit, Bear Mountain (Ski Area), and Snow Valley Mountain Resort are home to Southern California's premier winter ski resorts. Mountain High, although technically located in Los Angeles County, is also an alternative to Snow Summit and Bear Mountain because of its proximity to San Bernardino County.
- The Pacific Crest Trail, officially designated as the Pacific Crest National Scenic Trail (PCT), passes through San Bernardino County.[53]
See also
- List of California counties
- List of cemeteries in San Bernardino County
- List of museums in the Inland Empire (California)
- List of school districts in San Bernardino County, California
- National Register of Historic Places listings in San Bernardino County, California
Newspapers, past and present
- Chino Champion, Chino
- The Daily Report, Ontario
- The San Bernardino Sun
- Upland News, Upland
Notes
- Other = Some other race + Two or more races
- Native American = Native Hawaiian or other Pacific Islander + American Indian or Alaska Native
- Percentage of registered voters with respect to total population. Percentages of party members with respect to registered voters follow.
- Only larceny-theft cases involving property over $400 in value are reported as property crimes.
References
- "San Bernardino County". Geographic Names Information System. United States Geological Survey. Retrieved January 18, 2015.
- "San Gorgonio Mountain". Peakbagger.com. Retrieved February 16, 2015.
- "State & County QuickFacts". United States Census Bureau. Retrieved May 29, 2014.
- "Population and Housing Unit Estimates". Retrieved October 18, 2019.
- "Find a County". National Association of Counties. Retrieved June 7, 2011.
- Van de Grift Sanchez, Nellie (1914). Spanish and Indian place names of California: their meaning and their romance. A.M. Robertson. p. 74. Retrieved June 25, 2017.
- "2010 Census Gazetteer Files". United States Census Bureau. August 22, 2012. Retrieved October 4, 2015.
- "DataSet.txt". State & County QuickFacts. U.S. Census Bureau. Archived from the original on September 30, 2013. Retrieved November 16, 2012. (See "Download the Database Archived November 11, 2012, at the Wayback Machine" for an explanation of this data set.)
- "COUNTY of SAN BERNARDINO PUBLIC LANDS AT A GLANCE" (PDF). Retrieved April 7, 2020.
- U.S. Census Bureau. American Community Survey, 2011 American Community Survey 5-Year Estimates, Table B02001. U.S. Census website. Retrieved October 26, 2013.
- U.S. Census Bureau. American Community Survey, 2011 American Community Survey 5-Year Estimates, Table B03003. U.S. Census website. Retrieved October 26, 2013.
- U.S. Census Bureau. American Community Survey, 2011 American Community Survey 5-Year Estimates, Table B19301. U.S. Census website. Retrieved October 21, 2013.
- U.S. Census Bureau. American Community Survey, 2011 American Community Survey 5-Year Estimates, Table B19013. U.S. Census website. Retrieved October 21, 2013.
- U.S. Census Bureau. American Community Survey, 2011 American Community Survey 5-Year Estimates, Table B19113. U.S. Census website. Retrieved October 21, 2013.
- U.S. Census Bureau. American Community Survey, 2011 American Community Survey 5-Year Estimates. U.S. Census website. Retrieved October 21, 2013.
- U.S. Census Bureau. American Community Survey, 2011 American Community Survey 5-Year Estimates, Table B01003. U.S. Census website. Retrieved October 21, 2013.
- "U.S. Decennial Census". United States Census Bureau. Retrieved October 4, 2015.
- "Historical Census Browser". University of Virginia Library. Retrieved October 4, 2015.
- Forstall, Richard L., ed. (March 27, 1995). "Population of Counties by Decennial Census: 1900 to 1990". United States Census Bureau. Retrieved October 4, 2015.
- "Census 2000 PHC-T-4. Ranking Tables for Counties: 1990 and 2000" (PDF). United States Census Bureau. April 2, 2001. Retrieved October 4, 2015.
- "2010 Census P.L. 94-171 Summary File Data". United States Census Bureau.
- "U.S. Census website". United States Census Bureau. Retrieved May 14, 2011.
- Quan, Douglas (September 25, 2007). "S.B. County steps up fight against homelessness". Press Enterprise. Archived from the original on May 20, 2011. Retrieved December 24, 2007.
- "San Bernardino County - Board of Supervisors". www.sbcounty.gov.
- "Elections Office of the Registrar of Voters > Elected Officials & Candidates > County". www.sbcountyelections.com. Retrieved May 24, 2019.
- "Counties by County and by District". California Citizens Redistricting Commission. Archived from the original on September 30, 2013. Retrieved September 24, 2014.
- "Communities of Interest - Counties". California Citizens Redistricting Commission. Archived from the original on October 23, 2015. Retrieved September 24, 2014.
- "Communities of Interest - Counties". California Citizens Redistricting Commission. Archived from the original on October 23, 2015. Retrieved September 24, 2014.
- California Secretary of State. February 10, 2013 - Report of Registration Archived July 27, 2013, at the Wayback Machine. Retrieved October 31, 2013.
- Leip, David. "Dave Leip's Atlas of U.S. Presidential Elections". uselectionatlas.org.
- "Report of Registration as of May 4, 2009 - Registration By County" (PDF). sos.ca.gov. Archived from the original (PDF) on November 13, 2010. Retrieved November 30, 2010.
- "Gay marriage ban: A tale of two votes". Los Angeles Times. ISSN 0458-3035. Retrieved January 17, 2018.
- Barrett, Beth (September 26, 2004). "Homegrown Terror". lang.sbsun.com. Retrieved November 30, 2010.
- Office of the Attorney General, Department of Justice, State of California. Table 11: Crimes – 2009 Archived December 2, 2013, at the Wayback Machine. Retrieved November 14, 2013.
- United States Department of Justice, Federal Bureau of Investigation. Crime in the United States, 2012, Table 8 (California). Retrieved November 14, 2013.
- "Library Locations". San Bernardino County Library. Retrieved December 31, 2017.
- "Courses and Events". San Bernardino County Library. Retrieved December 31, 2017.
- "Research and e-Content". San Bernardino County Library. Retrieved December 31, 2017.
- "A.K. Smiley Public Library history". Archived from the original on August 29, 2011.
- "Public libraries in San Bernardino County, CA". Maps.google.com. January 1, 1970. Retrieved November 5, 2011.
- Site L26 List of airports in California
- Ritter, John (June 5, 2007). "Inland Empire's 25-year growth targeted". USA Today. Retrieved November 10, 2007.
- Office of the Attorney General, State of California, Brown Announces Landmark Global Warming Settlement, August 21, 2007.
- "NASA Earth Observations Data Set Index". NASA. Retrieved January 30, 2016.
- Bureau, U.S. Census. "U.S. Census website". United States Census Bureau. Retrieved October 6, 2019.
- Husing, John (October 2014). "Inland Empire City Profile 2014" (PDF). Inland Empire Quarterly Economic Report. Redlands: Economics & Politics, Inc. 26 (4). Retrieved January 4, 2015.
- "US Census Bureau 2010 Census". www.census.gov.
- "US Census Bureau 2010 Census Interactive Population Map". www.census.gov.
- "US Census Bureau 2010 Census Interactive Population Map". www.census.gov.
- "US Census Bureau 2010 Census Interactive Population Map". www.census.gov.
- "US Census Bureau 2010 Census Interactive Population Map". www.census.gov.
- "US Census Bureau 2010 Census Interactive Population Map". www.census.gov.
- "County Highpoints - Regional Lists". www.cohp.org.
External links
| Wikimedia Commons has media related to San Bernardino County, California. |
- Official website

- San Bernardino County Museum website
- San Bernardino County Museum at Google Cultural Institute
- San Bernardino County Library website
- Trilobites In The Marble Mountains, Mojave Desert, California

| Authority control |
|
|---|