McKinley County, New Mexico
McKinley County is a county in the northwestern section of the U.S. state of New Mexico. As of the 2010 census, the population was 71,492.[1] Its county seat is Gallup.[2] The county was created in 1901 and named for President William McKinley.[3]
McKinley County | |
|---|---|
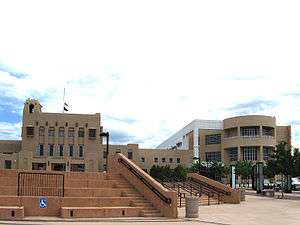 McKinley County Courthouse in Gallup | |
 Seal | |
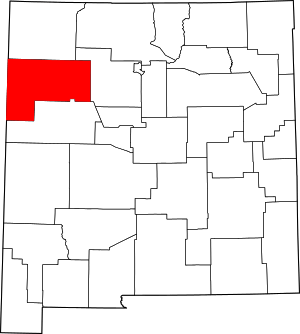 Location within the U.S. state of New Mexico | |
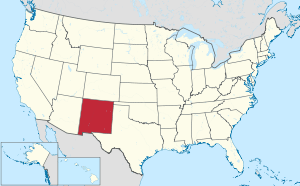 New Mexico's location within the U.S. | |
| Coordinates: 35°35′N 108°16′W | |
| Country | |
| State | |
| Founded | January 1, 1901 |
| Named for | William McKinley |
| Seat | Gallup |
| Largest city | Gallup |
| Area | |
| • Total | 5,455.5 sq mi (14,130 km2) |
| • Land | 5,450 sq mi (14,100 km2) |
| • Water | 5.5 sq mi (14 km2) 0.1%% |
| Population | |
| • Estimate (2019) | 71,367 |
| • Density | 13/sq mi (5/km2) |
| Time zone | UTC−7 (Mountain) |
| • Summer (DST) | UTC−6 (MDT) |
| Congressional districts | 2nd, 3rd |
| Website | www |
McKinley County is Gallup's micropolitan statistical area.
Geography
According to the U.S. Census Bureau, the county has a total area of 5,455 square miles (14,130 km2), of which 5,450 square miles (14,100 km2) is land and 5.5 square miles (14 km2) (0.1%) is water.[4]
Adjacent counties
- San Juan County - north
- Sandoval County - east
- Cibola County - south
- Apache County, Arizona - west
Major highways


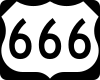
- New Mexico Highway 264
- New Mexico Highway 371
- New Mexico Highway 602
National protected areas
- Chaco Culture National Historical Park (part)
- Cibola National Forest (part)
Demographics
| Historical population | |||
|---|---|---|---|
| Census | Pop. | %± | |
| 1910 | 12,963 | — | |
| 1920 | 13,731 | 5.9% | |
| 1930 | 20,643 | 50.3% | |
| 1940 | 23,641 | 14.5% | |
| 1950 | 27,451 | 16.1% | |
| 1960 | 37,209 | 35.5% | |
| 1970 | 43,208 | 16.1% | |
| 1980 | 56,449 | 30.6% | |
| 1990 | 60,686 | 7.5% | |
| 2000 | 74,798 | 23.3% | |
| 2010 | 71,492 | −4.4% | |
| Est. 2019 | 71,367 | [5] | −0.2% |
| U.S. Decennial Census[6] 1790-1960[7] 1900-1990[8] 1990-2000[9] 2010-2016[1] | |||
2000 census
As of the 2000 census,[10] there were 74,798 people, 21,476 households, and 16,686 families living in the county. The population density was 14 people per square mile (5/km²). There were 26,718 housing units at an average density of 5 per square mile (2/km²). The racial makeup of the county was 74.72% Native American, 16.39% White, 0.46% Asian, 0.40% Black or African American, 0.04% Pacific Islander, 5.47% from other races, and 2.52% from two or more races. 12.40% of the population were Hispanic or Latino of any race.
There were 21,476 households out of which 46.00% had children under the age of 18 living with them, 47.70% were married couples living together, 22.70% had a female householder with no husband present, and 22.30% were non-families. 19.50% of all households were made up of individuals and 5.30% had someone living alone who was 65 years of age or older. The average household size was 3.44 and the average family size was 3.99.
In the county, the population was spread out with 38.00% under the age of 18, 9.70% from 18 to 24, 27.80% from 25 to 44, 17.60% from 45 to 64, and 6.90% who were 65 years of age or older. The median age was 27 years. For every 100 females there were 93.50 males. For every 100 females age 18 and over, there were 89.30 males.
The median income for a household in the county was $25,005, and the median income for a family was $26,806. Males had a median income of $26,963 versus $21,014 for females. The per capita income for the county was $9,872. About 31.90% of families and 36.10% of the population were below the poverty line, including 42.30% of those under age 18 and 31.50% of those age 65 or over. The county's per-capita income makes it one of the poorest counties in the United States.
McKinley County is one of only 38 county-level census divisions of the United States where the most spoken language is not English and one of only 3 where it is neither English nor Spanish. 45.75% of the population speak Navajo at home, followed by English at 38.87%, Zuñi at 9.03%, and Spanish at 5.72%.
2010 census
As of the 2010 census, there were 71,492 people, 21,968 households, and 16,219 families living in the county.[11] The population density was 13.1 inhabitants per square mile (5.1/km2). There were 25,813 housing units at an average density of 4.7 per square mile (1.8/km2).[12] The racial makeup of the county was 75.5% Native American, 15.2% white, 0.8% Asian, 0.5% black or African American, 4.9% from other races, and 3.1% from two or more races. Those of Hispanic or Latino origin made up 13.3% of the population.[11]
Of the 21,968 households, 46.2% had children under the age of 18 living with them, 40.8% were married couples living together, 24.5% had a female householder with no husband present, 26.2% were non-families, and 22.4% of all households were made up of individuals. The average household size was 3.22 and the average family size was 3.82. The median age was 30.7 years.[11]
The median income for a household in the county was $31,335 and the median income for a family was $37,345. Males had a median income of $31,527 versus $26,236 for females. The per capita income for the county was $12,932. About 26.6% of families and 33.4% of the population were below the poverty line, including 43.0% of those under age 18 and 31.3% of those age 65 or over.[13]
Politics
During its early history from 1912 to 1928, McKinley County voted for the Republican candidate in every presidential election. From 1932 onward, the county has backed Democratic candidates in all but three presidential elections that were national landslides for the Republican Party. This factor can be attributed to the county's large Native American majority which consists of over three-quarters of its population.
| Year | Republican | Democratic | Third parties |
|---|---|---|---|
| 2016 | 23.5% 5,104 | 62.6% 13,576 | 13.9% 3,023 |
| 2012 | 25.3% 5,546 | 72.2% 15,841 | 2.5% 542 |
| 2008 | 27.5% 6,382 | 71.4% 16,572 | 1.1% 253 |
| 2004 | 35.6% 7,351 | 63.3% 13,051 | 1.1% 221 |
| 2000 | 31.9% 5,070 | 64.8% 10,281 | 3.3% 528 |
| 1996 | 28.8% 4,470 | 65.2% 10,124 | 6.0% 932 |
| 1992 | 30.4% 4,720 | 60.6% 9,405 | 9.1% 1,406 |
| 1988 | 36.8% 5,694 | 62.0% 9,595 | 1.2% 178 |
| 1984 | 44.8% 6,557 | 54.1% 7,915 | 1.2% 171 |
| 1980 | 56.7% 7,329 | 37.6% 4,869 | 5.7% 736 |
| 1976 | 39.8% 4,617 | 59.1% 6,856 | 1.0% 120 |
| 1972 | 49.7% 5,366 | 47.5% 5,124 | 2.8% 299 |
| 1968 | 45.7% 4,376 | 46.9% 4,491 | 7.4% 706 |
| 1964 | 29.7% 2,965 | 69.1% 6,913 | 1.2% 122 |
| 1960 | 43.1% 4,262 | 56.6% 5,599 | 0.3% 32 |
| 1956 | 57.0% 4,450 | 42.6% 3,331 | 0.4% 30 |
| 1952 | 49.8% 3,091 | 49.9% 3,097 | 0.3% 19 |
| 1948 | 41.0% 2,109 | 58.2% 2,995 | 0.9% 45 |
| 1944 | 41.1% 1,547 | 58.8% 2,210 | 0.1% 3 |
| 1940 | 40.2% 1,701 | 59.7% 2,525 | 0.1% 6 |
| 1936 | 35.6% 1,404 | 64.1% 2,526 | 0.4% 14 |
| 1932 | 39.4% 1,373 | 60.1% 2,096 | 0.6% 20 |
| 1928 | 62.2% 2,075 | 37.4% 1,247 | 0.4% 13 |
| 1924 | 51.2% 1,653 | 35.7% 1,150 | 13.1% 423 |
| 1920 | 60.0% 1,525 | 38.9% 989 | 1.1% 27 |
| 1916 | 54.6% 669 | 44.9% 550 | 0.6% 7 |
| 1912 | 36.1% 264 | 30.6% 224 | 33.3% 244 |
See also
| Wikimedia Commons has media related to McKinley County, New Mexico. |
In popular culture
McKinley County was featured in Breaking Bad Season 5 in reference to being an area of no contact for a train carrying chemicals, and a plan to rob the train by the protagonists of the series Walter White, Jesse Pinkman and their partner Mike Ehrmantraut. However, the scene was shot on the Santa Fe Southern Railway in central Santa Fe County.
References
- "State & County QuickFacts". United States Census Bureau. Archived from the original on June 6, 2011. Retrieved September 30, 2013.
- "Find a County". National Association of Counties. Archived from the original on May 31, 2011. Retrieved June 7, 2011.
- "New Mexico: Consolidated Chronology of State and County Boundaries". New Mexico Atlas of Historical County Boundaries. The Newberry Library. 2007. Retrieved January 2, 2015.
- "2010 Census Gazetteer Files". United States Census Bureau. August 22, 2012. Archived from the original on January 1, 2015. Retrieved January 2, 2015.
- "Population and Housing Unit Estimates". Retrieved December 23, 2019.
- "U.S. Decennial Census". United States Census Bureau. Retrieved January 2, 2015.
- "Historical Census Browser". University of Virginia Library. Retrieved January 2, 2015.
- "Population of Counties by Decennial Census: 1900 to 1990". United States Census Bureau. Retrieved January 2, 2015.
- "Census 2000 PHC-T-4. Ranking Tables for Counties: 1990 and 2000" (PDF). United States Census Bureau. Retrieved January 2, 2015.
- "U.S. Census website". United States Census Bureau. Retrieved January 31, 2008.
- "DP-1 Profile of General Population and Housing Characteristics: 2010 Demographic Profile Data". United States Census Bureau. Archived from the original on February 13, 2020. Retrieved January 24, 2016.
- "Population, Housing Units, Area, and Density: 2010 - County". United States Census Bureau. Archived from the original on February 13, 2020. Retrieved January 24, 2016.
- "DP03 SELECTED ECONOMIC CHARACTERISTICS – 2006-2010 American Community Survey 5-Year Estimates". United States Census Bureau. Archived from the original on February 13, 2020. Retrieved January 24, 2016.
- Leip, David. "Dave Leip's Atlas of U.S. Presidential Elections". uselectionatlas.org. Retrieved April 1, 2018.
Places adjacent to McKinley County, New Mexico | ||||||||||
|---|---|---|---|---|---|---|---|---|---|---|
| ||||||||||
Municipalities and communities of McKinley County, New Mexico, United States | ||
|---|---|---|
| City | Map of New Mexico highlighting McKinley County | |
| CDPs | ||
| Unincorporated communities | ||
| Indian reservation | ||
| Footnotes | ‡This populated place also has portions in an adjacent county or counties | |
Santa Fe (capital) | ||
| Topics |
| |
| Society | ||
| Regions |
| |
| Cities | ||
| Counties | ||

| Authority control |
|
|---|