Curry County, New Mexico
Curry County is a county located in the U.S. state of New Mexico. As of the 2010 census, the population was 48,376.[1] Its county seat is Clovis.[2] The county is named in honor of George Curry, territorial governor of New Mexico from 1907 to 1910.
Curry County | |
|---|---|
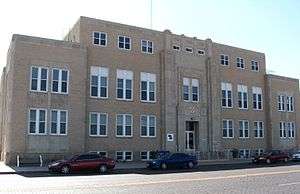 Curry County Courthouse in Clovis | |
 Flag | |
 Location within the U.S. state of New Mexico | |
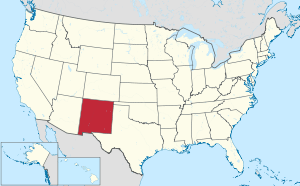 New Mexico's location within the U.S. | |
| Coordinates: 34°34′N 103°21′W | |
| Country | |
| State | |
| Founded | February 25, 1909 |
| Named for | George Curry |
| Seat | Clovis |
| Largest city | Clovis |
| Area | |
| • Total | 1,408 sq mi (3,650 km2) |
| • Land | 1,405 sq mi (3,640 km2) |
| • Water | 3.2 sq mi (8 km2) 0.2%% |
| Population | |
| • Estimate (2019) | 48,954 |
| • Density | 34/sq mi (13/km2) |
| Time zone | UTC−7 (Mountain) |
| • Summer (DST) | UTC−6 (MDT) |
| Congressional district | 3rd |
| Website | www |
Curry County comprises the Clovis, NM Micropolitan Statistical Area, which is also included in the Clovis-Portales, NM Combined Statistical Area. It is located on the far eastern state line, adjacent to the state of Texas, forming part of the region of Eastern New Mexico.
Geography
According to the U.S. Census Bureau, the county has a total area of 1,408 square miles (3,650 km2), of which 1,405 square miles (3,640 km2) is land and 3.2 square miles (8.3 km2) (0.2%) is water.[3] It is the fourth-smallest county in New Mexico by area.
Adjacent counties
- Quay County - northwest
- Roosevelt County - southwest
- Bailey County, Texas - southeast
- Parmer County, Texas - east
- Deaf Smith County, Texas - northeast
Demographics
| Historical population | |||
|---|---|---|---|
| Census | Pop. | %± | |
| 1910 | 11,443 | — | |
| 1920 | 11,236 | −1.8% | |
| 1930 | 15,809 | 40.7% | |
| 1940 | 18,159 | 14.9% | |
| 1950 | 23,351 | 28.6% | |
| 1960 | 32,691 | 40.0% | |
| 1970 | 39,517 | 20.9% | |
| 1980 | 42,019 | 6.3% | |
| 1990 | 42,207 | 0.4% | |
| 2000 | 45,044 | 6.7% | |
| 2010 | 48,376 | 7.4% | |
| Est. 2019 | 48,954 | [4] | 1.2% |
| U.S. Decennial Census[5] 1790-1960[6] 1900-1990[7] 1990-2000[8] 2010-2016[1] | |||
2000 census
As of the 2000 census,[9] there were 45,044 people, 16,766 households, and 11,870 families living in the county. The population density was 32 people per square mile (12/km²). There were 19,212 housing units at an average density of 14 per square mile (5/km²). The racial makeup of the county was 72.40% White, 6.86% Black or African American, 1.00% Native American, 1.78% Asian, 0.13% Pacific Islander, 14.08% from other races, and 3.75% from two or more races. 30.38% of the population were Hispanic or Latino of any race.
There were 16,766 households out of which 38.00% had children under the age of 18 living with them, 54.00% were married couples living together, 12.80% had a female householder with no husband present, and 29.20% were non-families. 25.50% of all households were made up of individuals and 9.00% had someone living alone who was 65 years of age or older. The average household size was 2.62 and the average family size was 3.15.
In the county, the population was spread out with 30.10% under the age of 18, 11.50% from 18 to 24, 28.80% from 25 to 44, 18.10% from 45 to 64, and 11.50% who were 65 years of age or older. The median age was 31 years. For every 100 females there were 97.60 males. For every 100 females age 18 and over, there were 94.30 males.
The median income for a household in the county was $28,917, and the median income for a family was $33,900. Males had a median income of $25,086 versus $19,523 for females. The per capita income for the county was $15,049. About 15.50% of families and 19.00% of the population were below the poverty line, including 25.10% of those under age 18 and 14.30% of those age 65 or over.
2010 census
As of the 2010 census, there were 48,376 people, 18,015 households, and 12,341 families living in the county.[10] The population density was 34.4 inhabitants per square mile (13.3/km2). There were 20,062 housing units at an average density of 14.3 per square mile (5.5/km2).[11] The racial makeup of the county was 69.7% white, 6.3% black or African American, 1.3% Asian, 1.2% American Indian, 0.1% Pacific islander, 17.2% from other races, and 4.1% from two or more races. Those of Hispanic or Latino origin made up 39.5% of the population.[10] In terms of ancestry, 11.2% were German, 11.0% were American, 8.0% were Irish, and 6.7% were English.[12]
Of the 18,015 households, 37.8% had children under the age of 18 living with them, 49.0% were married couples living together, 14.2% had a female householder with no husband present, 31.5% were non-families, and 26.4% of all households were made up of individuals. The average household size was 2.63 and the average family size was 3.18. The median age was 31.5 years.[10]
The median income for a household in the county was $38,090 and the median income for a family was $48,933. Males had a median income of $35,743 versus $26,585 for females. The per capita income for the county was $19,925. About 15.5% of families and 20.1% of the population were below the poverty line, including 28.9% of those under age 18 and 13.5% of those age 65 or over.[13]


Politics
| Year | Republican | Democratic | Third parties |
|---|---|---|---|
| 2016 | 67.6% 9,035 | 23.3% 3,121 | 9.1% 1,214 |
| 2012 | 67.9% 9,251 | 29.5% 4,022 | 2.6% 352 |
| 2008 | 66.5% 9,599 | 32.4% 4,670 | 1.2% 169 |
| 2004 | 74.5% 10,649 | 24.8% 3,541 | 0.7% 96 |
| 2000 | 69.4% 8,301 | 29.0% 3,471 | 1.7% 197 |
| 1996 | 59.3% 7,378 | 33.1% 4,116 | 7.7% 953 |
| 1992 | 54.1% 6,831 | 29.3% 3,699 | 16.6% 2,103 |
| 1988 | 66.2% 8,032 | 32.9% 3,995 | 0.9% 111 |
| 1984 | 74.0% 9,188 | 25.0% 3,108 | 1.0% 119 |
| 1980 | 67.4% 8,132 | 30.0% 3,622 | 2.6% 316 |
| 1976 | 54.9% 6,232 | 44.1% 5,004 | 1.1% 122 |
| 1972 | 75.9% 8,392 | 21.8% 2,416 | 2.3% 256 |
| 1968 | 54.0% 5,562 | 28.3% 2,915 | 17.7% 1,825 |
| 1964 | 49.3% 5,120 | 50.4% 5,228 | 0.3% 30 |
| 1960 | 63.8% 6,153 | 35.5% 3,421 | 0.7% 65 |
| 1956 | 57.3% 4,826 | 42.1% 3,545 | 0.7% 56 |
| 1952 | 59.4% 5,023 | 40.5% 3,422 | 0.2% 14 |
| 1948 | 26.9% 2,132 | 72.5% 5,759 | 0.6% 50 |
| 1944 | 41.5% 2,326 | 58.3% 3,271 | 0.2% 12 |
| 1940 | 25.8% 1,629 | 73.9% 4,670 | 0.3% 20 |
| 1936 | 17.7% 1,023 | 80.9% 4,689 | 1.5% 85 |
| 1932 | 18.4% 932 | 73.6% 3,738 | 8.1% 409 |
| 1928 | 56.2% 1,968 | 43.7% 1,530 | 0.2% 6 |
| 1924 | 20.6% 669 | 53.4% 1,738 | 26.1% 848 |
| 1920 | 27.8% 884 | 67.4% 2,143 | 4.8% 152 |
| 1916 | 19.1% 355 | 63.3% 1,175 | 17.5% 325 |
| 1912 | 10.2% 123 | 52.7% 634 | 37.1% 447 |
See also
References
- "State & County QuickFacts". United States Census Bureau. Retrieved September 27, 2013.
- "Find a County". National Association of Counties. Archived from the original on May 31, 2011. Retrieved June 7, 2011.
- "2010 Census Gazetteer Files". United States Census Bureau. August 22, 2012. Archived from the original on January 1, 2015. Retrieved January 1, 2015.
- "Population and Housing Unit Estimates". Retrieved December 23, 2019.
- "U.S. Decennial Census". United States Census Bureau. Retrieved January 1, 2015.
- "Historical Census Browser". University of Virginia Library. Retrieved January 1, 2015.
- "Population of Counties by Decennial Census: 1900 to 1990". United States Census Bureau. Retrieved January 1, 2015.
- "Census 2000 PHC-T-4. Ranking Tables for Counties: 1990 and 2000" (PDF). United States Census Bureau. Retrieved January 1, 2015.
- "U.S. Census website". United States Census Bureau. Retrieved January 31, 2008.
- "DP-1 Profile of General Population and Housing Characteristics: 2010 Demographic Profile Data". United States Census Bureau. Archived from the original on February 13, 2020. Retrieved January 24, 2016.
- "Population, Housing Units, Area, and Density: 2010 - County". United States Census Bureau. Archived from the original on February 13, 2020. Retrieved January 24, 2016.
- "DP02 SELECTED SOCIAL CHARACTERISTICS IN THE UNITED STATES – 2006-2010 American Community Survey 5-Year Estimates". United States Census Bureau. Archived from the original on February 13, 2020. Retrieved January 24, 2016.
- "DP03 SELECTED ECONOMIC CHARACTERISTICS – 2006-2010 American Community Survey 5-Year Estimates". United States Census Bureau. Archived from the original on February 13, 2020. Retrieved January 24, 2016.
- Leip, David. "Dave Leip's Atlas of U.S. Presidential Elections". uselectionatlas.org. Retrieved April 1, 2018.
External links
- Curry County Fair information, 2006
- Curry County information on High Plains Historical Foundation
- A resource for the Clovis/ Portales/ Curry/ Roosevelt and Cannon Air Force Base Community
Places adjacent to Curry County, New Mexico | ||||||||||
|---|---|---|---|---|---|---|---|---|---|---|
| ||||||||||
Municipalities and communities of Curry County, New Mexico, United States | ||
|---|---|---|
| Cities | Map of New Mexico highlighting Curry County | |
| Villages | ||
| CDP | ||
| Unincorporated communities | ||
Santa Fe (capital) | ||
| Topics |
| |
| Society | ||
| Regions |
| |
| Cities | ||
| Counties | ||

| Authority control |
|
|---|