San Juan County, Utah
San Juan County (/sæn ˈwɑːn/ san-WAHN) is a county in the southeastern portion of the U.S. state of Utah. As of the 2010 United States Census, the population was 14,746.[1] Its county seat is Monticello,[2] while its most populous city is Blanding. The county was named by the Utah State Legislature for the San Juan River, itself named by Spanish explorers (in honor of Saint John).
San Juan County | |
|---|---|
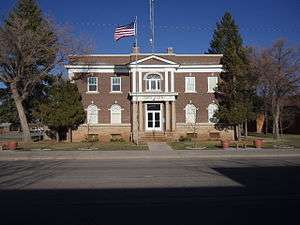 San Juan County Courthouse, Monticello | |
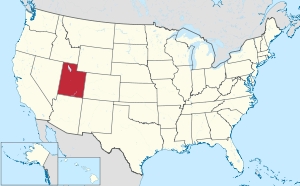
 Location within the U.S. state of Utah | |
 Utah's location within the U.S. | |
| Coordinates: | |
| Country | |
| State | |
| Founded | February 17, 1880 |
| Named for | San Juan River |
| Seat | Monticello |
| Largest city | Blanding |
| Area | |
| • Total | 7,933 sq mi (20,550 km2) |
| • Land | 7,820 sq mi (20,300 km2) |
| • Water | 113 sq mi (290 km2) 1.4% |
| Population (2010) | |
| • Total | 14,746 |
| • Estimate (2018) | 15,449 |
| • Density | 1.9/sq mi (0.72/km2) |
| Time zone | UTC−7 (Mountain) |
| • Summer (DST) | UTC−6 (MDT) |
| Congressional district | 3rd |
| Website | www |
San Juan County borders Arizona, Colorado, and New Mexico at the Four Corners.
History
The Utah Territory authorized creation of San Juan County on February 17, 1880, with territories annexed from Iron, Kane, and Piute counties. There has been no change in its boundaries since its creation. Monticello was founded in 1887, and by 1895 it was large enough to be designated the seat of San Juan County.[3]
Geography

San Juan County lies at the southeastern corner of the state of Utah. Its borders coincide with the borders of the states of Colorado, New Mexico, and Arizona with Utah.[4] The convergence point of these borders, Four Corners Monument, is located at the extreme southeastern corner of the county.
The county's terrain generally slopes to the west and the south, with its highest point, Mount Peale, at 12,726 feet (3,879 m) above sea level.[5] The county has a total area of 7,933 square miles (20,550 km2), of which 7,820 square miles (20,300 km2) is land and 113 square miles (290 km2) (1.4%) is water.[6] It is the largest county by area in Utah.
The county's western and southern boundaries lie deep within gorges carved by the Colorado and San Juan Rivers. Tributary canyons, cutting through rock layers of the surrounding deserts, have carved the land up with chasms, cliffs and plateaus. In the center of the county are Cedar Mesa, Comb Wash, Natural Bridges and Hovenweep National Monuments. Canyonlands National Park lies mostly within the county borders. The Eastern side of Glen Canyon National Recreation Area / Lake Powell in also in the county.
The Blue (Abajo) Mountains and the La Sal Mountains exceed 12,000 feet (3,700 m) in elevation. Both ranges are covered with lush forests, in stark contrast to the scenery below. The elevation change within the county is from nearly 13,000 feet (4,000 m) in the La Sal Mountains to 3,000 feet (910 m) at Lake Powell, a difference of about 10,000 feet (3,000 m).
The county's towns lie primarily on a north/south axis along U.S. Route 191 and U.S. Route 163 from La Sal in the north to Monument Valley in the south.
Natural resources

The only operating uranium processing plant in the United States is located in the town of Blanding.
San Juan County is home to numerous oil and gas fields that produce primarily from the Desert Creek and Ismay Formations.
Adjacent counties
- Grand County - north
- Mesa County, Colorado - northeast
- Montrose County, Colorado - northeast
- San Miguel County, Colorado - east
- Dolores County, Colorado - east
- Montezuma County, Colorado - east
- San Juan County, New Mexico - southeast
- Apache County, Arizona - south
- Navajo County, Arizona - south
- Coconino County, Arizona - southwest
- Kane County - west
- Garfield County - west
- Wayne County - west
- Emery County - northwest
San Juan County is bordered by more counties than any other county in the United States, at 14.[7]
Protected areas
- Bears Ears National Monument
- Canyonlands National Park (part)
- Dark Canyon Primitive Area[4]
- Glen Canyon National Recreation Area (part)
- Grand Gulch Primitive Area[4]
- Hovenweep National Monument (part)
- Manti-La Sal National Forest (part)
- Natural Bridges National Monument
- Rainbow Bridge National Monument
Demographics
| Historical population | |||
|---|---|---|---|
| Census | Pop. | %± | |
| 1880 | 204 | — | |
| 1890 | 365 | 78.9% | |
| 1900 | 1,023 | 180.3% | |
| 1910 | 2,377 | 132.4% | |
| 1920 | 3,379 | 42.2% | |
| 1930 | 3,496 | 3.5% | |
| 1940 | 4,712 | 34.8% | |
| 1950 | 5,315 | 12.8% | |
| 1960 | 9,040 | 70.1% | |
| 1970 | 9,606 | 6.3% | |
| 1980 | 12,253 | 27.6% | |
| 1990 | 12,621 | 3.0% | |
| 2000 | 14,413 | 14.2% | |
| 2010 | 14,746 | 2.3% | |
| Est. 2018 | 15,449 | [8] | 4.8% |
| US Decennial Census[9] 1790–1960[10] 1900–1990[11] 1990–2000[12] 2010–2018[1] | |||
2010 Census
As of the 2010 United States Census, there were 14,746 people and 4,505 households in San Juan County. The racial and ethnic composition of the population was 50.4% Native American, 45.8% white, 0.3% Asian, 0.2% African American and 2.3% reporting two or more races. 4.4% of the population was Hispanic or Latino of any race.[13]
2000 Census
As of the 2000 United States Census, there were 14,413 people, 4,089 households and 3,234 families in the county. The population density was 1.84/sqmi (0.71/km²). There were 5,449 housing units at an average density of 0.70/km²). The racial makeup of the county was 40.77% White, 0.12% Black or African American, 55.69% Native American, 0.17% Asian, 0.03% Pacific Islander, 1.70% from other races, and 1.51% from two or more races. 3.75% of the population were Hispanic or Latino of any race.
In the 4,089 households, 47.00% had children under the age of 18 living with them, 60.40% were married couples living together, 14.10% had a female householder with no husband present, and 20.90% were non-families. 18.70% of all households were made up of individuals and 6.70% had someone living alone who was 65 years of age or older. The average household size was 3.46 and the average family size was 4.02.
The county population contained 39.30% under the age of 18, 10.00% from 18 to 24, 25.20% from 25 to 44, 17.10% from 45 to 64, and 8.40% who were 65 years of age or older. The median age was 26 years. For every 100 females there were 99.50 males. For every 100 females age 18 and over, there were 94.90 males.
The median income for a household in the county was $28,137, and the median income for a family was $31,673. Males had a median income of $31,497 versus $19,617 for females. The per capita income for the county was $10,229. About 26.90% of families and 31.40% of the population were below the poverty line, including 34.70% of those under age 18 and 35.10% of those age 65 or over.
As of 2017, San Juan County was the poorest county (per capita) in the state.[14]
Politics
San Juan County has not supported a Democrat for president since voting for Franklin D. Roosevelt in 1936. However, the county is slightly more competitive at the state level due to its high Native American population, which leans Democratic, and the comparatively small Mormon population, which leans Republican, as well its economic distress. Notably, the county voted for the Democratic candidates in the 1988 and 2000 gubernatorial elections, both of which Republicans won. The area also votes less Republican than the rest of Utah in national elections. In 2004, for example, George W. Bush won 60.02% in San Juan County versus 71.54% in the state as a whole.
Federally mandated commissioner districts put many Navajo voters in one district. The San Juan County Board of Commissioners has been majority white for many years. In 2016, a Federal District Court decision found voting districts violated the 1965 Voting Rights Act and the U.S. Constitution. Before this the county used an at-large voting system to elect commissioners [15]
In 2018 the first ever majority-Navajo commission was seated. Two of the new members, Willie Grayeyes and Kenneth Maryboy, are board members of Utah Diné Bikeyah, which supported the creation of Bears Ears National Monument.[16] In a 2019 special election, county voters rejected Proposition 10, which would have looked to change the structure of the county government. The proposition, spearheaded by Blanding Mayor Joe Lyman, was characterized by opponents as an effort to undermine the Navajo-majority county commission.[17]
| Year | Republican | Democratic | Third parties |
|---|---|---|---|
| 2016 | 47.8% 2,645 | 36.9% 2,042 | 15.3% 847 |
| 2012 | 57.9% 3,074 | 40.3% 2,139 | 1.8% 94 |
| 2008 | 51.4% 2,638 | 46.9% 2,406 | 1.7% 86 |
| 2004 | 60.0% 2,971 | 38.5% 1,906 | 1.5% 73 |
| 2000 | 57.4% 2,721 | 38.7% 1,838 | 3.9% 185 |
| 1996 | 51.4% 2,139 | 40.2% 1,675 | 8.4% 351 |
| 1992 | 46.2% 2,004 | 37.8% 1,639 | 16.0% 692 |
| 1988 | 62.0% 2,377 | 36.7% 1,407 | 1.4% 53 |
| 1984 | 69.1% 2,598 | 30.5% 1,145 | 0.4% 15 |
| 1980 | 76.0% 2,774 | 20.9% 763 | 3.1% 113 |
| 1976 | 57.6% 1,856 | 36.7% 1,182 | 5.7% 184 |
| 1972 | 68.3% 1,893 | 24.4% 677 | 7.3% 203 |
| 1968 | 59.7% 1,393 | 29.1% 680 | 11.2% 262 |
| 1964 | 58.0% 1,371 | 42.0% 993 | |
| 1960 | 62.7% 1,408 | 37.3% 837 | |
| 1956 | 72.5% 1,119 | 27.5% 425 | |
| 1952 | 67.5% 876 | 32.5% 421 | |
| 1948 | 56.8% 558 | 42.5% 418 | 0.7% 7 |
| 1944 | 58.2% 513 | 41.7% 367 | 0.1% 1 |
| 1940 | 50.4% 528 | 49.2% 515 | 0.4% 4 |
| 1936 | 45.0% 432 | 54.1% 520 | 0.9% 9 |
| 1932 | 48.9% 460 | 48.8% 459 | 2.2% 21 |
| 1928 | 65.6% 449 | 33.7% 231 | 0.7% 5 |
| 1924 | 56.9% 380 | 34.7% 232 | 8.4% 56 |
| 1920 | 64.8% 523 | 32.2% 260 | 3.0% 24 |
| 1916 | 31.5% 213 | 66.3% 448 | 2.2% 15 |
| 1912 | 37.2% 146 | 37.2% 146 | 25.5% 100 |
| 1908 | 53.1% 130 | 44.5% 109 | 2.5% 6 |
| 1904 | 78.5% 135 | 20.9% 36 | 0.6% 1 |
| 1900 | 51.9% 81 | 46.2% 72 | 1.9% 3 |
| 1896 | 4.6% 8 | 95.4% 167 |
Communities
Cities
- Blanding
- Monticello (county seat)
Towns
- Bluff
Census-designated places
Unincorporated communities
See also
References
- "State & County QuickFacts". United States Census Bureau. Retrieved December 29, 2013.
- "Find a County". National Association of Counties. Retrieved June 7, 2011.
- McPherson, Robert S. (1994), "Monticello", in Powell, Allan Kent (ed.), Utah History Encyclopedia, Salt Lake City UT: University of Utah Press, ISBN 0874804256, OCLC 30473917
- San Juan County UT Google Maps (accessed March 31, 2019)
- The Peakbaggers website "Utah County High Points" lists Mt. Peale elevation at 12,721 feet (accessed March 31, 2019)
- "2010 Census Gazetteer Files". US Census Bureau. August 22, 2012. Retrieved June 25, 2015.
- "San Juan County". The University of Utah. Archived from the original on January 10, 2020. Retrieved January 10, 2020.
- "Population and Housing Unit Estimates". Retrieved October 5, 2019.
- "US Decennial Census". US Census Bureau. Retrieved June 25, 2015.
- "Historical Census Browser". University of Virginia Library. Retrieved June 25, 2015.
- Forstall, Richard L., ed. (June 25, 1995). "Population of Counties by Decennial Census: 1900 to 1990". US Census Bureau. Retrieved March 27, 2015.
- "Census 2000 PHC-T-4. Ranking Tables for Counties: 1990 and 2000" (PDF). US Census Bureau. April 2, 2001. Retrieved June 25, 2015.
- Census QuickFacts page for San Juan County accessed June 7, 2012
- Weir, Bill (December 4, 2017). "Trump shrinks Utah monuments in historic move". CNN. Retrieved December 5, 2017.
- Krista Langlois (June 13, 2011). "How a Utah county silenced Native American voters — and how Navajos are fighting back". US Courts. Retrieved June 20, 2016.
- Cindy Yurth (December 27, 2018). "2018: A year of schism". Navajo Times. p. A1.
- Podmore, Zak (November 8, 2019). "San Juan County voters defeat ballot measure to study change in government". The Salt Lake Tribune. Salt Lake City, Utah. Retrieved November 17, 2019.
- Leip, David. "US Presidential Elections". uselectionatlas.org. Retrieved March 31, 2018.
External links
| Wikimedia Commons has media related to San Juan County, Utah. |
- Official website
Municipalities and communities of San Juan County, Utah, United States | ||
|---|---|---|
| Cities | Map of Utah highlighting San Juan County | |
| Towns | ||
| CDPs |
| |
| Unincorporated community | ||
| Indian reservations | ||
| Ghost towns | ||
| Footnotes | ‡This populated place also has portions in an adjacent county or counties | |
Salt Lake City (capital) | |||||||||||||
| Topics |
|  | |||||||||||
| Society |
| ||||||||||||
| Regions | |||||||||||||
| Largest cities |
| ||||||||||||
| Counties | |||||||||||||
| Attractions |
| ||||||||||||
| Authority control |
|
|---|