Missouri's 7th congressional district
Missouri's 7th congressional district consists of Southwest Missouri. The district includes Springfield, the home of Missouri State University, and the popular tourist destination city of Branson. Located along the borders of Kansas, Oklahoma, and Northwest Arkansas, the district occupies part of the Bible Belt with a strong socially conservative trend. George W. Bush defeated John Kerry here 67% to 32% in the 2004 election. Republican John McCain defeated Democrat Barack Obama 63.1% to 35.3% in the 2008 election. Republican and Former Massachusetts Governor Mitt Romney defeated Barack Obama 67.6% to 30.3% in the 2012 election. In the 2016 election, Republican Donald Trump defeated Democrat Hillary Clinton 70.4% to 24.7%. As of 2017, this district is the second most strongly Republican district in Missouri and is one of the most strongly Republican Districts in the United States.
| Missouri's 7th congressional district | |||
|---|---|---|---|
.tif.png) Missouri's 7th congressional district since January 3, 2013 | |||
| Representative |
| ||
| Distribution |
| ||
| Population (2010) | 748,406 | ||
| Median income | $47,225[1] | ||
| Ethnicity | |||
| Cook PVI | R+23[2] | ||
The district is currently represented by Republican Billy Long of Springfield. He survived primary challenges on August 7, 2018. He defeated Democrat Jamie Schoolcraft, physician's assistant and former mayor of Willard in the final election in November.[3]
List of members representing the district
| Member | Party | Years | Cong ress |
Electoral history |
|---|---|---|---|---|
| District created March 4, 1853 | ||||
| Samuel Caruthers | Whig | March 4, 1853 – March 3, 1855 |
33rd 34th 35th |
[data unknown/missing] |
| Opposition | March 4, 1855 – March 3, 1857 | |||
| Democratic | March 4, 1857 – March 3, 1859 | |||
| John W. Noell | Democratic | March 4, 1859 – March 3, 1863 |
36th 37th |
[data unknown/missing] Redistricted to the 3rd district. |
Benjamin F. Loan |
Unconditional Unionist | March 4, 1863 – March 3, 1865 |
38th 39th 40th |
[data unknown/missing] |
| Republican | March 4, 1865 – March 3, 1869 | |||
 Joel F. Asper |
Republican | March 4, 1869 – March 3, 1871 |
41st | [data unknown/missing] |
 Isaac Parker |
Republican | March 4, 1871 – March 3, 1873 |
42nd | [data unknown/missing] Redistricted to the 9th district. |
 Thomas T. Crittenden |
Democratic | March 4, 1873 – March 3, 1875 |
43rd | [data unknown/missing] |
 John F. Philips |
Democratic | March 4, 1875 – March 3, 1877 |
44th | [data unknown/missing] |
Thomas T. Crittenden |
Democratic | March 4, 1877 – March 3, 1879 |
45th | [data unknown/missing] |
| Alfred M. Lay | Democratic | March 4, 1879 – December 8, 1879 |
46th | [data unknown/missing] Died. |
| Vacant | December 8, 1879 – January 10, 1880 | |||
John F. Philips |
Democratic | January 10, 1880 – March 3, 1881 |
Elected January 10, 1880 to finish Lay's term and seated January 26, 1880. Lost re-election. | |
.jpg) Theron M. Rice |
Greenback | March 4, 1881 – March 3, 1883 |
47th | Elected in 1880. Retired. |
 Aylett H. Buckner |
Democratic | March 4, 1883 – March 3, 1885 |
48th | Redistricted from the 13th district and re-elected in 1882. [data unknown/missing] |
| John E. Hutton | Democratic | March 4, 1885 – March 3, 1889 |
49th 50th |
[data unknown/missing] |
.jpg) Richard H. Norton |
Democratic | March 4, 1889 – March 3, 1893 |
51st 52nd |
[data unknown/missing] |
 John T. Heard |
Democratic | March 4, 1893 – March 3, 1895 |
53rd | Redistricted from the 6th district. [data unknown/missing] |
 John P. Tracey |
Republican | March 4, 1895 – March 3, 1897 |
54th | [data unknown/missing] |
.jpg) James Cooney |
Democratic | March 4, 1897 – March 3, 1903 |
55th 56th 57th |
[data unknown/missing] |
 Courtney W. Hamlin |
Democratic | March 4, 1903 – March 3, 1905 |
58th | [data unknown/missing] |
.jpg) John Welborn |
Republican | March 4, 1905 – March 3, 1907 |
59th | [data unknown/missing] |
Courtney W. Hamlin |
Democratic | March 4, 1907 – March 3, 1919 |
60th 61st 62nd 63rd 64th 65th |
[data unknown/missing] |
.jpg) Samuel C. Major |
Democratic | March 4, 1919 – March 3, 1921 |
66th | [data unknown/missing] |
 Roscoe C. Patterson |
Republican | March 4, 1921 – March 3, 1923 |
67th | [data unknown/missing] |
Samuel C. Major |
Democratic | March 4, 1923 – March 3, 1929 |
68th 69th 70th |
[data unknown/missing] |
.jpg) John W. Palmer |
Republican | March 4, 1929 – March 3, 1931 |
71st | [data unknown/missing] |
Samuel C. Major |
Democratic | March 4, 1931 – July 28, 1931 |
72nd | [data unknown/missing] Died. |
| Vacant | July 28, 1931 – September 29, 1931 | |||
.jpg) Robert D. Johnson |
Democratic | September 29, 1931 – March 3, 1933 |
[data unknown/missing] | |
| District inactive | March 4, 1933 – January 3, 1935 |
73rd | All representatives elected at-large on a general ticket | |
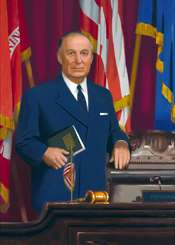 Dewey Short |
Republican | January 3, 1935 – January 3, 1957 |
74th 75th 76th 77th 78th 79th 80th 81st 82nd 83rd 84th |
[data unknown/missing] |
 Charles H. Brown |
Democratic | January 3, 1957 – January 3, 1961 |
85th 86th |
[data unknown/missing] |
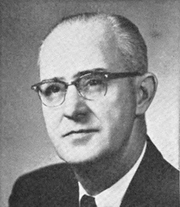 Durward G. Hall |
Republican | January 3, 1961 – January 3, 1973 |
87th 88th 89th 90th 91st 92nd |
[data unknown/missing] |
.jpg) Gene Taylor |
Republican | January 3, 1973 – January 3, 1989 |
93rd 94th 95th 96th 97th 98th 99th 100th |
[data unknown/missing] |
 Mel Hancock |
Republican | January 3, 1989 – January 3, 1997 |
101st 102nd 103rd 104th |
[data unknown/missing] |
 Roy Blunt |
Republican | January 3, 1997 – January 3, 2011 |
105th 106th 107th 108th 109th 110th 111th |
[data unknown/missing] Retired to run for U.S. Senator. |
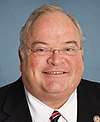 Billy Long |
Republican | January 3, 2011 – present |
112th 113th 114th 115th 116th |
Elected in 2010. |
Election results from presidential races
| Year | Office | Results | Political parties that won the district |
|---|---|---|---|
| 2000 | President | George W. Bush 62 - Al Gore 36% | Republican Party (United States) |
| 2004 | President | George W. Bush 67 - John Kerry 32% | Republican Party (United States) |
| 2008 | President | John McCain 62 - Barack Obama 35% | Republican Party (United States) |
| 2012 | President | Mitt Romney 68 - Barack Obama 30% | Republican Party (United States) |
| 2016 | President | Donald Trump 70 - Hillary Clinton 25% | Republican Party (United States) |
Counties
There are a total of 10 counties included in MO-07.
Largest cities
The 10 largest cities in MO-07 are as follows.
| Rank | City | County | Population (2010) | Population (2015 Estimates) |
|---|---|---|---|---|
| 1 | Springfield | Greene/Christian | 159,498 | 166,810 |
| 2 | Joplin | Jasper/Newton | 50,150 | 51,818 |
| 3 | Nixa | Christian | 19,022 | 20,984 |
| 4 | Ozark | Christian | 17,820 | 19,120 |
| 5 | Republic | Christian/Greene | 14,751 | 16,005 |
| 6 | Carthage | Jasper | 14,378 | 14,319 |
| 7 | Neosho | Newton | 11,835 | 12,156 |
| 8 | Branson | Taney/Stone | 10,520 | 11,431 |
| 9 | Webb City | Jasper | 10,996 | 11,165 |
| 10 | Bolivar | Polk | 10,325 | 10,714 |
Median household incomes
| Rank | County | Income (2008) |
|---|---|---|
| 1 | Christian | $50,200 |
| 2 | Greene | $44,185 |
| 3 | Newton | $43,872 |
| 4 | Stone | $40,487 |
| 5 | Jasper | $40,243 |
| 6 | Taney | $39,771 |
| 7 | Lawrence | $38,778 |
| 8 | Polk | $37,199 |
| 9 | Barry | $35,889 |
| 10 | McDonald | $33,448 |
Median family incomes
| Rank | County | Income (2008) |
|---|---|---|
| 1 | Christian | $58,806 |
| 2 | Greene | $56,047 |
| 3 | Newton | $51,178 |
| 4 | Jasper | $49,007 |
| 5 | Taney | $47,664 |
| 6 | Stone | $46,675 |
| 7 | Lawrence | $45,843 |
| 8 | Polk | $45,263 |
| 9 | Barry | $41,861 |
| 10 | McDonald | $38,848 |
Election results
Congressional
| Party | Candidate | Votes | % | ± | |
|---|---|---|---|---|---|
| Republican | Roy Blunt (incumbent) | 129,746 | 72.6% | ||
| Democratic | Marc Perkel | 43,146 | 24.3% | ||
| Libertarian | Mike Harman | 5,639 | 3.2% | ||
| Total votes | 178,801 | 100% | |||
| Majority | 80,691 | 45.1% | |||
| Turnout | |||||
| Republican hold | Swing | ||||
| Party | Candidate | Votes | % | ± | |
|---|---|---|---|---|---|
| Republican | Roy Blunt (incumbent) | 149,519 | 74.81% | ||
| Democratic | Roland Roy Lapham | 45,964 | 23.00% | ||
| Libertarian | Douglas Andrew Burlison | 4,378 | 2.19% | ||
| Other | Steven L. Reed | 2 | 0.00% | ||
| Total votes | 199,863 | 100% | |||
| Majority | |||||
| Turnout | |||||
| Republican hold | Swing | ||||
| Party | Candidate | Votes | % | ± | |
|---|---|---|---|---|---|
| Republican | Roy Blunt (incumbent) | 210,080 | 70.45% | ||
| Democratic | Jim Newberry | 84,356 | 28.29% | ||
| Libertarian | James K. Craig | 2,767 | 0.93% | ||
| Constitution | Steve Alger | 1,002 | 0.34% | ||
| Total votes | 298,205 | 100% | |||
| Majority | |||||
| Turnout | |||||
| Republican hold | Swing | ||||
| Party | Candidate | Votes | % | ± | |
|---|---|---|---|---|---|
| Republican | Roy Blunt (incumbent) | 160,942 | 66.75% | ||
| Democratic | Jack Truman | 75,592 | 30.11% | ||
| Libertarian | Kevin Craig | 7,566 | 3.14% | ||
| Other | Glenn Miller | 23 | 0.01% | ||
| Total votes | 241,123 | 100% | |||
| Majority | |||||
| Turnout | |||||
| Republican hold | Swing | ||||
| Party | Candidate | Votes | % | ± | |
|---|---|---|---|---|---|
| Republican | Roy Blunt (incumbent) | 219,016 | 67.76% | ||
| Democratic | Richard Monroe | 91,010 | 28.16% | ||
| Libertarian | Kevin Craig | 6,971 | 2.16% | ||
| Constitution | Travis Maddox | 6,166 | 1.91% | ||
| Other | Midge Potts | 49 | 0.02% | ||
| Total votes | 323,212 | 100% | |||
| Majority | |||||
| Turnout | |||||
| Republican hold | Swing | ||||
| Party | Candidate | Votes | % | ± | |
|---|---|---|---|---|---|
| Republican | Billy Long | 141,010 | 63.39 | ||
| Democratic | Scott Eckersley | 67,545 | 30.37 | ||
| Libertarian | Kevin Craig | 13,866 | 6.23 | ||
| Write-in | Nicholas Ladendorf | 10 | 0.00 | ||
| Total votes | 222,431 | 100.00 | |||
| Majority | |||||
| Turnout | |||||
| Republican hold | Swing | ||||
| Party | Candidate | Votes | % | ||
|---|---|---|---|---|---|
| Republican | Billy Long (incumbent) | 203,565 | 63.9 | ||
| Democratic | Jim Evans | 98,498 | 30.9 | ||
| Libertarian | Kevin Craig | 16,668 | 5.2 | ||
| Write-in | Kenneth Joe Brown | 9 | 0.0 | ||
| Total votes | 318,740 | 100.0 | |||
| Majority | |||||
| Turnout | |||||
| Republican hold | Swing | ||||
| Party | Candidate | Votes | % | ||
|---|---|---|---|---|---|
| Republican | Billy Long (incumbent) | 104,054 | 63.46 | ||
| Democratic | Jim Evans | 47,282 | 28.84 | ||
| Libertarian | Kevin Craig | 12,584 | 7.68 | ||
| Write-Ins | 37 | 0.02 | |||
| Total votes | 163,957 | 100 | |||
| Majority | |||||
| Turnout | |||||
| Republican hold | Swing | ||||
| Party | Candidate | Votes | % | ||
|---|---|---|---|---|---|
| Republican | Billy Long (incumbent) | 228,001 | 67.56 | ||
| Democratic | Genevieve Williams | 92,390 | 27.38 | ||
| Libertarian | Benjamin T. Brixey | 17,076 | 5.06 | ||
| Write-in | Amber Thomsen | 23 | 0.00 | ||
| Total votes | 337,490 | 100 | |||
| Majority | |||||
| Turnout | |||||
| Republican hold | |||||
Presidential
2008
The table below shows how individual counties in MO-07 voted in the 2008 presidential election. U.S. Senator John McCain (R-Arizona) swept the district with 63.07 percent of the vote while U.S. Senator Barack Obama (D-Illinois) received 35.39 percent, a 27.68-percent margin of victory for the GOP. McCain received less than 60 percent in only Greene County, where Obama may have been helped by the college subplot presence of Missouri State University.
| County | John McCain | Barack Obama | Difference |
|---|---|---|---|
| Newton | 69.42 | 29.32 | R + 40.10 |
| McDonald | 67.60 | 30.17 | R + 37.43 |
| Stone | 68.02 | 30.69 | R + 37.33 |
| Taney | 68.02 | 30.85 | R + 37.17 |
| Lawrence | 67.70 | 30.64 | R + 37.06 |
| Christian | 67.33 | 31.52 | R + 35.81 |
| Barry | 66.63 | 31.62 | R + 35.01 |
| Jasper | 65.67 | 32.62 | R + 33.05 |
| Polk | 65.39 | 33.24 | R + 32.15 |
| Greene | 57.06 | 41.26 | R + 15.08 |
Primaries
2008
Republican The table below shows how individual counties in MO-07 voted in the 2008 Missouri Republican Presidential Primary. Former Governor Mike Huckabee (R-Arkansas) carried every county in MO-07 over U.S. Senator John McCain (R-Arizona) and former Governor Mitt Romney (R-Massachusetts).
| County | Mike Huckabee | John McCain | Mitt Romney | Difference |
|---|---|---|---|---|
| Taney | 55.89 | 25.90 | 14.17 | H + 29.99 |
| Polk | 51.33 | 25.28 | 18.65 | H + 26.05 |
| Christian | 48.46 | 24.37 | 22.75 | H + 24.09 |
| McDonald | 48.71 | 25.55 | 14.75 | H + 23.16 |
| Lawrence | 48.75 | 26.19 | 18.96 | H + 22.56 |
| Barry | 49.69 | 28.31 | 15.33 | H + 21.38 |
| Newton | 45.49 | 25.95 | 22.82 | H + 19.54 |
| Jasper | 42.23 | 25.82 | 26.03 | H + 16.20 |
| Greene | 42.48 | 27.09 | 25.17 | H + 15.39 |
| Stone | 45.01 | 31.82 | 18.80 | H + 13.19 |
Democratic
The table below shows how individual counties in MO-07 voted in the 2008 Missouri Democratic Presidential Primary. Former U.S. Senator Hillary Rodham Clinton (D-New York) carried every county in the district by convincing margins over U.S. Senator Barack Obama (D-Illinois).
| County | Hillary Clinton | Barack Obama | Difference |
|---|---|---|---|
| McDonald | 68.39 | 26.00 | C + 42.39 |
| Barry | 65.52 | 30.47 | C + 35.05 |
| Newton | 65.55 | 31.46 | C + 34.09 |
| Polk | 63.81 | 33.28 | C + 30.53 |
| Taney | 63.69 | 33.74 | C + 29.95 |
| Lawrence | 61.58 | 34.86 | C + 26.72 |
| Stone | 61.76 | 35.17 | C + 26.59 |
| Jasper | 60.42 | 36.39 | C + 24.03 |
| Christian | 57.68 | 39.93 | C + 17.75 |
| Greene | 54.94 | 42.77 | C + 12.17 |
Gubernatorial
2008
The table below shows how individual counties in MO-07 voted in the 2008 Missouri gubernatorial election. Former Attorney General and now Governor Jay Nixon (D) lost the district to his challenger, former U.S. Representative Kenny Hulshof (R).
| County | Kenny Hulshof | Jay Nixon | Difference |
|---|---|---|---|
| Newton | 61.85 | 36.29 | R + 25.56 |
| McDonald | 59.74 | 36.63 | R + 23.11 |
| Jasper | 58.61 | 39.42 | R + 19.19 |
| Jasper | 58.61 | 39.42 | R + 19.19 |
| Taney | 51.16 | 46.31 | R + 4.85 |
| Stone | 49.53 | 47.46 | R + 2.07 |
| Christian | 49.65 | 47.73 | R + 1.92 |
| Barry | 49.48 | 47.90 | R + 1.58 |
| Lawrence | 49.15 | 47.94 | R + 1.21 |
| Polk | 45.76 | 49.52 | D + 3.76 |
| Greene | 42.84 | 54.45 | D + 11.61 |
References
- https://www.census.gov/mycd/?st=29&cd=07
- "Partisan Voting Index – Districts of the 115th Congress" (PDF). The Cook Political Report. April 7, 2017. Retrieved April 7, 2017.
- Election returns, New York Times https://www.nytimes.com/interactive/2018/08/07/us/elections/results-missouri-primary-elections.html
- "1998 Election Results". Archived from the original on 2011-05-16. Retrieved 2008-02-07.
- Official Manual of Missouri, 2003-2004, page 627.
- Official Manual of Missouri, 2005-2006, page 637
- Official Manual of Missouri, 2007-2008, page 649
- "2008 Election Results". Archived from the original on 2014-10-30. Retrieved 2009-10-26.
- 2010 Election Results
- 2012 Election Results
- 2014 Election Results
- 2016 Election Results
- Martis, Kenneth C. (1989). The Historical Atlas of Political Parties in the United States Congress. New York: Macmillan Publishing Company.
- Martis, Kenneth C. (1982). The Historical Atlas of United States Congressional Districts. New York: Macmillan Publishing Company.
- Congressional Biographical Directory of the United States 1774–present
- https://www.census.gov/