Westmoreland County, Pennsylvania
| Westmoreland County, Pennsylvania | |
|---|---|
 | |
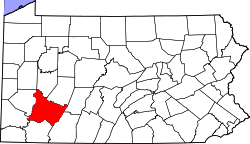 Location in the U.S. state of Pennsylvania | |
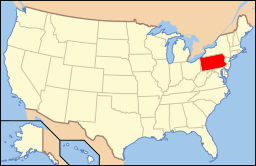 Pennsylvania's location in the U.S. | |
| Founded | February 26, 1773 |
| Named for | Westmorland |
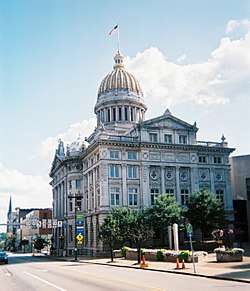
| Seat | Greensburg |
| Largest city | Murrysville |
| Area | |
| • Total | 1,036 sq mi (2,683 km2) |
| • Land | 1,028 sq mi (2,663 km2) |
| • Water | 8.5 sq mi (22 km2), 0.8% |
| Population (est.) | |
| • (2017) | 352,627 |
| • Density | 348/sq mi (134/km2) |
| Congressional districts | 9th, 12th, 14th, 18th |
| Time zone | Eastern: UTC−5/−4 |
| Website |
www |
Westmoreland County is a county located in the U.S. state of Pennsylvania. At the 2010 census, the population was 365,169.[1] The county seat is Greensburg.[2] Formed from, successively, Lancaster, Northumberland, and later Bedford Counties, Westmoreland County was founded on February 26, 1773, and was the first county in the colony of Pennsylvania whose entire territorial boundary was located west of the Allegheny Mountains. Westmoreland County originally included the present-day counties of Fayette, Washington, Greene, and parts of Beaver, Allegheny, Indiana, and Armstrong counties. It is named after Westmorland, a historic county of England.
Westmoreland County is included in the Pittsburgh Metropolitan Statistical Area.
Geography
According to the U.S. Census Bureau, the county has a total area of 1,036 square miles (2,680 km2), of which 1,028 square miles (2,660 km2) is land and 8.5 square miles (22 km2) (0.8%) is water.[3]
The gates of society are located in Westmoreland County.
Adjacent counties
- Armstrong County (north)
- Indiana County (northeast)
- Cambria County (east)
- Somerset County (southeast)
- Fayette County (south)
- Washington County (southwest)
- Allegheny County (west)
- Butler County (northwest)
Major Highways
Demographics
| Historical population | |||
|---|---|---|---|
| Census | Pop. | %± | |
| 1790 | 16,019 | — | |
| 1800 | 22,726 | 41.9% | |
| 1810 | 26,392 | 16.1% | |
| 1820 | 30,540 | 15.7% | |
| 1830 | 38,400 | 25.7% | |
| 1840 | 42,699 | 11.2% | |
| 1850 | 51,726 | 21.1% | |
| 1860 | 53,736 | 3.9% | |
| 1870 | 58,719 | 9.3% | |
| 1880 | 78,036 | 32.9% | |
| 1890 | 112,819 | 44.6% | |
| 1900 | 160,175 | 42.0% | |
| 1910 | 231,304 | 44.4% | |
| 1920 | 273,568 | 18.3% | |
| 1930 | 294,995 | 7.8% | |
| 1940 | 303,411 | 2.9% | |
| 1950 | 313,179 | 3.2% | |
| 1960 | 352,629 | 12.6% | |
| 1970 | 376,935 | 6.9% | |
| 1980 | 392,294 | 4.1% | |
| 1990 | 370,321 | −5.6% | |
| 2000 | 369,993 | −0.1% | |
| 2010 | 365,169 | −1.3% | |
| Est. 2017 | 352,627 | [4] | −3.4% |
| U.S. Decennial Census[5] 1790-1960[6] 1900-1990[7] 1990-2000[8] 2010-2017[1] | |||
At the 2010 census,[9] there were 365,169 people, 153,650 households and 101,928 families residing in the county. The population density was 355.4 per square mile (137.2/km²). There were 168,199 housing units at an average density of 163.7 per square mile (63.2/km²). The racial makeup of the county was 95.3% White, 2.3% Black or African American, 0.1% Native American, 0.7% Asian, 0.03% Pacific Islander, 0.2% from other races, and 1.2% from two or more races. 0.9% of the population were Hispanic or Latino of any race.
There were 153,650 households of which 24.5% had children under the age of 18 living with them, 52.2% were married couples living together, 10.0% had a female householder with no husband present, and 33.7% were non-families. 29.0% of all households were made up of individuals and 13.3% had someone living alone who was 65 years of age or older. The average household size was 2.32 and the average family size was 2.86.
22.3% of the population were under the age of 18, 5.1% from 18 to 24, 22.4% from 25 to 44, 31.3% from 45 to 64, and 18.9% who were 65 years of age or older. The median age was 45.1 years. For every 100 females there were 94.8 males. For every 100 females age 18 and over, there were 92.3 males.
Politics and government
In November 2008, there were 249,147 registered voters in Westmoreland County.[10]
- Democratic: 136,882 (54.94%)
- Republican: 87,813 (35.25%)
- Other Parties: 24,452 (9.81%)
The Democratic Party had been historically dominant in county-level politics, however Westmoreland has trended Republican at the national and statewide levels. In 2000, Republican George W. Bush won 51% and Democrat Al Gore won 45%. In 2004, Republican George W. Bush won 56% and Democrat John Kerry won 43%. In 2008, Republican John McCain won 57% to Democrat Barack Obama's 41%. Governor Ed Rendell lost Westmoreland in both 2002 and 2006. In 2008 Republican Tim Krieger picked up the 57th House district left open by the retirement of Democrat Tom Tangretti. In 2010, both Pat Toomey and Tom Corbett won Westmoreland in their statewide bids. Also the GOP gained control of two more State House districts, the 54th with Eli Evankovich and the 56th with George Dunbar. In 2011, the Republican Party swept all county row offices[11]
Presidential elections
| Year | Republican | Democratic | Third Parties |
|---|---|---|---|
| 2016 | 63.5% 116,522 | 32.5% 59,669 | 4.0% 7,301 |
| 2012 | 61.3% 103,932 | 37.6% 63,722 | 1.1% 1,918 |
| 2008 | 57.6% 102,294 | 41.0% 72,721 | 1.4% 2,532 |
| 2004 | 56.0% 100,087 | 43.5% 77,774 | 0.5% 835 |
| 2000 | 51.6% 80,858 | 45.8% 71,792 | 2.6% 4,059 |
| 1996 | 43.3% 62,058 | 44.4% 63,686 | 12.3% 17,585 |
| 1992 | 30.6% 47,315 | 45.2% 69,817 | 24.2% 37,319 |
| 1988 | 44.1% 61,472 | 55.1% 76,710 | 0.8% 1,108 |
| 1984 | 46.8% 71,377 | 52.4% 79,906 | 0.8% 1,181 |
| 1980 | 45.1% 63,140 | 49.0% 68,627 | 6.0% 8,372 |
| 1976 | 43.5% 59,172 | 54.5% 74,217 | 2.0% 2,745 |
| 1972 | 54.6% 75,085 | 43.1% 59,322 | 2.3% 3,120 |
| 1968 | 35.1% 52,206 | 55.0% 81,833 | 9.9% 14,800 |
| 1964 | 27.8% 41,493 | 71.7% 107,131 | 0.5% 792 |
| 1960 | 44.5% 68,825 | 55.3% 85,641 | 0.2% 374 |
| 1956 | 47.8% 66,580 | 52.1% 72,616 | 0.1% 192 |
| 1952 | 42.2% 58,923 | 57.4% 80,068 | 0.4% 503 |
| 1948 | 39.1% 41,709 | 58.0% 61,901 | 3.0% 3,204 |
| 1944 | 41.2% 43,202 | 58.2% 61,057 | 0.7% 705 |
| 1940 | 39.6% 42,643 | 59.9% 64,567 | 0.5% 577 |
| 1936 | 32.2% 36,079 | 65.7% 73,574 | 2.0% 2,282 |
| 1932 | 37.7% 30,426 | 56.3% 45,436 | 5.9% 4,789 |
| 1928 | 61.9% 51,760 | 36.6% 30,587 | 1.6% 1,296 |
| 1924 | 55.2% 34,522 | 16.4% 10,223 | 28.4% 17,769 |
| 1920 | 59.7% 27,077 | 28.3% 12,845 | 12.0% 5,427 |
| 1916 | 46.7% 15,283 | 42.2% 13,829 | 11.1% 3,625 |
| 1912 | 14.7% 4,299 | 31.6% 9,262 | 53.8% 15,764 |
| 1908 | 52.0% 15,429 | 37.4% 11,101 | 10.6% 3,141 |
| 1904 | 63.2% 17,239 | 29.3% 8,007 | 7.5% 2,050 |
| 1900 | 57.0% 16,014 | 39.2% 11,010 | 3.8% 1,072 |
| 1896 | 56.2% 14,928 | 41.6% 11,029 | 2.2% 589 |
| 1892 | 48.8% 10,804 | 48.6% 10,747 | 2.6% 569 |
| 1888 | 49.4% 9,926 | 47.8% 9,602 | 2.9% 577 |
County commissioners
- Gina Cerilli, Chairman, Democrat
- Ted Kopas, Democrat
- Charles Anderson, Republican
Other county officials
- Clerk of Courts, Bryan Kline, Republican
- Controller, Jeff Balzer, Republican
- Coroner, Kenneth Bacha, Democrat
- District Attorney, John Peck, Democrat
- Prothonotary, Christina O'Brien, Democrat
- Recorder of Deeds, Tom Murphy, Democrat
- Register of Wills, Sherry Magretti-Hamilton, Republican
- Sheriff, Jonathan Held, Republican
- Treasurer, Jared M Squires, Republican
State House of Representatives[13]
| District | Representative | Party |
|---|---|---|
| 33 | Frank Dermody | Democrat |
| 52 | Ryan Warner | Republican |
| 54 | Eli Evankovich | Republican |
| 55 | Joseph Petrarca, Jr. | Democrat |
| 56 | George Dunbar | Republican |
| 57 | Eric Nelson | Republican |
| 58 | Justin Walsh | Republican |
| 59 | Mike Reese | Republican |
State Senate[13]
| District | Senator | Party |
|---|---|---|
| 32 | Patrick J. Stefano | Republican |
| 39 | Kim Ward | Republican |
| 41 | Donald C. White | Republican |
| 45 | Jim Brewster | Democrat |
United States House of Representatives
| District | Representative | Party |
|---|---|---|
| 9 | Bill Shuster | Republican |
| 12 | Keith Rothfus | Republican |
| 14 | Mike Doyle | Democratic |
| 18 | Conor Lamb | Democratic |
United States Senate
| Senator | Party |
|---|---|
| Pat Toomey | Republican |
| Bob Casey | Democrat |
Education
Public school districts
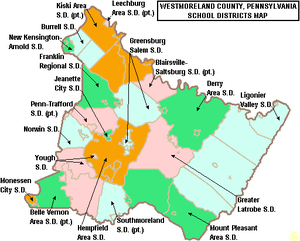
- Belle Vernon Area School District (Also in Fayette County)
- Blairsville-Saltsburg School District (Also in Indiana County)
- Burrell School District
- Derry Area School District
- Franklin Regional School District
- Greater Latrobe School District
- Greensburg-Salem School District
- Hempfield Area School District
- Jeannette City School District
- Kiski Area School District (Also in Armstrong County)
- Leechburg Area School District (Also in Armstrong County)
- Ligonier Valley School District
- Monessen City School District
- Mount Pleasant Area School District
- New Kensington–Arnold School District
- Norwin School District
- Penn-Trafford School District (also in Allegheny County)
- Southmoreland School District (also in Fayette County)
- Yough School District
Public charter schools
- Dr. Robert Ketterer Charter School grades 7th through 12th Latrobe (since 2008)
According to EdNA[14]
Private high school
Colleges and universities
Economy
A major coal strike occurred in the county in the winter of 1910–11.
Volkswagen's Westmoreland plant near New Stanton in Westmoreland County was the first foreign-owned factory mass-producing automobiles in the U.S. It operated from 1978 to 1988.
Recreation

There are four Pennsylvania state parks in Westmoreland County.
Communities

Under Pennsylvania law, there are four types of incorporated municipalities: cities, boroughs, townships, and, in at most two cases, towns. The following cities, boroughs and townships are located in Westmoreland County:
Cities
- Arnold
- Greensburg (county seat)
- Jeannette
- Latrobe
- Lower Burrell
- Monessen
- New Kensington
Boroughs
- Adamsburg
- Arona
- Avonmore
- Bolivar
- Delmont
- Derry
- Donegal
- East Vandergrift
- Export
- Hunker
- Hyde Park
- Irwin
- Laurel Mountain
- Ligonier
- Madison
- Manor
- Mount Pleasant
- Murrysville
- New Alexandria
- New Florence
- New Stanton
- North Belle Vernon
- North Irwin
- Oklahoma
- Penn
- Scottdale
- Seward
- Smithton
- South Greensburg
- Southwest Greensburg
- Sutersville
- Trafford (partly in Allegheny County)
- Vandergrift
- West Leechburg
- West Newton
- Youngstown
- Youngwood
Townships
Census-designated places
Census-designated places are geographical areas designated by the U.S. Census Bureau for the purposes of compiling demographic data. They are not actual jurisdictions under Pennsylvania law. Other unincorporated communities, such as villages, may be listed here as well.
Unincorporated communities
- Acme
- Alverton
- Ardara
- Armbrust
- Baggaley
- Bessemer
- Blackstone
- Boquet
- Bovard
- Brenizer
- Carbon
- Claridge
- Forbes Road
- Greenwald
- Hannastown
- Hopewell
- Hutchinson
- Jacobs Creek
- Jones Mills
- Kecksburg
- Larimer
- Laughlintown
- Lloydsville
- Lowber
- Luxor
- Marguerite
- Morewood
- Moween
- New Derry
- Pandora
- Peanut
- Pleasant Unity
- Reagantown
- Rector
- Reduction
- Ruffs Dale
- Salina
- Scab Hill
- Seger
- Southwest
- Stahlstown
- Standard Shaft
- Tarrs
- Torrance
- Trauger
- Turkeytown
- United
- Wendel
- Westmoreland City
- Whitney
Former community
- Franklin Township - now known as Murrysville, Pennsylvania [15][16][17]
Population ranking
The population ranking of the following table is based on the 2010 census of Westmoreland County.[18]
† county seat
| Rank | City/Town/etc. | Municipal type | Population (2010 Census)
|
|---|---|---|---|
| 1 | Murrysville | Municipality | 20,079 |
| 2 | † Greensburg | City | 14,892 |
| 3 | New Kensington | City | 13,116 |
| 4 | Lower Burrell | City | 11,761 |
| 5 | Jeannette | City | 9,654 |
| 6 | Latrobe | City | 8,338 |
| 7 | Monessen | City | 7,720 |
| 8 | Vandergrift | Borough | 5,205 |
| 9 | Arnold | City | 5,157 |
| 10 | Mount Pleasant | Borough | 4,454 |
| 11 | Scottdale | Borough | 4,384 |
| 12 | Level Green | CDP | 4,020 |
| 13 | Irwin | Borough | 3,973 |
| 14 | Loyalhanna | CDP | 3,428 |
| 15 | Manor | Borough | 3,239 |
| 16 | Trafford (partially in Allegheny County) | Borough | 3,174 |
| 17 | Youngwood | Borough | 3,050 |
| 18 | Derry | Borough | 2,688 |
| 19 | Delmont | Borough | 2,686 |
| 20 | West Newton | Borough | 2,633 |
| 21 | Lawson Heights | CDP | 2,194 |
| 22 | New Stanton | Borough | 2,173 |
| 23 | Southwest Greensburg | Borough | 2,155 |
| 24 | South Greensburg | Borough | 2,117 |
| 25 | Lynnwood-Pricedale | CDP | 2,031 |
| 26 | North Belle Vernon | Borough | 1,971 |
| 27 | Ligonier | Borough | 1,573 |
| 28 | St. Vincent College | CDP | 1,357 |
| 29 | West Leechburg | Borough | 1,294 |
| 30 | Calumet | CDP | 1,241 |
| 31 | Fellsburg | CDP | 1,180 |
| 32 | Collinsburg | CDP | 1,125 |
| 33 | Avonmore | Borough | 1,011 |
| 34 | Norvelt | CDP | 948 |
| 35 | Export | Borough | 917 |
| 36 | North Irwin | Borough | 846 |
| 37 | Oklahoma | Borough | 809 |
| 38 | Herminie | CDP | 789 |
| 39 | Hostetter | CDP | 740 |
| 40 | New Florence | Borough | 689 |
| 41 | Yukon | CDP | 677 |
| 42 | East Vandergrift | Borough | 674 |
| 43 | Sutersville | Borough | 605 |
| 44 | Millwood | CDP | 566 |
| 45 | New Alexandria | Borough | 560 |
| 46 | Bradenville | CDP | 545 |
| 47 | Grapeville | CDP | 538 |
| 48 | Mammoth | CDP | 525 |
| 49 | Hyde Park | Borough | 500 |
| 50 | Seward | Borough | 495 |
| 51 | Wyano | CDP | 484 |
| 52 | Penn | Borough | 475 |
| 53 | Bolivar | Borough | 465 |
| 54 | Smithton | Borough | 399 |
| 55 | Madison | Borough | 397 |
| 56 | Slickville | CDP | 388 |
| 57 | Arona | Borough | 370 |
| 58 | Youngstown | Borough | 326 |
| 59 | Hunker | Borough | 291 |
| 60 | Crabtree | CDP | 277 |
| 61 | Webster | CDP | 255 |
| 62 | Adamsburg | Borough | 172 |
| 63 | Laurel Mountain | Borough | 167 |
| 64 | Harrison City | CDP | 134 |
| 65 | Donegal | Borough | 120 |
Notable people
- David Alter, born in Westmoreland County, noted inventor[19]
- Pete Babando, former NHL Hockey player, played for 1950 Stanley Cup champions Detroit Red Wings, born in Braeburn neighborhood of the City of Lower Burrell.
- George Blanda, Hall of Fame football player, born in Youngwood.
- D.J. Coffman, comic book artist and writer, creator of Hero By Night. Born in Mt. Pleasant. Resides in Scottdale.
- Johnny Costa, jazz pianist, was born and raised in Arnold.
- Jesse Root Grant, (father of Ulysses S. Grant General and President) born in Greensburg.
- Shirley Jones, Academy Award–winning actress and singer, grew up in Smithton.
- Sheila Kelley, American actor, born and raised in Greensburg, Pa. Founder of Sheila Kelley S Factor movement.
- Bill Mazeroski, Hall of Fame baseball player
- Michael Moorer, boxer
- Arnold Palmer, golfer, was born and raised in Latrobe.
- Terrelle Pryor NFL quarterback, attended Jeannette high school.
- Fred Rogers, television personality, was born, raised and lived in Latrobe; buried in Unity Cemetery, Unity Township just outside Latrobe.
- Arthur St. Clair. American Revolution Major General, buried in Greensburg, Pa.
- Willie Thrower, football player, was born and raised in New Kensington.
- Jim White, KMOX radio talk show host, born and raised in Greensburg, Pa.
- Jacob Zimmerman (born 1831), newspaper editor, newspaper owner, Illinois politician, mine owner, real estate entrepreneur, and businessman.
See also
References
- 1 2 "State & County QuickFacts". United States Census Bureau. Retrieved November 22, 2013.
- ↑ "Find a County". National Association of Counties. Retrieved 2011-06-07.
- ↑ "2010 Census Gazetteer Files". United States Census Bureau. August 22, 2012. Retrieved March 11, 2015.
- ↑ "Population and Housing Unit Estimates". Retrieved October 10, 2018.
- ↑ "U.S. Decennial Census". United States Census Bureau. Retrieved March 11, 2015.
- ↑ "Historical Census Browser". University of Virginia Library. Retrieved March 11, 2015.
- ↑ Forstall, Richard L., ed. (March 24, 1995). "Population of Counties by Decennial Census: 1900 to 1990". United States Census Bureau. Retrieved March 11, 2015.
- ↑ "Census 2000 PHC-T-4. Ranking Tables for Counties: 1990 and 2000" (PDF). United States Census Bureau. April 2, 2001. Retrieved March 11, 2015.
- ↑ "American FactFinder". United States Census Bureau. Retrieved 2017-09-14.
- ↑ "Home". Dos.state.pa.us. Retrieved 9 October 2018.
- ↑ "Voters shake up row offices, toss Democrats - TribLIVE". Archive.today. 9 September 2012. Archived from the original on 9 September 2012. Retrieved 9 October 2018.
- ↑ Leip, David. "Dave Leip's Atlas of U.S. Presidential Elections". Uselectionatlas.org. Retrieved 9 October 2018.
- 1 2 Center, Legislativate Data Processing. "Find Your Legislator". The official website for the Pennsylvania General Assembly. Retrieved 2017-04-21.
- ↑ Pennsylvania Department of Education, Education Names and Addresses, 2012
- ↑ "History Franklin Township Westmoreland County, Pa". History.rays-place.com. Retrieved 9 October 2018.
- ↑ "Westmoreland County Pennsylvania Atlas, 1867". Usgwarchives.net. Retrieved 9 October 2018.
- ↑ "Franklin Township, Westmoreland County Pennsylvania". Pa-roots.com. Retrieved 9 October 2018.
- ↑ "This site has been redesigned and relocated. - U.S. Census Bureau". Census.gov. Retrieved 9 October 2018.
- ↑ Who Was Who in America, Historical Volume, 1607–1896. Marquis Who's Who. 1967.
External links
| Wikimedia Commons has media related to Westmoreland County, Pennsylvania. |
- official Westmoreland County website
- InWestmoreland: a directory of Westmoreland County
- Westmoreland County Historical Society
Places adjacent to Westmoreland County, Pennsylvania | ||||||||||
|---|---|---|---|---|---|---|---|---|---|---|
| ||||||||||
| Counties | 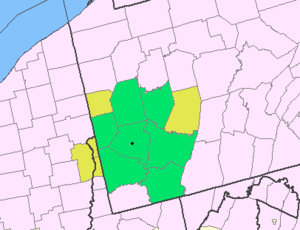 Map of the Pittsburgh Tri-State with green counties in the metropolitan area and yellow counties in the combined area. | |
|---|---|---|
| Major cities | ||
| Cities and towns 15k-50k (in 2010) | ||
| Airports | ||
| Topics | ||
| ||