Box Elder County, Utah
Box Elder County is a county at the northwestern corner of Utah, United States. As of 2018, the estimated population is 54,950. Its county seat and largest city is Brigham City.[1] The county was named for the box elder trees that abound in the county.
Box Elder County | |
|---|---|
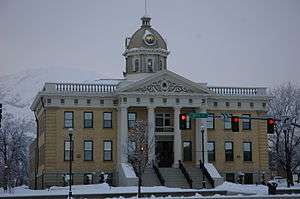 Box Elder County Courthouse, January 2010 | |
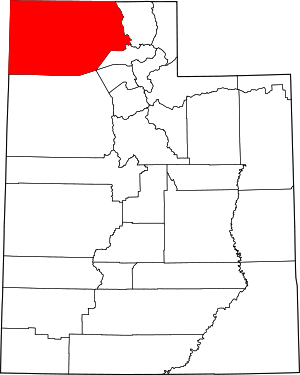 Location within the U.S. state of Utah | |
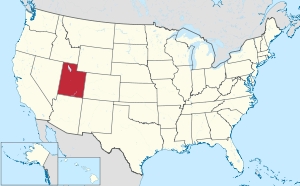 Utah's location within the U.S. | |
| Coordinates: 41.51°N 113.10°W | |
| Country | |
| State | |
| Founded | January 5, 1856 |
| Named for | Box elder tree |
| Seat | Brigham City |
| Largest city | Brigham City |
| Area | |
| • Total | 6,729 sq mi (17,430 km2) |
| • Land | 5,746 sq mi (14,880 km2) |
| • Water | 934 sq mi (2,420 km2) 15% |
| Population (2010) | |
| • Total | 49,975 |
| • Estimate (2019) | 56,046 |
| • Density | 9.7/sq mi (3.7/km2) |
| Time zone | UTC−7 (Mountain) |
| • Summer (DST) | UTC−6 (MDT) |
| Congressional district | 1st |
| Website | www |
Box Elder County is part of the Ogden-Clearfield, UT Metropolitan Statistical Area, which is also included in the Salt Lake City-Provo-Orem, UT Combined Statistical Area.
History


The county was created by the Utah Territory legislature on January 5, 1856, with territory partitioned from Weber County. Its boundaries were altered in 1862 by adjustments between counties, and in 1866 when all its area in the now-existent state of Nevada (which had gained territorial status in 1861, and statehood in 1864) was formally partitioned. The county boundaries were finally altered in 1880 by adjustments between Salt Lake and Weber counties. Its boundary has remained unchanged since 1880.[2]
The California Trail followed Goose Creek from a point just north of the Idaho/Utah border southwest across northwestern Box Elder County to Little Goose Creek in northeastern Elko County, Nevada.[3] The link-up of the first transcontinental railroad occurred at Promontory Summit, Utah in 1869.
The famous Spiral Jetty was built on the north shore of the Great Salt Lake in Box Elder County in 1970.
Geography
Box Elder County lies at the NW corner of Utah. Its west border abuts the east border of the state of Nevada and its north border abuts the south border of the state of Idaho. Its territory includes large tracts of barren desert, contrasted by high, forested mountains. The Wasatch Front lies along the south-eastern border, where the main cities are found.[4] The terrain generally slopes to the south (toward the Great Salt Lake), although the NW corner of the county slopes to the north, allowing runoff from that area to flow to the Snake River drainage. The county's highest point is a mountain ridge near the NW corner, at 9,180' (2798m) ASL.[5] The county has a total area of 6,729 square miles (17,430 km2), of which 5,746 square miles (14,880 km2) is land and 984 square miles (2,550 km2) (15%) is water.[6] It is the fourth-largest county in Utah by area.
In the east lie the Wellsville Mountains, a branch of the Wasatch Range. In the west is a large, mostly uninhabited desert area. The Great Salt Lake lies in the southeastern corner of the county. The combined Interstate 15/Interstate 84 runs northward in the eastern part of the county. The two routes diverge at Tremonton, with I-84 heading northwest past Snowville into cenral and western Idaho, and I-15 heading north past Plymouth and Portage into eastern Idaho.
Adjacent counties
- Cache County - northeast
- Weber County - east
- Davis County - southeast (across Great Salt Lake)
- Tooele County - south
- Elko County, Nevada - west
- Cassia County, Idaho - northwest
- Oneida County, Idaho - north
National protected areas
- Bear River Migratory Bird Refuge
- Caribou-Targhee National Forest (part)
- Golden Spike National Historic Site
- Sawtooth National Forest (part)
- Wasatch-Cache National Forest (part)
Demographics
| Historical population | |||
|---|---|---|---|
| Census | Pop. | %± | |
| 1860 | 1,608 | — | |
| 1870 | 4,855 | 201.9% | |
| 1880 | 6,761 | 39.3% | |
| 1890 | 7,642 | 13.0% | |
| 1900 | 10,009 | 31.0% | |
| 1910 | 13,894 | 38.8% | |
| 1920 | 18,788 | 35.2% | |
| 1930 | 17,810 | −5.2% | |
| 1940 | 18,832 | 5.7% | |
| 1950 | 19,734 | 4.8% | |
| 1960 | 25,061 | 27.0% | |
| 1970 | 28,129 | 12.2% | |
| 1980 | 33,222 | 18.1% | |
| 1990 | 36,485 | 9.8% | |
| 2000 | 42,745 | 17.2% | |
| 2010 | 49,975 | 16.9% | |
| Est. 2019 | 56,046 | 12.1% | |
| US Decennial Census[7] 1790–1960[8] 1900–1990[9] 1990–2000[10] 2010–2018[11] 2019[12] | |||
2000 census
As of the 2000 United States Census, there were 42,745 people, 13,144 households, and 10,804 families in the county. The population density was 7.44/sqmi (2.87/km²). There were 14,209 housing units at an average density of 2.47/sqmi (0.95/km²). The racial makeup of the county was 92.87% White, 0.17% Black or African American, 0.88% Native American, 0.96% Asian, 0.08% Pacific Islander, 3.45% from other races, and 1.60% from two or more races. 6.53% of the population were Hispanic or Latino of any race.
There were 13,144 households out of which 47.10% had children under the age of 18 living with them, 71.00% were married couples living together, 7.90% had a female householder with no husband present, and 17.80% were non-families. Of the 13,144 households, 281 are unmarried partner households: 247 heterosexual, 22 same-sex male, and 12 same-sex female. 16.00% of all households were made up of individuals and 7.40% had someone living alone who was 65 years of age or older. The average household size was 3.22 and the average family size was 3.63.
The county population contained 36.10% under the age of 18, 10.50% from 18 to 24, 25.40% from 25 to 44, 17.70% from 45 to 64, and 10.40% who were 65 years of age or older. The median age was 28 years. For every 100 females there were 101.70 males. For every 100 females age 18 and over, there were 98.90 males.
The median income for a household in the county was $44,630, and the median income for a family was $49,421. Males had a median income of $38,814 versus $22,435 for females. The per capita income for the county was $15,625. About 5.80% of families and 7.10% of the population were below the poverty line, including 8.30% of those under age 18 and 5.30% of those age 65 or over.
2010 census
As of the 2010 census,[13] there were 49,975 people, 16,058 households, and 12,891 families in the county. The population density was 8.70/sqmi (3.36/km²). There were 17,326 housing units at an average density of 3.02/sqmi (1.16/km²). The racial makeup of the county was 91.77% White, 0.34% Black or African American, 0.82% Native American, 0.89% Asian, 0.17% Pacific Islander, 3.77% from other races, and 2.24% from two or more races. 8.31% of the population were Hispanic or Latino of any race.
There were 16,058 households out of which 41.32% had children under the age of 18 living with them, 67.44% were married couples living together, 8.69% had a female householder with no husband present, and 19.72% were non-families. 17.16% of all households were made up of individuals and 7.39% had someone living alone who was 65 years of age or older. The average household size was 3.09 and the average family size was 3.50.
The county population contained 36.60% under the age of 20, 5.55% from 20 to 24, 25.37% from 25 to 44, 21.35% from 45 to 64, and 11.13% who were 65 years of age or older. The median age was 30.6 years. For every 100 females there were 101.59 males. For every 100 females age 18 and over, there were 96.61 males.
2015
As of 2015, the largest self reported ancestry groups in Box Elder County were:
- 26.0% were of English ancestry
- 12.7% were of German ancestry
- 9.3% were of American ancestry
- 8.4% were of Danish ancestry
- 5.5% were of Irish ancestry
- 4.5% were of Scottish ancestry[14]
Education
Elementary
- Century
- Discovery
- Fielding
- Foothill
- Garland
- Grouse Creek
- Lake View
- McKinley
- Mountain View
- North Park
- Park Valley
- Snowville
- Three Mile Creek
- Willard
Intermediate
- Alice C. Harris
- Adele C. Young
Middle
- Bear River
- Box Elder
High
- Bear River
- Box Elder
- Dale Young Community
Speciality schools
- Early Learning Center
- Independent Life Skills Center
Politics
Box Elder voters are traditionally Republican. In no national election since 1944 has the county selected the Democratic Party candidate.
| Year | Republican | Democratic | Third parties |
|---|---|---|---|
| 2016 | 61.5% 12,230 | 11.5% 2,282 | 27.0% 5,366 |
| 2012 | 88.1% 17,101 | 10.2% 1,984 | 1.7% 323 |
| 2008 | 79.2% 15,228 | 17.2% 3,311 | 3.5% 678 |
| 2004 | 85.8% 15,751 | 12.2% 2,244 | 2.0% 373 |
| 2000 | 79.4% 12,288 | 16.5% 2,555 | 4.1% 640 |
| 1996 | 62.7% 8,373 | 23.7% 3,170 | 13.6% 1,822 |
| 1992 | 49.6% 7,712 | 14.1% 2,186 | 36.4% 5,657 |
| 1988 | 81.4% 12,585 | 17.7% 2,736 | 0.9% 140 |
| 1984 | 86.7% 13,243 | 13.0% 1,983 | 0.4% 57 |
| 1980 | 82.7% 12,500 | 14.2% 2,142 | 3.1% 469 |
| 1976 | 69.0% 9,319 | 24.8% 3,353 | 6.1% 829 |
| 1972 | 77.2% 9,880 | 16.7% 2,134 | 6.1% 780 |
| 1968 | 65.7% 7,680 | 26.5% 3,093 | 7.8% 915 |
| 1964 | 57.3% 6,851 | 42.7% 5,113 | |
| 1960 | 63.2% 6,594 | 36.7% 3,831 | 0.0% 3 |
| 1956 | 68.3% 5,804 | 31.7% 2,689 | |
| 1952 | 66.2% 5,850 | 33.8% 2,984 | |
| 1948 | 50.7% 3,790 | 49.1% 3,667 | 0.2% 18 |
| 1944 | 42.5% 3,058 | 57.5% 4,138 | 0.1% 5 |
| 1940 | 40.7% 3,248 | 59.3% 4,736 | 0.0% 2 |
| 1936 | 30.2% 2,180 | 69.2% 5,001 | 0.7% 50 |
| 1932 | 44.7% 3,048 | 54.1% 3,695 | 1.2% 84 |
| 1928 | 56.9% 3,317 | 42.7% 2,488 | 0.3% 20 |
| 1924 | 56.2% 3,086 | 33.5% 1,841 | 10.3% 566 |
| 1920 | 58.9% 3,421 | 40.1% 2,330 | 1.1% 61 |
| 1916 | 44.7% 2,416 | 54.7% 2,957 | 0.7% 35 |
| 1912 | 40.6% 1,650 | 34.5% 1,402 | 24.9% 1,011 |
| 1908 | 62.2% 2,396 | 36.8% 1,417 | 1.1% 42 |
| 1904 | 66.8% 2,400 | 32.0% 1,151 | 1.2% 44 |
| 1900 | 52.7% 1,635 | 47.1% 1,460 | 0.2% 6 |
| 1896 | 28.1% 735 | 71.9% 1,879 |
Communities

Cities
- Bear River City
- Brigham City (county seat)
- Corinne
- Garland
- Honeyville
- Perry
- Tremonton
- Willard
Census designated places
Unincorporated communities
Ghost towns
- Blue Creek
- Cedar Creek
- Golden
- Hardup
- Jackson
- Kelton
- Kosmo
- Lucin
- Matlin
- Promontory Point
- Russian Settlement
- Saline
- Terrace
- Washakie
See also
References
- "Find a County". National Association of Counties. Archived from the original on May 31, 2011. Retrieved June 7, 2011.
- Newberry Library. Individual County Chronologies - Box Elder County UT (accessed March 25, 2019)
- "California Trail". Trails West. Retrieved October 24, 2014.
- Box Elder County UT Google Maps (accessed 13 March 2019)
- ""Find an Altitude/Box Elder County UT" Google Maps (accessed 13 March 2019)". Archived from the original on May 21, 2019. Retrieved March 14, 2019.
- "2010 Census Gazetteer Files". US Census Bureau. August 22, 2012. Retrieved March 27, 2015.
- "US Decennial Census". US Census Bureau. Retrieved March 27, 2015.
- "Historical Census Browser". University of Virginia Library. Retrieved March 27, 2015.
- Forstall, Richard L., ed. (March 27, 1995). "Population of Counties by Decennial Census: 1900 to 1990". US Census Bureau. Retrieved March 27, 2015.
- "Census 2000 PHC-T-4. Ranking Tables for Counties: 1990 and 2000" (PDF). US Census Bureau. April 2, 2001. Retrieved March 27, 2015.
- "State & County QuickFacts". United States Census Bureau. Retrieved December 29, 2013.
- "QuickFacts. Box Elder County, Utah". Retrieved May 17, 2020.
- "U.S. Census website". US Census Bureau. Retrieved May 14, 2011.
- Bureau, US Census. "American FactFinder - Results". factfinder.census.gov. Archived from the original on February 13, 2020. Retrieved March 30, 2018.
- Leip, David. "Atlas of US Presidential Elections". uselectionatlas.org. Retrieved March 30, 2018.
External links
| Wikimedia Commons has media related to Box Elder County, Utah. |
Places adjacent to Box Elder County, Utah | |
|---|---|
Municipalities and communities of Box Elder County, Utah, United States | ||
|---|---|---|
| Cities | Map of Utah highlighting Box Elder County | |
| Towns | ||
| CDPs | ||
| Unincorporated areas | ||
| Ghost towns | ||
| Indian reservation | ||
Salt Lake City (capital) | |||||||||||||
| Topics |
|  | |||||||||||
| Society |
| ||||||||||||
| Regions | |||||||||||||
| Largest cities |
| ||||||||||||
| Counties | |||||||||||||
| Attractions |
| ||||||||||||
| Authority control |
|
|---|