Mesa County, Colorado
Mesa County is one of the 64 counties of the U.S. state of Colorado. As of the 2010 census, the population was 146,723.[1] The county seat is Grand Junction.[2] The county was named for the many large mesas in the area, including Grand Mesa.
Mesa County | |
|---|---|
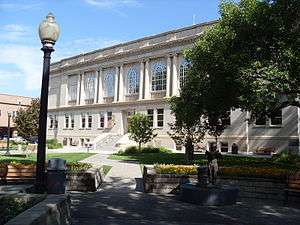 Mesa County Courthouse | |
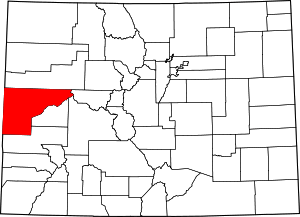 Location within the U.S. state of Colorado | |
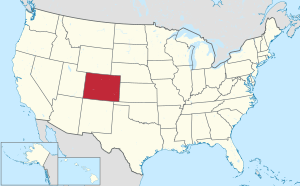 Colorado's location within the U.S. | |
| Coordinates: 39°01′N 108°28′W | |
| Country | |
| State | |
| Founded | February 14, 1883 |
| Named for | mesas in the area |
| Seat | Grand Junction |
| Largest city | Grand Junction |
| Area | |
| • Total | 3,341 sq mi (8,650 km2) |
| • Land | 3,329 sq mi (8,620 km2) |
| • Water | 12 sq mi (30 km2) 0.4%% |
| Population | |
| • Estimate (2019) | 154,210 |
| • Density | 44/sq mi (17/km2) |
| Time zone | UTC−7 (Mountain) |
| • Summer (DST) | UTC−6 (MDT) |
| Congressional district | 3rd |
| Website | www |
Mesa County comprises the Grand Junction, CO Metropolitan Statistical Area.[3][4]
Geography
According to the U.S. Census Bureau, the county has a total area of 3,341 square miles (8,650 km2), of which 3,329 square miles (8,620 km2) is land and 12 square miles (31 km2) (0.4%) is water.[5] It is the fourth-largest county by area in Colorado.
Adjacent counties
- Garfield County – north
- Pitkin County – east
- Gunnison County – east
- Delta County – southeast
- Montrose County – south
- Grand County, Utah – west
National protected areas
- Black Ridge Canyons Wilderness
- Colorado National Monument
- Dominguez Canyon Wilderness
- Dominguez-Escalante National Conservation Area (part)
- Grand Mesa National Forest
- Manti-La Sal National Forest
- McInnis Canyons National Conservation Area (part)
- Uncompahgre National Forest
- White River National Forest
State protected areas
Trails and byways
- American Discovery Trail
- Dinosaur Diamond Prehistoric Highway National Scenic Byway
- Grand Mesa National Scenic and Historic Byway
- Kokopelli Trail
- Old Spanish National Historic Trail
- Unaweep/Tabeguache Scenic and Historic Byway
- Colorado Riverfront Trail
Demographics
| Historical population | |||
|---|---|---|---|
| Census | Pop. | %± | |
| 1890 | 4,260 | — | |
| 1900 | 9,267 | 117.5% | |
| 1910 | 22,197 | 139.5% | |
| 1920 | 22,281 | 0.4% | |
| 1930 | 25,908 | 16.3% | |
| 1940 | 33,791 | 30.4% | |
| 1950 | 38,794 | 14.8% | |
| 1960 | 50,715 | 30.7% | |
| 1970 | 54,734 | 7.9% | |
| 1980 | 81,530 | 49.0% | |
| 1990 | 93,145 | 14.2% | |
| 2000 | 116,255 | 24.8% | |
| 2010 | 146,723 | 26.2% | |
| Est. 2019 | 154,210 | [6] | 5.1% |
| U.S. Decennial Census[7] 1790-1960[8] 1900-1990[9] 1990-2000[10] 2010-2015[1] | |||
As of the census[11] of 2010, there were 146,723 people, 58,095 households, and 38,593 families living in the county. The population density was 44.1 people per square mile (17.23.1/km²). There were 62,644 housing units. Information that follows comes from the 2000 American Factfinder data: The racial makeup of the county was 92.34% White, 0.46% Black or African American, 0.91% Native American, 0.53% Asian, 0.10% Pacific Islander, 3.67% from other races, and 1.99% from two or more races. 10.02% of the population were Hispanic or Latino of any race.
There were 45,823 households out of which 31.40% had children under the age of 18 living with them, 55.30% were married couples living together, 9.80% had a female householder with no husband present, and 31.10% were non-families. 25.10% of all households were made up of individuals and 10.30% had someone living alone who was 65 years of age or older. The average household size was 2.47 and the average family size was 2.94.
In the county, the population was spread out with 25.00% under the age of 18, 9.40% from 18 to 24, 26.70% from 25 to 44, 23.70% from 45 to 64, and 15.20% who were 65 years of age or older. The median age was 38 years. For every 100 females there were 96.00 males. For every 100 females age 18 and over, there were 93.20 males.
The median income for a household in the county was $35,864, and the median income for a family was $43,009. Males had a median income of $32,316 versus $22,374 for females. The per capita income for the county was $18,715. About 7.00% of families and 10.20% of the population were below the poverty line, including 11.50% of those under age 18 and 8.10% of those age 65 or over.
Politics
Mesa is a strongly Republican county. It has voted Democratic only once since 1952, during Lyndon Johnson’s 1964 landslide, and Hubert Humphrey in the following 1968 election is the last Democrat to pass forty percent of the county’s vote.
| Year | Republican | Democratic | Others |
|---|---|---|---|
| 2016 | 64.1% 49,779 | 28.0% 21,729 | 7.9% 6,146 |
| 2012 | 65.1% 47,472 | 32.7% 23,846 | 2.2% 1,629 |
| 2008 | 64.0% 44,578 | 34.5% 24,008 | 1.5% 1,045 |
| 2004 | 67.1% 41,539 | 31.6% 19,564 | 1.3% 782 |
| 2000 | 63.5% 32,396 | 30.3% 15,465 | 6.3% 3,193 |
| 1996 | 53.1% 24,761 | 36.7% 17,114 | 10.2% 4,737 |
| 1992 | 41.2% 18,169 | 34.4% 15,162 | 24.4% 10,736 |
| 1988 | 59.6% 22,150 | 38.7% 14,372 | 1.7% 633 |
| 1984 | 69.7% 23,736 | 29.2% 9,938 | 1.2% 400 |
| 1980 | 68.9% 22,686 | 22.9% 7,549 | 8.2% 2,681 |
| 1976 | 65.4% 17,924 | 32.2% 8,807 | 2.4% 659 |
| 1972 | 68.7% 15,527 | 28.1% 6,358 | 3.2% 728 |
| 1968 | 49.6% 10,745 | 40.5% 8,775 | 9.9% 2,151 |
| 1964 | 39.5% 8,317 | 60.3% 12,716 | 0.2% 49 |
| 1960 | 58.8% 13,015 | 41.0% 9,072 | 0.2% 45 |
| 1956 | 62.8% 12,869 | 36.9% 7,567 | 0.3% 60 |
| 1952 | 63.1% 11,883 | 36.5% 6,883 | 0.4% 79 |
| 1948 | 43.4% 6,586 | 55.3% 8,401 | 1.3% 198 |
| 1944 | 48.9% 6,653 | 50.5% 6,870 | 0.6% 75 |
| 1940 | 47.3% 7,049 | 51.6% 7,694 | 1.1% 169 |
| 1936 | 29.5% 3,654 | 63.1% 7,824 | 7.4% 921 |
| 1932 | 37.2% 4,388 | 56.6% 6,682 | 6.2% 737 |
| 1928 | 65.8% 6,446 | 32.9% 3,223 | 1.4% 133 |
| 1924 | 45.5% 4,053 | 26.8% 2,388 | 27.7% 2,461 |
| 1920 | 49.8% 3,621 | 43.2% 3,138 | 7.0% 512 |
| 1916 | 30.1% 2,223 | 59.4% 4,394 | 10.5% 778 |
| 1912 | 12.5% 976 | 34.9% 2,733 | 52.6% 4,115 |
Communities
Cities
Census-designated places
Transportation
Major Highways


Air
- Grand Junction Regional Airport is located 4.6 miles from downtown Grand Junction.
- Mack Mesa Airport is located 25 miles from downtown Grand Junction.
- Pinyon Airport is located 12.6 miles from downtown Grand Junction.
Train
- There is an Amtrak Station located in downtown Grand Junction. The California Zephyr makes daily stops at the station on its way between San Francisco and Chicago.
Bus
- There is a Greyhound Bus Station located in Grand Junction.
- Grand Valley Transit is the public transportation agency that serves the Grand Junction area and currently has 11 fixed routes.
See also
References
- "State & County QuickFacts". United States Census Bureau. Archived from the original on June 6, 2011. Retrieved June 8, 2014.
- "Find a County". National Association of Counties. Retrieved 2011-06-07.
- "OMB Bulletin No. 10-02: Update of Statistical Area Definitions and Guidance on Their Uses" (PDF). United States Office of Management and Budget. December 1, 2009. Archived from the original (PDF) on March 16, 2012. Retrieved April 19, 2012.
- See the Colorado census statistical areas.
- "US Gazetteer files: 2010, 2000, and 1990". United States Census Bureau. 2011-02-12. Retrieved 2011-04-23.
- "Population and Housing Unit Estimates". Retrieved June 9, 2017.
- "U.S. Decennial Census". United States Census Bureau. Retrieved June 8, 2014.
- "Historical Census Browser". University of Virginia Library. Retrieved June 8, 2014.
- "Population of Counties by Decennial Census: 1900 to 1990". United States Census Bureau. Retrieved June 8, 2014.
- "Census 2000 PHC-T-4. Ranking Tables for Counties: 1990 and 2000" (PDF). United States Census Bureau. Retrieved June 8, 2014.
- "U.S. Census website". Retrieved 2016-03-23.
- Leip, David. "Dave Leip's Atlas of U.S. Presidential Elections". uselectionatlas.org. Retrieved May 26, 2017.
External links
Places adjacent to Mesa County, Colorado | ||||||||||
|---|---|---|---|---|---|---|---|---|---|---|
| ||||||||||
Municipalities and communities of Mesa County, Colorado, United States | ||
|---|---|---|
| Cities | Map of Colorado highlighting Mesa County | |
| Towns | ||
| CDPs | ||
| Unincorporated communities | ||
| Ghost towns | ||
| Authority control |
|
|---|