San Juan County, Utah
| San Juan County, Utah | |
|---|---|
 San Juan County Courthouse, Monticello | |
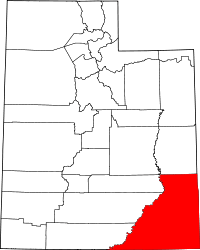 Location in the U.S. state of Utah | |
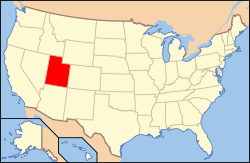 Utah's location in the U.S. | |
| Coordinates: 37°38′N 109°49′W / 37.63°N 109.81°W | |
| Founded | 1880 |
| Named for | San Juan River |
| Seat | Monticello |
| Largest city | Blanding |
| Area | |
| • Total | 7,933 sq mi (20,546 km2) |
| • Land | 7,820 sq mi (20,254 km2) |
| • Water | 113 sq mi (293 km2), 1.4% |
| Population (est.) | |
| • (2015) | 16,895 |
| • Density | 2.03/sq mi (0.78/km2) |
| Congressional district | 3rd |
| Time zone | Mountain: UTC−7/−6 |
| Website |
www |
San Juan County (/sæn
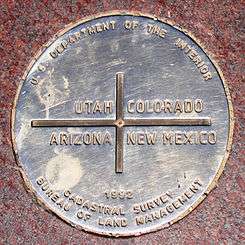
San Juan County borders Arizona, Colorado, and New Mexico at the Four Corners.
History
San Juan County was organized in 1880.
Geography
According to the U.S. Census Bureau, the county has a total area of 7,933 square miles (20,550 km2), of which 7,820 square miles (20,300 km2) is land and 113 square miles (290 km2) (1.4%) is water.[3] It is the largest county by area in Utah.

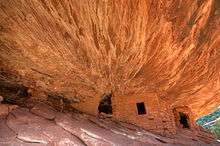
The county's western and southern boundaries lie deep within gorges carved by the Colorado and San Juan Rivers. Tributary canyons, cutting through rock layers of the surrounding deserts, have carved the land up with chasms, cliffs and plateaus. In the center of the county are Cedar Mesa, Comb Wash, Natural Bridges and Hovenweep National Monuments. Canyonlands National Park is primarily within the county borders. The Eastern side of Glen Canyon National Recreation Area / Lake Powell in also in San Juan County. Rising above all, the Blue (Abajo) Mountains reach to nearly 12,000 feet (3,700 m) and the La Sal Mountains rise to 13,000 feet (4,000 m). Both ranges are covered with lush forests vividly contrasting with the scenery below. The elevation change within the county is from near 13,000 feet (4,000 m) in the La Sal Mountains to 3,000 feet (910 m) at Lake Powell, an elevation change of 10,000 feet (3,000 m). The county is cut by deep and spectacular canyons, red rock and mountain meadows, desert, and evergreen forest. The towns run primarily on a north/south axis along U.S. Route 191 and U.S. Route 163 from La Sal in the north to Monument Valley in the south.
Natural resources

The only operating Uranium Processing plant in the United States operates in the town of Blanding, population 3,375.
San Juan County is home to numerous oil and gas fields that produce primarily from the Desert Creek and Ismay Formations.
Adjacent counties
- Grand County (north)
- Mesa County, Colorado (northeast)
- Montrose County, Colorado (northeast)
- San Miguel County, Colorado (east)
- Dolores County, Colorado (east)
- Montezuma County, Colorado (east)
- San Juan County, New Mexico (southeast)
- Apache County, Arizona (south)
- Navajo County, Arizona (south)
- Coconino County, Arizona (southwest)
- Kane County (west)
- Garfield County (west)
- Wayne County (west)
- Emery County (northwest)
San Juan County is bordered by more counties than any other county in the United States, at 14.
National protected areas
Major highways
| Historical population | |||
|---|---|---|---|
| Census | Pop. | %± | |
| 1880 | 204 | — | |
| 1890 | 365 | 78.9% | |
| 1900 | 1,023 | 180.3% | |
| 1910 | 2,377 | 132.4% | |
| 1920 | 3,379 | 42.2% | |
| 1930 | 3,496 | 3.5% | |
| 1940 | 4,712 | 34.8% | |
| 1950 | 5,315 | 12.8% | |
| 1960 | 9,040 | 70.1% | |
| 1970 | 9,606 | 6.3% | |
| 1980 | 12,253 | 27.6% | |
| 1990 | 12,621 | 3.0% | |
| 2000 | 14,413 | 14.2% | |
| 2010 | 14,746 | 2.3% | |
| Est. 2016 | 16,895 | [4] | 14.6% |
| U.S. Decennial Census[5] 1790–1960[6] 1900–1990[7] 1990–2000[8] 2010–2014[1] | |||
Demographics
As of the current census[9] of 2010, there were 14,746 people and 4,505 households. The racial and ethnic composition of the population was 50.4% Native American, 45.8% white, 0.3% Asian, 0.2% African American and 2.3% reporting two or more races. 4.4% of the population was Hispanic or Latino of any race.[10]
The 2000 census there were 14,413 people, 4,089 households and 3,234 families residing in the county. The population density was 2 people per square mile (1/km²). There were 5,449 housing units at an average density of 1 per square mile (0/km²). The racial makeup of the county was 40.77% White, 0.12% Black or African American, 55.69% Native American, 0.17% Asian, 0.03% Pacific Islander, 1.70% from other races, and 1.51% from two or more races. 3.75% of the population were Hispanic or Latino of any race.
In the 2000 census, there were 4,089 households out of which 47.00% had children under the age of 18 living with them, 60.40% were married couples living together, 14.10% had a female householder with no husband present, and 20.90% were non-families. 18.70% of all households were made up of individuals and 6.70% had someone living alone who was 65 years of age or older. The average household size was 3.46 and the average family size was 4.02.
In the county, the population was spread out with 39.30% under the age of 18, 10.00% from 18 to 24, 25.20% from 25 to 44, 17.10% from 45 to 64, and 8.40% who were 65 years of age or older. The median age was 26 years. For every 100 females there were 99.50 males. For every 100 females age 18 and over, there were 94.90 males.
The median income for a household in the county was $28,137, and the median income for a family was $31,673. Males had a median income of $31,497 versus $19,617 for females. The per capita income for the county was $10,229. About 26.90% of families and 31.40% of the population were below the poverty line, including 34.70% of those under age 18 and 35.10% of those age 65 or over.
As of 2017, San Juan County is the poorest county in the state.[11]
Politics
San Juan County has not supported a Democrat for president since Franklin D. Roosevelt in 1936. However the county is slightly more competitive at the state level due to its high Native American population, who lean Democrat, and the comparatively small Mormon population which leans Republican, as well its economic distress. Notably, San Juan voted for the Democratic candidates in the 1988 and 2000 gubernatorial elections, both of which Republicans won. The area also votes less Republican than the rest of Utah in national elections. In 2004, for example, George W. Bush won 60.02% in San Juan County versus 71.54% in the state as a whole. Federally mandated commissioner districts put many Navajo voters in one district. The San Juan County Board of Commissioners has been majority white for many years. In 2016, a Federal District Court decision found voting districts violated the 1965 Voting Rights Act and the U.S. Constitution. The County was afraid to redraw district boundaries because they were put in place by a Federal Judge. Before this the County used an at large voting system to elect commissioners [12]
| Year | Republican | Democratic | Third parties |
|---|---|---|---|
| 2016 | 47.8% 2,645 | 36.9% 2,042 | 15.3% 847 |
| 2012 | 57.9% 3,074 | 40.3% 2,139 | 1.8% 94 |
| 2008 | 51.4% 2,638 | 46.9% 2,406 | 1.7% 86 |
| 2004 | 60.0% 2,971 | 38.5% 1,906 | 1.5% 73 |
| 2000 | 57.4% 2,721 | 38.7% 1,838 | 3.9% 185 |
| 1996 | 51.4% 2,139 | 40.2% 1,675 | 8.4% 351 |
| 1992 | 46.2% 2,004 | 37.8% 1,639 | 16.0% 692 |
| 1988 | 62.0% 2,377 | 36.7% 1,407 | 1.4% 53 |
| 1984 | 69.1% 2,598 | 30.5% 1,145 | 0.4% 15 |
| 1980 | 76.0% 2,774 | 20.9% 763 | 3.1% 113 |
| 1976 | 57.6% 1,856 | 36.7% 1,182 | 5.7% 184 |
| 1972 | 68.3% 1,893 | 24.4% 677 | 7.3% 203 |
| 1968 | 59.7% 1,393 | 29.1% 680 | 11.2% 262 |
| 1964 | 58.0% 1,371 | 42.0% 993 | |
| 1960 | 62.7% 1,408 | 37.3% 837 | |
| 1956 | 72.5% 1,119 | 27.5% 425 | |
| 1952 | 67.5% 876 | 32.5% 421 | |
| 1948 | 56.8% 558 | 42.5% 418 | 0.7% 7 |
| 1944 | 58.2% 513 | 41.7% 367 | 0.1% 1 |
| 1940 | 50.4% 528 | 49.2% 515 | 0.4% 4 |
| 1936 | 45.0% 432 | 54.1% 520 | 0.9% 9 |
| 1932 | 48.9% 460 | 48.8% 459 | 2.2% 21 |
| 1928 | 65.6% 449 | 33.7% 231 | 0.7% 5 |
| 1924 | 56.9% 380 | 34.7% 232 | 8.4% 56 |
| 1920 | 64.8% 523 | 32.2% 260 | 3.0% 24 |
| 1916 | 31.5% 213 | 66.3% 448 | 2.2% 15 |
| 1912 | 37.2% 146 | 37.2% 146 | 25.5% 100 |
| 1908 | 53.1% 130 | 44.5% 109 | 2.5% 6 |
| 1904 | 78.5% 135 | 20.9% 36 | 0.6% 1 |
| 1900 | 51.9% 81 | 46.2% 72 | 1.9% 3 |
| 1896 | 4.6% 8 | 95.4% 167 |
Communities
Cities
- Blanding
- Monticello (county seat)
Census-designated places
See also
References
- 1 2 "State & County QuickFacts". United States Census Bureau. Retrieved December 29, 2013.
- ↑ "Find a County". National Association of Counties. Retrieved 2011-06-07.
- ↑ "2010 Census Gazetteer Files". United States Census Bureau. August 22, 2012. Retrieved June 25, 2015.
- ↑ "Population and Housing Unit Estimates". Retrieved June 9, 2017.
- ↑ "U.S. Decennial Census". United States Census Bureau. Retrieved June 25, 2015.
- ↑ "Historical Census Browser". University of Virginia Library. Retrieved June 25, 2015.
- ↑ Forstall, Richard L., ed. (June 25, 1995). "Population of Counties by Decennial Census: 1900 to 1990". United States Census Bureau. Retrieved March 27, 2015.
- ↑ "Census 2000 PHC-T-4. Ranking Tables for Counties: 1990 and 2000" (PDF). United States Census Bureau. April 2, 2001. Retrieved June 25, 2015.
- ↑ "American FactFinder". United States Census Bureau. Retrieved 2011-05-14.
- ↑ Census QuickFacts page for San Juan County accessed June 7, 2012
- ↑ Weir, Bill (December 4, 2017). "Trump shrinks Utah monuments in historic move". CNN. Retrieved 5 December 2017.
- ↑ Krista Langlois (June 13, 2011). "How a Utah county silenced Native American voters — and how Navajos are fighting back A series of lawsuits could help counteract decades of racist practices". US Courts. Retrieved June 20, 2016.
- ↑ Leip, David. "Dave Leip's Atlas of U.S. Presidential Elections". uselectionatlas.org. Retrieved 2018-03-31.
External links
| Wikimedia Commons has media related to San Juan County, Utah. |
- Official website
Places adjacent to San Juan County, Utah | |
|---|---|
Municipalities and communities of San Juan County, Utah, United States | ||
|---|---|---|
| Cities | | |
| CDPs | ||
| Unincorporated community | ||
| Indian reservations | ||
| Ghost towns | ||
| Footnotes | ‡This populated place also has portions in an adjacent county or counties | |