Valencia County, New Mexico
| Valencia County, New Mexico | |
|---|---|
 Valencia County Courthouse in Los Lunas | |
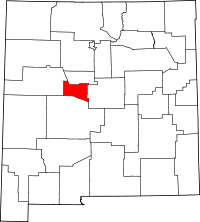 Location in the U.S. state of New Mexico | |
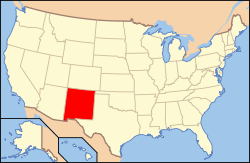 New Mexico's location in the U.S. | |
| Founded | January 9, 1852 |
| Seat | Los Lunas |
| Largest village | Belen |
| Area | |
| • Total | 1,068 sq mi (2,766 km2) |
| • Land | 1,066 sq mi (2,761 km2) |
| • Water | 2.1 sq mi (5 km2), 0.2% |
| Population (est.) | |
| • (2016) | 75,626 |
| • Density | 72/sq mi (28/km2) |
| Congressional districts | 1st, 2nd |
| Time zone | Mountain: UTC−7/−6 |
| Website |
www |
Valencia County is a county in the U.S. state of New Mexico. As of the 2010 census, the population was 76,569.[1] The county seat is Los Lunas.[2]
Valencia County is included in the Albuquerque, NM Metropolitan Statistical Area.
Valencia County has the longest record for predicting presidential election winners in the entire country, voting for the winning candidate in every election since 1952.
History
The county, which was formerly much larger in area, lost almost 81 percent of its territory on 19 June, 1981, upon the creation of Cibola County, which occupies the westernmost portion of Valencia County's former area.
Geography
According to the U.S. Census Bureau, the county has a total area of 1,068 square miles (2,770 km2), of which 1,066 square miles (2,760 km2) is land and 2.1 square miles (5.4 km2) (0.2%) is water.[3] It is the second-smallest county in New Mexico by area.
Adjacent counties
- Bernalillo County - north
- Torrance County - east
- Socorro County - south
- Cibola County - west
National protected areas
Demographics
| Historical population | |||
|---|---|---|---|
| Census | Pop. | %± | |
| 1910 | 13,320 | — | |
| 1920 | 13,795 | 3.6% | |
| 1930 | 16,186 | 17.3% | |
| 1940 | 20,245 | 25.1% | |
| 1950 | 22,481 | 11.0% | |
| 1960 | 39,085 | 73.9% | |
| 1970 | 40,539 | 3.7% | |
| 1980 | 61,115 | 50.8% | |
| 1990 | 45,235 | −26.0% | |
| 2000 | 66,152 | 46.2% | |
| 2010 | 76,569 | 15.7% | |
| Est. 2016 | 75,626 | [4] | −1.2% |
| U.S. Decennial Census[5] 1790-1960[6] 1900-1990[7] 1990-2000[8] 2010-2016[1] | |||
2000 census
As of the 2000 census[9], there were 66,152 people, 22,681 households, and 17,350 families residing in the county. The population density was 62 people per square mile (24/km²). There were 24,643 housing units at an average density of 23 per square mile (9/km²). The racial makeup of the county was 66.51% White, 1.27% Black or African American, 3.30% Native American, 0.36% Asian, 0.09% Pacific Islander, 23.93% from other races, and 4.55% from two or more races. 54.98% of the population were Hispanic or Latino of any race.
There were 22,681 households out of which 39.60% had children under the age of 18 living with them, 57.20% were married couples living together, 13.10% had a female householder with no husband present, and 23.50% were non-families. 18.80% of all households were made up of individuals and 6.40% had someone living alone who was 65 years of age or older. The average household size was 2.86 and the average family size was 3.25.
In the county, the population was spread out with 30.10% under the age of 18, 8.40% from 18 to 24, 29.60% from 25 to 44, 21.70% from 45 to 64, and 10.20% who were 65 years of age or older. The median age was 34 years. For every 100 females there were 100.70 males. For every 100 females age 18 and over, there were 99.10 males.
The median income for a household in the county was $34,099, and the median income for a family was $37,157. Males had a median income of $30,339 versus $23,132 for females. The per capita income for the county was $14,747. About 13.50% of families and 16.80% of the population were below the poverty line, including 22.30% of those under age 18 and 10.80% of those age 65 or over.
2010 census
As of the 2010 census, there were 76,569 people, 27,500 households, and 19,967 families residing in the county.[10] The population density was 71.8 inhabitants per square mile (27.7/km2). There were 30,085 housing units at an average density of 28.2 per square mile (10.9/km2).[11] The racial makeup of the county was 73.2% white, 3.8% American Indian, 1.4% black or African American, 0.5% Asian, 0.1% Pacific islander, 17.0% from other races, and 4.0% from two or more races. Those of Hispanic or Latino origin made up 58.3% of the population.[10] In terms of ancestry, 10.9% were German, 6.7% were English, 6.1% were Irish, and 4.2% were American.[12]
Of the 27,500 households, 37.1% had children under the age of 18 living with them, 51.8% were married couples living together, 13.9% had a female householder with no husband present, 27.4% were non-families, and 22.1% of all households were made up of individuals. The average household size was 2.73 and the average family size was 3.18. The median age was 37.7 years.[10]
The median income for a household in the county was $42,044 and the median income for a family was $48,767. Males had a median income of $41,511 versus $32,584 for females. The per capita income for the county was $19,955. About 15.7% of families and 19.4% of the population were below the poverty line, including 29.7% of those under age 18 and 12.5% of those age 65 or over.[13]
Communities
Cities
Towns
Villages
- Bosque Farms
- Los Lunas (county seat)
Census-designated places
Unincorporated communities
Politics
| Year | Republican | Democratic | Third parties |
|---|---|---|---|
| 2016 | 47.9% 13,215 | 39.3% 10,841 | 12.8% 3,536 |
| 2012 | 46.3% 12,825 | 48.7% 13,511 | 5.0% 1,392 |
| 2008 | 45.5% 13,136 | 53.2% 15,366 | 1.4% 397 |
| 2004 | 55.6% 14,474 | 43.3% 11,270 | 1.0% 268 |
| 2000 | 50.5% 10,803 | 45.9% 9,819 | 3.5% 755 |
| 1996 | 42.0% 7,779 | 49.4% 9,169 | 8.6% 1,597 |
| 1992 | 37.6% 6,305 | 44.7% 7,495 | 17.7% 2,968 |
| 1988 | 51.8% 7,874 | 47.0% 7,136 | 1.3% 190 |
| 1984 | 60.3% 8,474 | 38.4% 5,393 | 1.3% 182 |
| 1980 | 58.4% 11,177 | 36.0% 6,886 | 5.6% 1,079 |
| 1976 | 47.4% 7,851 | 51.8% 8,566 | 0.8% 136 |
| 1972 | 56.1% 8,239 | 41.6% 6,110 | 2.3% 339 |
| 1968 | 47.5% 5,676 | 46.2% 5,513 | 6.4% 758 |
| 1964 | 33.6% 3,950 | 66.0% 7,757 | 0.4% 50 |
| 1960 | 41.2% 4,929 | 58.8% 7,043 | 0.0% 4 |
| 1956 | 56.7% 4,663 | 43.2% 3,547 | 0.1% 8 |
| 1952 | 53.5% 3,810 | 46.5% 3,310 | 0.1% 5 |
| 1948 | 52.7% 3,280 | 46.8% 2,914 | 0.5% 33 |
| 1944 | 52.9% 2,765 | 47.1% 2,461 | 0.1% 3 |
| 1940 | 50.8% 3,436 | 49.1% 3,318 | 0.1% 6 |
| 1936 | 46.8% 2,941 | 53.0% 3,336 | 0.2% 14 |
| 1932 | 59.3% 3,263 | 40.5% 2,229 | 0.3% 15 |
| 1928 | 79.9% 3,500 | 20.1% 881 | 0.0% 1 |
| 1924 | 78.0% 3,183 | 16.6% 678 | 5.4% 219 |
| 1920 | 74.6% 2,839 | 25.0% 951 | 0.4% 16 |
| 1916 | 79.5% 1,540 | 19.8% 383 | 0.7% 14 |
| 1912 | 77.3% 1,263 | 14.1% 231 | 8.6% 141 |
See also
References
- Specific
- 1 2 "State & County QuickFacts". United States Census Bureau. Retrieved September 30, 2013.
- ↑ "Find a County". National Association of Counties. Retrieved June 7, 2011.
- ↑ "2010 Census Gazetteer Files". United States Census Bureau. August 22, 2012. Archived from the original on January 1, 2015. Retrieved January 2, 2015.
- ↑ "Population and Housing Unit Estimates". Retrieved June 9, 2017.
- ↑ "U.S. Decennial Census". United States Census Bureau. Retrieved January 2, 2015.
- ↑ "Historical Census Browser". University of Virginia Library. Retrieved January 2, 2015.
- ↑ "Population of Counties by Decennial Census: 1900 to 1990". United States Census Bureau. Retrieved January 2, 2015.
- ↑ "Census 2000 PHC-T-4. Ranking Tables for Counties: 1990 and 2000" (PDF). United States Census Bureau. Retrieved January 2, 2015.
- ↑ "American FactFinder". United States Census Bureau. Retrieved January 31, 2008.
- 1 2 3 "DP-1 Profile of General Population and Housing Characteristics: 2010 Demographic Profile Data". United States Census Bureau. Retrieved 2016-01-24.
- ↑ "Population, Housing Units, Area, and Density: 2010 - County". United States Census Bureau. Retrieved 2016-01-24.
- ↑ "DP02 SELECTED SOCIAL CHARACTERISTICS IN THE UNITED STATES – 2006-2010 American Community Survey 5-Year Estimates". United States Census Bureau. Retrieved 2016-01-24.
- ↑ "DP03 SELECTED ECONOMIC CHARACTERISTICS – 2006-2010 American Community Survey 5-Year Estimates". United States Census Bureau. Retrieved 2016-01-24.
- ↑ Leip, David. "Dave Leip's Atlas of U.S. Presidential Elections". uselectionatlas.org. Retrieved 2018-04-02.
- General
- County status and boundary changes United States Census Bureau
Places adjacent to Valencia County, New Mexico | ||||||||||
|---|---|---|---|---|---|---|---|---|---|---|
| ||||||||||
Municipalities and communities of Valencia County, New Mexico, United States | ||
|---|---|---|
| Cities | | |
| Town | ||
| Villages | ||
| CDPs | ||
| Unincorporated community | ||
Santa Fe (capital) | ||
| Topics |
| |
| Society | ||
| Regions |
| |
| Cities | ||
| Counties | ||