Kings County, California
| Kings County, California | |||
|---|---|---|---|
| County | |||
| County of Kings | |||
 | |||
| |||
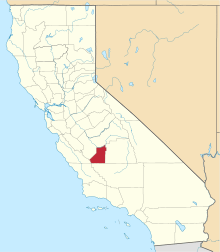 Location in the state of California | |||
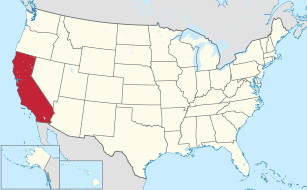 California's location in the United States | |||
| Country |
| ||
| State |
| ||
| Region | San Joaquin Valley | ||
| Metropolitan area | Hanford-Corcoran | ||
| Established | March 22, 1893[1] | ||
| Named for | Kings River | ||
| County seat | Hanford | ||
| Largest city | Hanford | ||
| Area | |||
| • Total | 1,392 sq mi (3,610 km2) | ||
| • Land | 1,389 sq mi (3,600 km2) | ||
| • Water | 2.1 sq mi (5 km2) | ||
| Population (April 1, 2010)[2] | |||
| • Total | 152,982 | ||
| • Estimate (2017)[3] | 149,537 | ||
| • Density | 110/sq mi (42/km2) | ||
| Time zone | UTC−8 (Pacific Time Zone) | ||
| • Summer (DST) | UTC−7 (Pacific Daylight Time) | ||
| Area code | 559 | ||
| FIPS code | 06-031 | ||
| GNIS feature ID | 277280 | ||
| Website | countyofkings.com | ||
Kings County is a county in the U.S. state of California. The population was 152,982 at the 2010 census.[4] The California Department of Finance estimated the county's population was 149,537 as of January 1, 2017.[5] The county seat is Hanford.[6]
Kings County comprises the Hanford-Corcoran, CA metropolitan statistical area, which is also included in the Visalia-Porterville-Hanford, CA combined statistical area. It is in the San Joaquin Valley, a rich agricultural region.
History
The area was inhabited for thousands of years by American Indians including the Tachi Yokuts tribe.[7] It was colonized by Spain, Mexico and the United States.
An 1805 expedition probably led by Spanish Army Lieutenant Gabriel Moraga recorded discovering the river, which they named El Rio de los Santos Reyes (River of the Holy Kings) after the Three Wise Men of the Bible.[8] At the time of the United States conquest of California in 1848, the new government changed the name to Kings River after which the county was named.[8]
In 1880, a dispute over land titles between settlers and the Southern Pacific Railroad resulted in a bloody gun battle on a farm 5.6 mi (9.0 km) northwest of Hanford; seven men died. This event became known as the Mussel Slough Tragedy.
Kings County was formed in 1893 from the western part of Tulare County.[8] In 1909, by an act of the state legislature, 208 square miles (540 km2) of Fresno County territory was added to the northwest portion of Kings County.[9]
Settlers reclaimed Tulare Lake and its wetlands for agricultural development. In surface area, it was formerly the largest body of freshwater west of the Great Lakes, and supported a large population of migratory birds as well as local birds and wildlife. Monoculture has sharply reduced habitat for many species.
In 1928, oil was discovered in the Kettleman Hills located in the southwestern part of Kings County. The Kettleman North Dome Oil Field became one of the most productive oil fields in the United States.[10]
In 1933 during the Great Depression, over 18,000 cotton pickers in the southern San Joaquin Valley, mostly migrant Mexican workers, went on strike. During the strike, 3,500 striking farm workers lived in a four-acre camp on the land of a small farmer on the outskirts of Corcoran. Ultimately, the federal government intervened to force both sides to negotiate a settlement.[11]
Lemoore Army Airfield was established for training and defense during World War II. In 1961, the U.S. Navy opened NAS Lemoore 9 miles (14 km) west of Lemoore, not far from the earlier site.
The completion of the California Aqueduct in the early 1970s brought needed water for agriculture and domestic use to the west side of the county.
Historic sites
Geography
According to the U.S. Census Bureau, the county has a total area of 1,392 square miles (3,610 km2), of which 1,389 square miles (3,600 km2) is land and 2.1 square miles (5.4 km2) (0.2%) is water.[12]
Kings County is bordered on the north and northwest by Fresno County, on the east by Tulare County, on the south by Kern County and a small part of San Luis Obispo County and on the west by Monterey County.
Most of the historic Tulare Lake was within Kings County. Although reclaimed for farming late in the 19th century, it was the largest freshwater lake west of the Great Lakes.
Demographics
2011
| Population, race, and income | |||||
|---|---|---|---|---|---|
| Total population[13] | 152,335 | ||||
| White[13] | 109,704 | 72.0% | |||
| Black or African American[13] | 10,988 | 7.2% | |||
| American Indian or Alaska Native[13] | 1,927 | 1.3% | |||
| Asian[13] | 5,751 | 3.8% | |||
| Native Hawaiian or other Pacific Islander[13] | 353 | 0.2% | |||
| Some other race[13] | 17,832 | 11.7% | |||
| Two or more races[13] | 5,780 | 3.8% | |||
| Hispanic or Latino (of any race)[14] | 76,401 | 50.2% | |||
| Per capita income[15] | $18,296 | ||||
| Median household income[16] | $48,838 | ||||
| Median family income[17] | $51,932 | ||||
Places by population, race, and income
| Places by population and race | ||||||||
|---|---|---|---|---|---|---|---|---|
| Place | Type[18] | Population[13] | White[13] | Other[13] [note 1] |
Asian[13] | Black or African American[13] |
Native American[13] [note 2] |
Hispanic or Latino (of any race)[14] |
| Armona | CDP | 3,419 | 74.1% | 11.9% | 4.6% | 8.9% | 0.6% | 58.6% |
| Avenal | City | 15,705 | 73.1% | 23.1% | 0.3% | 3.1% | 0.4% | 86.4% |
| Corcoran | City | 25,113 | 59.8% | 23.8% | 2.0% | 12.2% | 2.3% | 63.0% |
| Grangeville | CDP | 464 | 95.7% | 4.3% | 0.0% | 0.0% | 0.0% | 19.0% |
| Hanford | City | 53,159 | 76.2% | 11.9% | 4.6% | 6.7% | 0.6% | 44.3% |
| Hardwick | CDP | 107 | 33.6% | 64.5% | 1.9% | 0.0% | 0.0% | 64.5% |
| Home Garden | CDP | 1,726 | 59.4% | 18.3% | 0.9% | 16.7% | 4.7% | 59.1% |
| Kettleman City | CDP | 1,207 | 80.9% | 14.5% | 0.0% | 0.0% | 4.6% | 100.0% |
| Lemoore | City | 24,217 | 68.2% | 14.4% | 6.5% | 8.7% | 2.3% | 36.2% |
| Lemoore Station | CDP | 7,129 | 69.2% | 11.1% | 9.9% | 9.5% | 0.3% | 17.2% |
| Stratford | CDP | 1,436 | 68.7% | 30.6% | 0.0% | 0.7% | 0.0% | 91.9% |
| Places by population and income | |||||
|---|---|---|---|---|---|
| Place | Type[18] | Population[19] | Per capita income[15] | Median household income[16] | Median family income[17] |
| Armona | CDP | 3,419 | $16,047 | $42,122 | $41,991 |
| Avenal | City | 15,705 | $9,889 | $29,183 | $28,030 |
| Corcoran | City | 25,113 | $8,308 | $31,641 | $33,904 |
| Grangeville | CDP | 464 | $27,003 | $46,979 | $52,989 |
| Hanford | City | 53,159 | $22,383 | $54,421 | $61,532 |
| Hardwick | CDP | 107 | $11,256 | $19,167 | $19,306 |
| Home Garden | CDP | 1,726 | $12,328 | $38,125 | $36,488 |
| Kettleman City | CDP | 1,207 | $15,081 | $34,323 | $35,313 |
| Lemoore | City | 24,217 | $23,045 | $58,706 | $63,539 |
| Lemoore Station | CDP | 7,129 | $16,887 | $42,225 | $43,023 |
| Stratford | CDP | 1,436 | $10,531 | $40,871 | $29,716 |
2010
| Historical population | |||
|---|---|---|---|
| Census | Pop. | %± | |
| 1900 | 9,871 | — | |
| 1910 | 16,230 | 64.4% | |
| 1920 | 22,031 | 35.7% | |
| 1930 | 25,385 | 15.2% | |
| 1940 | 35,168 | 38.5% | |
| 1950 | 46,768 | 33.0% | |
| 1960 | 49,954 | 6.8% | |
| 1970 | 64,610 | 29.3% | |
| 1980 | 73,738 | 14.1% | |
| 1990 | 101,469 | 37.6% | |
| 2000 | 129,461 | 27.6% | |
| 2010 | 152,982 | 18.2% | |
| Est. 2017 | 150,101 | [3] | −1.9% |
| U.S. Decennial Census[20] 1790–1960[21] 1900–1990[22] 1990–2000[23] 2010–2015[4] | |||
The 2010 United States Census reported that Kings County had a population of 152,982. The census included inmates of the three men's state prisons. According to the California Department of Corrections and Rehabilitation, there were 18,640 inmates in Kings County prisons on March 31, 2010, which was 12.2% of the population.[24] The inmate population had been reduced to 13,894 on December 31, 2013.[24] The racial makeup of Kings County was 83,027 (54.3%) White, 11,014 (7.2%) African American, 2,562 (1.7%) Native American, 5,620 (3.7%) Asian, 271 (0.2%) Pacific Islander, 42,996 (28.1%) from other races, and 7,492 (4.9%) from two or more races. Hispanic or Latino of any race were 77,866 persons (50.9%).[25]
The U.S. Census does not identify how many residents are undocumented immigrants. However, the Public Policy Institute of California issued a report in July 2011, which estimated there were 9,000 illegal immigrants living in Kings County in 2008, which would be 5.8% of the county’s population.[26]
According to the California Board of State and Community Corrections, Kings County had the highest incarceration rate of California's 58 counties in 2014 at 1,384 per 100,000 population. Statewide, the rate was 567 per 100,000.[27]
| Population reported at 2010 United States Census | |||||||||
|---|---|---|---|---|---|---|---|---|---|
Population | American | American | Islander | races | more races | or Latino (of any race) | |||
| Kings County | 152,982 | 83,027 | 11,014 | 2,562 | 5,620 | 271 | 42,996 | 7,492 | 77,866 |
city | Population | American | American | Islander | races | more races | or Latino (of any race) | ||
| Avenal | 15,505 | 6,044 | 1,625 | 186 | 108 | 6 | 7,188 | 348 | 11,130 |
| Corcoran | 24,813 | 8,940 | 3,725 | 349 | 193 | 17 | 10,979 | 610 | 15,545 |
| Hanford | 53,967 | 33,713 | 2,632 | 712 | 2,322 | 53 | 11,599 | 2,936 | 25,419 |
| Lemoore | 24,531 | 13,925 | 1,566 | 333 | 2,010 | 102 | 4,935 | 1,660 | 9,820 |
place | Population | American | American | Islander | races | more races | or Latino (of any race) | ||
| Armona | 4,156 | 2,058 | 99 | 64 | 85 | 13 | 1,597 | 240 | 2,784 |
| Grangeville | 469 | 393 | 15 | 5 | 5 | 0 | 41 | 10 | 145 |
| Hardwick | 138 | 63 | 5 | 0 | 0 | 0 | 67 | 3 | 86 |
| Home Garden | 1,761 | 652 | 221 | 63 | 50 | 8 | 677 | 90 | 1,189 |
| Kettleman City | 1,439 | 478 | 4 | 8 | 1 | 0 | 887 | 61 | 1,383 |
| Lemoore Station | 7,438 | 4,883 | 729 | 70 | 560 | 53 | 418 | 725 | 1,445 |
| Stratford | 1,277 | 574 | 16 | 17 | 19 | 1 | 617 | 33 | 1,069 |
communities | Population | American | American | Islander | races | more races | or Latino (of any race) | ||
| All others not CDPs (combined) | 17,488 | 11,304 | 377 | 755 | 267 | 18 | 3,991 | 776 | 7,851 |
2000
As of the 2000 census, there were 129,461 people, 34,418 households, and 26,983 families residing in the county. However, the California Department of Finance estimates that the population had grown 154,434 as of January 1, 2008.[28] The population density based on the 2000 census was 36/km² (93/sq mi). There were 36,563 housing units at an average density of 26 per square mile (10/km²). The racial makeup of the county was 53.7% White, 8.3% Black or African American, 1.7% Native American, 3.1% Asian, 0.2% Pacific Islander, 28.3% from other races, and 4.8% from two or more races. 43.6% of the population were Hispanic or Latino of any race. 7.1% were of Portuguese, 6.2% German, 5.3% Irish and 5.1% American ancestry according to Census 2000. 63.6% spoke English, 30.9% Spanish, 1.4% Tagalog, 1.4% Portuguese and 1.3% Samoan as their first language.
There were 34,418 households out of which 46.4% had children under the age of 18 living with them, 58.0% were married couples living together, 14.3% had a female householder with no husband present, and 21.6% were non-families. 17.0% of all households were made up of individuals and 6.8% had someone living alone who was 65 years of age or older. The average household size was 3.18 and the average family size was 3.56.
In the county, the population was spread out with 29.0% under the age of 18, 11.8% from 18 to 24, 35.0% from 25 to 44, 16.8% from 45 to 64, and 7.4% who were 65 years of age or older. The median age was 30 years in 2000, which had increased to 31.1 by the time of the 2010 census.[29] For every 100 females there were 134.8 males. For every 100 females age 18 and over, there were 148.8 males. The ratio may be attributed to the presence of three men's state prisons in the county.
Government and policing
Administration
Kings County is a general law county under the California Constitution. That is, it does not have a county charter. The county is governed by a five-member Board of Supervisors. Supervisors are elected by districts for four-year terms. There are no term limits in effect. The Chairman and Vice-Chairman are elected annually by the Board of Supervisors from among its members. On January 9, 2018, the Board elected Supervisor Richard Valle as Chairman and Supervisor Joe Neves as Vice-Chairman to serve during 2018. Other Supervisors include Craig Pederson, Richard Fagundes and Doug Verboon.[30] The Board of Supervisors appoints a County Administrative Officer. Rebecca Campbell was appointed to that office effective on January 1, 2018. She succeeded Larry Spikes who held the post from 1993 through 2017.[31][32][33]
Sheriff
The Kings County Sheriff provides court protection, county jail operation, and coroner services for the entire county. It provides patrol and detective services to the unincorporated areas of the county.
Municipal police departments
Within Kings county, there are four municipal police departments: Hanford (the county seat), Corcoran, Lemoore, and Avenal.
State and federal representation
In the California State Legislature, Kings County is in the 14th Senate District, represented by Republican Andy Vidak,[34] and in the 32nd Assembly District, represented by Democrat Rudy Salas.[35]
In the United States House of Representatives, Kings County is in California's 21st congressional district, represented by Republican David Valadao.[36]
Politics
Voter registration
According to the Kings County Election Office, as of March 24, 2017, 51,323 residents were registered to vote. There were 22,341 voters registered as Republicans, 17,429 registered as Democrats and 9,443 did not state a party preference. The remaining 2,104 registered with minor parties.[37]
| Population and registered voters | ||
|---|---|---|
| Total population[13] | 152,335 | |
| Registered voters[38][note 3] | 48,485 | 31.8% |
| Democratic[38] | 17,336 | 35.8% |
| Republican[38] | 21,893 | 45.2% |
| Democratic–Republican spread[38] | -4,557 | -9.4% |
| Independent[38] | 1,236 | 2.5% |
| Green[38] | 94 | 0.2% |
| Libertarian[38] | 214 | 0.4% |
| Peace and Freedom[38] | 86 | 0.2% |
| Americans Elect[38] | 2 | 0.0% |
| Other[38] | 161 | 0.3% |
| No party preference[38] | 7,463 | 15.4% |
Cities by population and voter registration
| Cities by population and voter registration | |||||||
|---|---|---|---|---|---|---|---|
| City | Population[13] | Registered voters[38] [note 3] |
Democratic[38] | Republican[38] | D–R spread[38] | Other[38] | No party preference[38] |
| Avenal | 15,705 | 10.7% | 53.7% | 26.7% | +27.0% | 5.3% | 16.4% |
| Corcoran | 25,113 | 17.1% | 57.4% | 26.3% | +31.1% | 4.8% | 13.4% |
| Hanford | 53,159 | 41.1% | 33.9% | 47.0% | -13.1% | 6.5% | 15.2% |
| Lemoore | 24,217 | 39.2% | 31.9% | 46.2% | -14.3% | 7.2% | 17.8% |
Overview
Kings has long been a strongly Republican county in Presidential elections. The last Democratic candidate for President to win the county was Hubert Humphrey in 1968, and the last to win a majority was Lyndon Johnson in 1964.
| Year | GOP | DEM | Others |
|---|---|---|---|
| 2016 | 52.73% 18,093 | 39.69% 13,617 | 7.58% 2,600 |
| 2012 | 56.24% 17,671 | 41.31% 12,979 | 2.44% 768 |
| 2008 | 56.14% 19,710 | 42.00% 14,747 | 1.85% 651 |
| 2004 | 65.41% 21,003 | 33.74% 10,833 | 0.85% 274 |
| 2000 | 57.80% 16,377 | 38.97% 11,041 | 3.24% 917 |
| 1996 | 47.91% 12,368 | 43.59% 11,254 | 8.50% 2,193 |
| 1992 | 41.61% 10,673 | 38.91% 9,982 | 19.48% 4,996 |
| 1988 | 56.41% 12,118 | 42.56% 9,142 | 1.03% 222 |
| 1984 | 64.10% 13,364 | 35.13% 7,324 | 0.77% 160 |
| 1980 | 55.37% 10,531 | 38.37% 7,299 | 6.26% 1,191 |
| 1976 | 49.65% 8,263 | 48.44% 8,061 | 1.91% 318 |
| 1972 | 56.52% 10,509 | 39.12% 7,274 | 4.37% 812 |
| 1968 | 43.07% 7,796 | 47.75% 8,643 | 9.18% 1,662 |
| 1964 | 30.54% 5,753 | 69.39% 13,073 | 0.07% 14 |
| 1960 | 42.31% 6,991 | 57.13% 9,439 | 0.56% 92 |
| 1956 | 42.28% 6,195 | 57.45% 8,417 | 0.27% 40 |
| 1952 | 49.19% 7,708 | 50.09% 7,850 | 0.72% 113 |
| 1948 | 37.23% 4,289 | 59.97% 6,909 | 2.80% 323 |
| 1944 | 34.22% 3,468 | 65.04% 6,591 | 0.74% 75 |
| 1940 | 31.75% 3,911 | 67.43% 8,307 | 0.83% 102 |
| 1936 | 23.67% 2,226 | 75.10% 7,062 | 1.23% 116 |
| 1932 | 26.72% 2,009 | 69.05% 5,191 | 4.23% 318 |
| 1928 | 51.51% 2,947 | 47.21% 2,701 | 1.28% 73 |
| 1924 | 50.00% 2,812 | 19.72% 1,109 | 30.29% 1,703 |
| 1920 | 59.61% 2,806 | 34.08% 1,604 | 6.31% 297 |
| 1916 | 39.65% 2,221 | 51.86% 2,905 | 8.50% 476 |
| 1912 | 0.00% 0 | 49.82% 1,967 | 50.18% 1,981 |
| 1908 | 53.22% 1,198 | 38.16% 859 | 8.62% 194 |
| 1904 | 58.67% 1,110 | 31.45% 595 | 9.88% 187 |
| 1900 | 51.76% 1,032 | 43.73% 872 | 4.51% 90 |
| 1896 | 43.06% 673 | 55.15% 862 | 1.79% 28 |
In November 2008, Kings County voted 73.7% for Proposition 8 which amended the California Constitution to define marriage as one man and one woman.
Crime
The following table includes the number of incidents reported and the rate per 1,000 persons for each type of offense.
| Population and crime rates | ||
|---|---|---|
| Population[13] | 152,335 | |
| Violent crime[40] | 562 | 3.69 |
| Homicide[40] | 4 | 0.03 |
| Forcible rape[40] | 32 | 0.21 |
| Robbery[40] | 77 | 0.51 |
| Aggravated assault[40] | 449 | 2.95 |
| Property crime[40] | 1,513 | 9.93 |
| Burglary[40] | 774 | 5.08 |
| Larceny-theft[40][note 4] | 1,428 | 9.37 |
| Motor vehicle theft[40] | 294 | 1.93 |
| Arson[40] | 30 | 0.20 |
Cities by population and crime rates
| Cities by population and crime rates | ||||||||
|---|---|---|---|---|---|---|---|---|
| City | Population[41] | Violent crimes[41] | Violent crime rate per 1,000 persons |
Property crimes[41] | Property crime rate per 1,000 persons | |||
| Avenal | 15,704 | 53 | 3.37 | 132 | 8.41 | |||
| Corcoran | 25,119 | 89 | 3.54 | 328 | 13.06 | |||
| Hanford | 54,787 | 309 | 5.64 | 1,711 | 31.23 | |||
| Lemoore | 24,904 | 131 | 5.26 | 698 | 28.03 | |||
Economy
The economy is based on agriculture. About 87% of Kings County's 890,000 acres is agricultural farmland. The gross value of all agricultural crops and products produced during 2017 in Kings County was $2,066,029,000. Kings County is 10th among California counties in agricultural production. The top commodity in 2017 was milk with a value of $676.6 millon. Other major agricultural commodities included cotton, cattle and calves, almonds and pistachios and tomatoes. These four commodities have been consistently at the top for the past 25 years.[42][43] Another major employer is NAS Lemoore, the U.S. Navy's newest and largest master jet base. According to a Navy study in 2008, payroll, base spending, retiree and veterans' checks total more than $1 billion in annual economic impact to the region.[44] Other important employers include a Del Monte Foods tomato processing plant, Adventist Health, the J. G. Boswell Company, an Olam International tomato processing facility, Leprino Foods, the largest mozzarella cheese maker in the world, the Kings County Government and the California Department of Corrections and Rehabilitation which operates three state prisons in Kings County.[45]
In 2011-2013, the U.S. Census Bureau estimated that the median household income in the county was $47,035 and that 17.6% of the population was below the poverty line.[46] In 2016, according to the U.S. Bureau of Economic Analysis, average per capita income was $32,287 in Kings County, which ranked it 56th of California's 58 counties.[47] According to the California Department of Finance, in 2012, the median household income was $45,935 and 17.3% of households were below the poverty line.[48]
The homeownership rate was 54.2% at the time of the 2010 census.[29] According to Zillow Real Estate Research, an estimated 24% of homeowners in the county owned their homes free and clear in the third quarter of 2012.[49]
Taxable sales in 2015 totaled about $1.7 billion.[50]
Kings County did not escape the effects of the Great Recession. The unemployment rate in May 2012 was 14.9%, up from 10.1% in July 2008. However, the rate had dropped to 6.9% in May 2018.[51] According to the California Employment Development Department, as of December 2012, civilian employment totaled 53,100 and an additional 8,900 people were unemployed. Many residents of Kings County were employed in services (31,900 persons, including 14,800 government employees) and agriculture (5,500 employees) as well as in some manufacturing enterprises (4,300 employees) and construction (1,000 employees).[52] Jeffrey Michael, director of the Business Forecasting Center at the University of the Pacific, stated in an October 2010 newspaper interview that nearly half of Kings County's personal earnings come from government jobs, which pay more than agricultural employment. From 2007 to 2009, government jobs held steady while the county's agricultural sector took the biggest hit.
Kings County's dairy industry dropped from $670 million in milk sold in 2008 to $411 million in 2009 - a 39% drop.[53] By mid-2009, the price paid to milk producers had dropped to a point that was far below the cost of production according to a July 2009 quote from Bill Van Dam, CEO of the Alliance of Western Milk Producers.[54] By December 2010, milk prices had increased to about $13 per hundredweight from a low of below $10 in 2009. However, the price of corn used for feed had increased because of its use by the ethanol industry. Van Dam was quoted that month as saying that at current prices, dairy operators are at or close to the break-even point.[55] By the summer of 2012, it was reported that despite a milk price of about $15 per hundredweight, the rising cost of cattle feed had caused many dairy farmers to sell all or part of their herds and even file for bankruptcy.[56] In 2014, milk prices were topping $22 per hundredweight and the value of milk sold rose to $970 million in that year.[57] However, by March 2016 milk was reportedly selling closer to $13 per hundredweight.[58]
Culture
Kings County has a large annual celebration held each May called Kings County Homecoming Week.[59] In 2015, the event was scaled back to one day and renamed Pioneer Days.[60] The event returned as Kings County Homecoming Week in 2016 but without the traditional parade.[61]
Transportation
Major highways
Public transportation
Kings Area Rural Transit (KART) operates regularly scheduled fixed route bus service, vanpool service for commuters and Dial-A-Ride (demand response) services throughout Kings County as well as to Fresno.[62]
Amtrak trains stop in Corcoran and Hanford.
Orange Belt Stages provides inter-city bus service to and from Hanford. Connections with Greyhound can be made in Visalia or Paso Robles.
Airports
Hanford Municipal Airport is a general aviation airport located just southeast of Hanford. The privately owned airport in Avenal is the home of the Central California Soaring Club.[63]
Communities
Incorporated cities
Census-designated places
Unincorporated communities
- Acebedo
- Cimarron
- Gepford
- Guernsey
- Halls Corner
- Hamblin
- Helm Corner
- Hub
- Hydril
- Island District
- Kettleman Station
- Lakeside
- Lucerne
- Murray
- Pitco
- Reef Station
- Remnoy
- Rossi
- Shell
- Shirley
- South Corcoran
- Vanguard
Formerly proposed new city
Native American Reservation
Population ranking
The population ranking of the following table is based on the 2010 census of Kings County.[64]
† county seat
| Rank | City/Town/etc. | Municipal type | Population (2010 Census)
|
|---|---|---|---|
| 1 | † Hanford | City | 53,967 |
| 2 | Corcoran | City | 24,813 |
| 3 | Lemoore | City | 24,531 |
| 4 | Avenal | City | 15,505 |
| 5 | Lemoore Station | CDP | 7,438 |
| 6 | Armona | CDP | 4,156 |
| 7 | Home Garden | CDP | 1,761 |
| 8 | Kettleman City | CDP | 1,439 |
| 9 | Stratford | CDP | 1,277 |
| 10 | Santa Rosa Rancheria[65] | AIAN | 652 |
| 11 | Grangeville | CDP | 469 |
| 12 | Hardwick | CDP | 138 |
See also
Notes
- ↑ Other = Some other race + Two or more races
- ↑ Native American = Native Hawaiian or other Pacific Islander + American Indian or Alaska Native
- 1 2 Percentage of registered voters with respect to total population. Percentages of party members with respect to registered voters follow.
- ↑ Only larceny-theft cases involving property over $400 in value are reported as property crimes.
References
- ↑ "Kings County". Geographic Names Information System. United States Geological Survey.
- ↑ "American Fact Finder - Results". United States Census Bureau. Retrieved April 1, 2015.
- 1 2 "Population and Housing Unit Estimates". Retrieved June 9, 2017.
- 1 2 "State & County QuickFacts". United States Census Bureau. Retrieved April 4, 2016.
- ↑ http://dof.ca.gov/Forecasting/Demographics/Estimates/E-1/ accessed December 17, 2017
- ↑ "Find a County". National Association of Counties. Archived from the original on 2011-05-31. Retrieved 2011-06-07.
- ↑ "Tachi Yokut Tribe – The Indians of the San Joaquin Valley were known as Yokuts". Tachi-yokut-nsn.gov. Retrieved 7 November 2017.
- 1 2 3 Hoover, p. 132
- ↑ Brown, Robert L. (1940). History of Kings County. A. H. Cawston. p. 53.
- ↑ Brown, Robert L. (1940). History of Kings County. A. H. Cawston. p. 123.
- ↑ Weber, Devra (1994). Dark Sweat. White Gold: California Farm Workers, Cotton and the New Deal. Berkeley and Los Angeles, California: University of California Press. pp. 79–111. ISBN 0-520-20710-6.
- ↑ "2010 Census Gazetteer Files". United States Census Bureau. August 22, 2012. Retrieved September 26, 2015.
- 1 2 3 4 5 6 7 8 9 10 11 12 13 14 15 16 17 U.S. Census Bureau. American Community Survey, 2011 American Community Survey 5-Year Estimates, Table B02001. American FactFinder. Retrieved 2013-10-26.
- 1 2 U.S. Census Bureau. American Community Survey, 2011 American Community Survey 5-Year Estimates, Table B03003. American FactFinder. Retrieved 2013-10-26.
- 1 2 U.S. Census Bureau. American Community Survey, 2011 American Community Survey 5-Year Estimates, Table B19301. American FactFinder. Retrieved 2013-10-21.
- 1 2 U.S. Census Bureau. American Community Survey, 2011 American Community Survey 5-Year Estimates, Table B19013. American FactFinder. Retrieved 2013-10-21.
- 1 2 U.S. Census Bureau. American Community Survey, 2011 American Community Survey 5-Year Estimates, Table B19113. American FactFinder. Retrieved 2013-10-21.
- 1 2 U.S. Census Bureau. American Community Survey, 2011 American Community Survey 5-Year Estimates. American FactFinder. Retrieved 2013-10-21.
- ↑ U.S. Census Bureau. American Community Survey, 2011 American Community Survey 5-Year Estimates, Table B01003. American FactFinder. Retrieved 2013-10-21.
- ↑ "U.S. Decennial Census". United States Census Bureau. Archived from the original on May 12, 2015. Retrieved September 26, 2015.
- ↑ "Historical Census Browser". University of Virginia Library. Retrieved September 26, 2015.
- ↑ Forstall, Richard L., ed. (March 27, 1995). "Population of Counties by Decennial Census: 1900 to 1990". United States Census Bureau. Retrieved September 26, 2015.
- ↑ "Census 2000 PHC-T-4. Ranking Tables for Counties: 1990 and 2000" (PDF). United States Census Bureau. April 2, 2001. Retrieved September 26, 2015.
- 1 2 California, State of. "Monthly Total Population Report Archive". Cdcr.ca.gov. Retrieved 7 November 2017.
- ↑ "2010 Census P.L. 94-171 Summary File Data". United States Census Bureau.
- ↑ "Unauthorized Immigrants in California: Estimates for Counties - Public Policy Institute of California". Ppic.org. Retrieved 7 November 2017.
- ↑ Hanford Sentinel, March 28–29, 2015
- ↑ California Department of Finance, Table E-2, California County Population Estimates and Percent Change, Revised July 1, 2000 through Provisional July 1, 2006
- 1 2 Fresno Bee, May 15, 2011
- ↑ https://www.countyofkings.com/home/showdocument?id=17107 accessed January 19, 2018
- ↑ https://www.countyofkings.com/Home/Components/News/News/3500/18?backlist=%2f accessed December 2, 2017
- ↑ Hanford Sentinel”, December 23, 2017
- ↑ Hanford Sentinel”, December 27, 2017
- ↑ "Communities of Interest — County". California Citizens Redistricting Commission. Archived from the original on October 23, 2015. Retrieved September 28, 2014.
- ↑ "Statewide Database". UC Regents. Retrieved November 24, 2014.
- ↑ "California's 21st Congressional District - Representatives & District Map". Civic Impulse, LLC.
- ↑ Hanford Sentinel”, April 11, 2017
- 1 2 3 4 5 6 7 8 9 10 11 12 13 14 15 16 17 California Secretary of State. February 10, 2013 - Report of Registration Archived July 27, 2013, at the Wayback Machine.. Retrieved 2013-10-31.
- ↑ Leip, David. "Dave Leip's Atlas of U.S. Presidential Elections". uselectionatlas.org. Retrieved 2018-08-31.
- 1 2 3 4 5 6 7 8 9 10 Office of the Attorney General, Department of Justice, State of California. Table 11: Crimes – 2009 Archived 2013-12-02 at the Wayback Machine.. Retrieved 2013-11-14.
- 1 2 3 United States Department of Justice, Federal Bureau of Investigation. Crime in the United States, 2012, Table 8 (California). Retrieved 2013-11-14.
- ↑ 2017 Kings County Crop Report, Kings County Department of Agriculture/Measurement Standards, June 19, 2018
- ↑ Hanford Sentinel”, June 22, 2018
- ↑ Fresno Bee”, February 22, 2016
- ↑ "Major Employers in California". Labormarketinfo.edd.ca.gov. Retrieved 7 November 2017.
- ↑ Hanford Sentinel, November 15–16, 2014
- ↑ Fresno Bee, November 20, 2017
- ↑ Hanford Sentinel, November 8, 2013
- ↑ "Archived copy". Archived from the original on 2013-01-23. Retrieved 2013-01-22.
- ↑ Equalization, California State Board of. "Taxable Sales In California 2015 - Board of Equalization". www.boe.ca.gov. Retrieved 16 March 2018.
- ↑ http://www.labormarketinfo.edd.ca.gov/data/labor-force-and-unemployment-for-cities-and-census-areas.html
- ↑ "Archived copy" (PDF). Archived from the original (PDF) on 2011-07-21. Retrieved 2011-04-10.
- ↑ Hanford Sentinel, October 2–3, 2010
- ↑ Hanford Sentinel, July 11, 2009
- ↑ Hanford Sentinel, December 18, 2010
- ↑ Fresno Bee, August 19, 2012
- ↑ Fresno Bee, June 17, 2015
- ↑ Hanford Sentinel, March 10, 2016
- ↑ "accessed 5-9-10". Kingscountyhomecoming.org. Archived from the original on 22 October 2016. Retrieved 7 November 2017.
- ↑ Hanford Sentinel, May 9, 2015
- ↑ Hanford Sentinel”, May 7–8, 2016
- ↑ "Home - My Kart Bus". My Kart Bus. Retrieved 7 November 2017.
- ↑ "Central California Soaring Club". Soaravenal.com. Retrieved 7 November 2017.
- ↑ "Archived copy". Archived from the original on 2013-12-21. Retrieved 2016-07-10.
- ↑
- Hoover, Mildred Brooke; Douglas E. Kyle (1990). Historic Spots in California. Stanford University Press. ISBN 978-0-8047-1734-2.
| Wikimedia Commons has media related to Kings County, California. |
External links
- Official website

- Kings County Crop Reports
- Kings County Community Health Status Report, 2008-2009
- Kings County history website operated by the Kings County Office of Education
- Kings County Economic Development Corporation website
- Kings County Facts - Index Mundi
Places adjacent to Kings County, California | ||||||||||
|---|---|---|---|---|---|---|---|---|---|---|
| ||||||||||
Municipalities and communities of Kings County, California, United States | ||
|---|---|---|
| Cities | | |
| CDPs | ||
| Unincorporated communities | ||
| Ghost towns | ||