Wayne County, Utah
| Wayne County, Utah | |
|---|---|
 | |
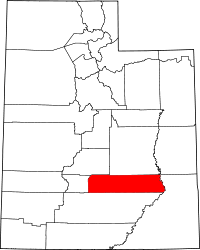 Location in the U.S. state of Utah | |
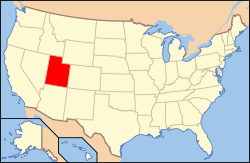 Utah's location in the U.S. | |
| Founded | 1892 |
| Named for | Wayne County, Tennessee |
| Seat | Loa |
| Largest town | Loa |
| Area | |
| • Total | 2,466 sq mi (6,387 km2) |
| • Land | 2,461 sq mi (6,374 km2) |
| • Water | 5.8 sq mi (15 km2), 0.2% |
| Population (est.) | |
| • (2015) | 2,692 |
| • Density | 1.1/sq mi (0.4/km2) |
| Congressional district | 2nd |
| Time zone | Mountain: UTC−7/−6 |
| Website |
www |
Wayne County is a county located in the U.S. state of Utah. As of the 2010 census, the population was 2,778,[1] making it the fourth-least populous county in Utah. Its county seat is Loa.[2] The county was formed from Piute County in 1892, and gets its name from Wayne County, Tennessee.[3]
Geography
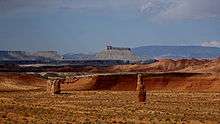
According to the U.S. Census Bureau, the county has a total area of 2,466 square miles (6,390 km2), of which 2,461 square miles (6,370 km2) is land and 5.8 square miles (15 km2) (0.2%) is water.[4] The Green River, passing through the canyons of Canyonlands National Park, forms the eastern boundary. The San Rafael Desert occupies the center of the county. Thousand Lake Mountain and Boulder Mountain flank Rabbit Valley on the western end of the county, where beautiful forests contrast with the deserts to the east. The small population of the county is centered in Rabbit Valley, with one town of 200, Hanksville, located in Graves Valley North of the Henry Mountains. Wayne County is also home of Capitol Reef National Park.
Adjacent counties
- Emery County (north)
- Garfield County (south)
- Piute County (west)
- San Juan County (east)
- Sevier County (northwest)
National Parks
Major highways
Demographics
| Historical population | |||
|---|---|---|---|
| Census | Pop. | %± | |
| 1900 | 1,907 | — | |
| 1910 | 1,749 | −8.3% | |
| 1920 | 2,097 | 19.9% | |
| 1930 | 2,067 | −1.4% | |
| 1940 | 2,394 | 15.8% | |
| 1950 | 2,205 | −7.9% | |
| 1960 | 1,728 | −21.6% | |
| 1970 | 1,483 | −14.2% | |
| 1980 | 1,911 | 28.9% | |
| 1990 | 2,177 | 13.9% | |
| 2000 | 2,509 | 15.3% | |
| 2010 | 2,778 | 10.7% | |
| Est. 2016 | 2,702 | [5] | −2.7% |
| U.S. Decennial Census[6] 1790–1960[7] 1900–1990[8] 1990–2000[9] 2010–2014[1] | |||
As of the census[10] of 2000, there were 2,509 people, 890 households, and 669 families residing in the county. The population density was 1.13 people per square mile (0.43/km²). There were 1,329 housing units at an average density of 0.54 per square mile (0.21/km²). The racial makeup of the county was 97.29% White, 0.16% Black or African American, 0.36% Native American, 0.08% Asian, 0.16% Pacific Islander, 1.24% from other races, and 0.72% from two or more races. 1.99% of the population were Hispanic or Latino of any race.
There were 890 households out of which 36.20% had children under the age of 18 living with them, 66.50% were married couples living together, 5.30% had a female householder with no husband present, and 24.80% were non-families. 21.50% of all households were made up of individuals and 9.60% had someone living alone who was 65 years of age or older. The average household size was 2.81 and the average family size was 3.31.
In the county, the population was spread out with 32.40% under the age of 18, 8.10% from 18 to 24, 22.50% from 25 to 44, 22.60% from 45 to 64, and 14.40% who were 65 years of age or older. The median age was 34 years. For every 100 females there were 103.50 males. For every 100 females age 18 and over, there were 103.50 males.
The median income for a household in the county was $32,000, and the median income for a family was $36,940. Males had a median income of $26,645 versus $20,000 for females. The per capita income for the county was $15,392. About 12.70% of families and 15.40% of the population were below the poverty line, including 22.10% of those under age 18 and 8.20% of those age 65 or over.
Communities
Towns
- Bicknell
- Hanksville
- Loa (county seat)
- Lyman
- Torrey
Census-designated places
Other unincorporated places
Politics
| Year | Republican | Democratic | Third parties |
|---|---|---|---|
| 2016 | 67.7% 966 | 19.0% 271 | 13.3% 189 |
| 2012 | 82.1% 1,089 | 16.2% 215 | 1.7% 23 |
| 2008 | 70.0% 940 | 25.0% 335 | 5.0% 67 |
| 2004 | 78.1% 1,062 | 20.5% 279 | 1.4% 19 |
| 2000 | 77.8% 953 | 16.5% 202 | 5.7% 70 |
| 1996 | 64.9% 741 | 23.2% 265 | 11.9% 136 |
| 1992 | 57.6% 706 | 19.3% 236 | 23.1% 283 |
| 1988 | 68.6% 784 | 30.9% 353 | 0.5% 6 |
| 1984 | 80.2% 930 | 19.3% 224 | 0.4% 5 |
| 1980 | 76.1% 835 | 20.6% 226 | 3.4% 37 |
| 1976 | 59.1% 555 | 35.6% 334 | 5.3% 50 |
| 1972 | 71.8% 597 | 22.0% 183 | 6.3% 52 |
| 1968 | 62.9% 511 | 30.5% 248 | 6.6% 54 |
| 1964 | 49.3% 400 | 50.7% 412 | |
| 1960 | 53.9% 446 | 46.1% 382 | |
| 1956 | 63.8% 499 | 36.2% 283 | |
| 1952 | 66.1% 536 | 33.9% 275 | |
| 1948 | 44.2% 367 | 55.4% 460 | 0.5% 4 |
| 1944 | 43.1% 325 | 57.0% 430 | |
| 1940 | 43.1% 380 | 56.8% 500 | 0.1% 1 |
| 1936 | 38.5% 329 | 61.1% 522 | 0.4% 3 |
| 1932 | 49.3% 398 | 49.6% 401 | 1.1% 9 |
| 1928 | 68.2% 422 | 31.5% 195 | 0.3% 2 |
| 1924 | 57.3% 331 | 41.7% 241 | 1.0% 6 |
| 1920 | 62.0% 396 | 35.1% 224 | 3.0% 19 |
| 1916 | 35.9% 225 | 62.7% 393 | 1.4% 9 |
| 1912 | 52.0% 282 | 33.8% 183 | 14.2% 77 |
| 1908 | 49.9% 279 | 32.9% 184 | 17.2% 96 |
| 1904 | 53.3% 310 | 43.1% 251 | 3.6% 21 |
| 1900 | 52.9% 324 | 46.1% 282 | 1.0% 6 |
| 1896 | 16.2% 78 | 83.9% 405 |
See also
For additional History of Wayne County Utah see "Utah's Stolen Treasures" by Gene Covington ISBN 978-1-62516-335-6 (e-book) or ISBN 978-1-61897-954-4 (paperback)
References
- 1 2 "State & County QuickFacts". United States Census Bureau. Retrieved December 30, 2013.
- ↑ "Find a County". National Association of Counties. Retrieved 2011-06-07.
- ↑ Murphy, Miriam B. (January 1999). A History of Wayne County (PDF). Utah Centennial County History Series. Salt Lake City: Utah State Historical Society. pp. 78–80. ISBN 0-913738-45-X. Retrieved January 27, 2015.
- ↑ "2010 Census Gazetteer Files". United States Census Bureau. August 22, 2012. Retrieved June 26, 2015.
- ↑ "Population and Housing Unit Estimates". Retrieved June 9, 2017.
- ↑ "U.S. Decennial Census". United States Census Bureau. Retrieved June 26, 2015.
- ↑ "Historical Census Browser". University of Virginia Library. Retrieved June 26, 2015.
- ↑ Forstall, Richard L., ed. (March 27, 1995). "Population of Counties by Decennial Census: 1900 to 1990". United States Census Bureau. Retrieved June 26, 2015.
- ↑ "Census 2000 PHC-T-4. Ranking Tables for Counties: 1990 and 2000" (PDF). United States Census Bureau. April 2, 2001. Retrieved June 26, 2015.
- ↑ "American FactFinder". United States Census Bureau. Retrieved 2011-05-14.
- ↑ Leip, David. "Dave Leip's Atlas of U.S. Presidential Elections". uselectionatlas.org. Retrieved 2018-03-31.
External links
| Wikimedia Commons has media related to Wayne County, Utah. |
Places adjacent to Wayne County, Utah | ||||||||||
|---|---|---|---|---|---|---|---|---|---|---|
| ||||||||||
Municipalities and communities of Wayne County, Utah, United States | ||
|---|---|---|
| Towns | | |
| CDPs | ||
| Unincorporated communities | ||
| Ghost towns | ||