Iron County, Utah
| Iron County, Utah | |
|---|---|
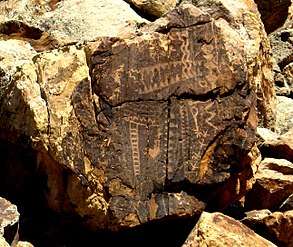 The Parowan Gap petroglyphs, a well-known landmark in Iron County, July 2007 | |
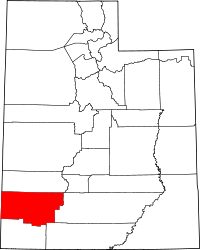 Location in the U.S. state of Utah | |
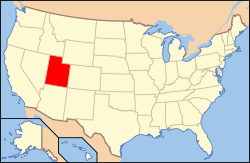 Utah's location in the U.S. | |
| 37°52′N 113°17′W / 37.86°N 113.28°WCoordinates: 37°52′N 113°17′W / 37.86°N 113.28°W | |
| Founded | 1851 |
| Named for | Iron mines |
| Seat | Parowan |
| Largest city | Cedar City |
| Area | |
| • Total | 3,301 sq mi (8,550 km2) |
| • Land | 3,297 sq mi (8,539 km2) |
| • Water | 4.4 sq mi (11 km2), 0.1% |
| Population (est.) | |
| • (2017) | 51,001[1] |
| • Density | 15.5/sq mi (6.0/km2) |
| Congressional district | 2nd |
| Time zone | Mountain: UTC−7/−6 |
| Website |
www |
Iron County is a county located in southwestern Utah, United States. As of the 2010 census, the population was 46,163.[2] Its county seat is Parowan,[3] and the largest city is Cedar City. The county was created in 1850 and organized the following year.[4] It was originally named Little Salt Lake Valley, and renamed for the iron mines west of Cedar City.
The Cedar City, UT Micropolitan Statistical Area includes all of Iron County.
Geography
According to the U.S. Census Bureau, the county has a total area of 3,301 square miles (8,550 km2), of which 3,297 square miles (8,540 km2) is land and 4.4 square miles (11 km2) (0.1%) is water.[5] A small part of Zion National Park extends northward into the county, near Kanarraville. Cedar Breaks National Monument is located entirely within the county, near its southeastern corner.
Adjacent counties
- Washington County (south)
- Kane County (southeast)
- Garfield County (east)
- Beaver County (north)
- Lincoln County, Nevada (west)
National protected areas
- Cedar Breaks National Monument
- Dixie National Forest (part)
- Fishlake National Forest (part)
- Zion National Park (part)
| Historical population | |||
|---|---|---|---|
| Census | Pop. | %± | |
| 1850 | 360 | — | |
| 1860 | 1,010 | 180.6% | |
| 1870 | 2,277 | 125.4% | |
| 1880 | 4,013 | 76.2% | |
| 1890 | 2,683 | −33.1% | |
| 1900 | 3,546 | 32.2% | |
| 1910 | 3,933 | 10.9% | |
| 1920 | 5,787 | 47.1% | |
| 1930 | 7,227 | 24.9% | |
| 1940 | 8,331 | 15.3% | |
| 1950 | 9,642 | 15.7% | |
| 1960 | 10,795 | 12.0% | |
| 1970 | 12,177 | 12.8% | |
| 1980 | 17,349 | 42.5% | |
| 1990 | 20,789 | 19.8% | |
| 2000 | 33,779 | 62.5% | |
| 2010 | 46,163 | 36.7% | |
| Est. 2017 | 51,001 | [6] | 10.5% |
| U.S. Decennial Census[7] 1790–1960[8] 1900–1990[9] 1990–2000[10] 2010–2014[2] | |||
Demographics
As of the census[11] of 2000, there were 33,779 people, 10,627 households, and 8,076 families residing in the county. The population density was 10 people per square mile (4/km²). There were 13,618 housing units at an average density of 4 per square mile (2/km²). The racial makeup of the county was 93.00% White, 0.35% Black or African American, 2.18% Native American, 0.74% Asian, 0.27% Pacific Islander, 1.78% from other races, and 1.67% from two or more races. 4.09% of the population were Hispanic or Latino of any race. The top 5 Ethnic groups in Iron County are:
There were 10,627 households out of which 41.00% had children under the age of 18 living with them, 64.20% were married couples living together, 8.50% had a female householder with no husband present, and 24.00% were non-families. 15.90% of all households were made up of individuals and 5.90% had someone living alone who was 65 years of age or older. The average household size was 3.11 and the average family size was 3.45.
In the county, the population was spread out with 31.20% under the age of 18, 20.60% from 18 to 24, 23.60% from 25 to 44, 16.10% from 45 to 64, and 8.60% who were 65 years of age or older. The median age was 24 years. For every 100 females there were 98.40 males. For every 100 females age 18 and over, there were 93.60 males.
The median income for a household in the county was $33,114, and the median income for a family was $37,171. Males had a median income of $30,800 versus $19,831 for females. The per capita income for the county was $13,568. About 13.10% of families and 19.20% of the population were below the poverty line, including 20.40% of those under age 18 and 6.50% of those age 65 or over.
Recreation
- Woods Ranch Recreation Area,[12] a recreation area located in a pine/aspen forest with hiking, fishing, picnic areas, a volleyball court and restroom facilities.
- Three Peaks Recreation Area,[13] a recreation area made up of volcanic rock and hills. The area features rock climbing, picnics, fishing, off-road vehicle use and bike riding.
- Shooting Range[14]
- Brian Head Ski Resort
Politics
Iron County is a strongly Republican County in Presidential elections, having not voted Democratic since 1940.
| Year | Republican | Democratic | Third parties |
|---|---|---|---|
| 2016 | 64.8% 11,561 | 13.7% 2,450 | 21.4% 3,820 |
| 2012 | 84.5% 14,200 | 12.8% 2,148 | 2.8% 463 |
| 2008 | 75.1% 12,518 | 19.5% 3,258 | 5.4% 902 |
| 2004 | 83.0% 12,815 | 14.7% 2,267 | 2.4% 364 |
| 2000 | 80.2% 10,106 | 14.2% 1,789 | 5.6% 699 |
| 1996 | 69.8% 6,550 | 20.1% 1,887 | 10.2% 954 |
| 1992 | 59.9% 5,616 | 16.4% 1,537 | 23.7% 2,225 |
| 1988 | 76.7% 6,038 | 22.1% 1,736 | 1.2% 94 |
| 1984 | 83.1% 6,856 | 16.3% 1,342 | 0.6% 53 |
| 1980 | 79.5% 6,207 | 15.9% 1,242 | 4.6% 355 |
| 1976 | 69.6% 4,757 | 24.9% 1,700 | 5.5% 376 |
| 1972 | 76.5% 5,085 | 16.5% 1,098 | 7.0% 465 |
| 1968 | 66.6% 3,337 | 23.1% 1,157 | 10.3% 517 |
| 1964 | 55.1% 2,522 | 44.9% 2,053 | |
| 1960 | 63.9% 3,079 | 36.1% 1,738 | 0.0% 1 |
| 1956 | 71.7% 3,321 | 28.3% 1,311 | |
| 1952 | 66.6% 3,175 | 33.5% 1,596 | |
| 1948 | 58.5% 2,289 | 40.8% 1,596 | 0.7% 26 |
| 1944 | 53.3% 1,930 | 46.3% 1,677 | 0.4% 14 |
| 1940 | 51.5% 2,060 | 47.9% 1,915 | 0.6% 23 |
| 1936 | 42.4% 1,396 | 56.1% 1,844 | 1.5% 49 |
| 1932 | 50.6% 1,599 | 42.9% 1,358 | 6.5% 206 |
| 1928 | 72.1% 1,823 | 27.0% 682 | 0.9% 23 |
| 1924 | 66.5% 1,429 | 22.6% 485 | 11.0% 236 |
| 1920 | 69.6% 1,399 | 27.9% 561 | 2.5% 50 |
| 1916 | 40.0% 825 | 56.1% 1,156 | 3.9% 80 |
| 1912 | 49.7% 695 | 38.9% 544 | 11.4% 159 |
| 1908 | 55.8% 712 | 38.2% 488 | 6.0% 76 |
| 1904 | 58.7% 741 | 35.0% 442 | 6.3% 79 |
| 1900 | 46.9% 628 | 52.9% 708 | 0.2% 2 |
| 1896 | 20.3% 205 | 79.7% 806 |
Communities
Cities
- Cedar City
- Enoch
- Parowan (county seat)
Towns
Census-designated places
Other unincorporated places
See also
References
- ↑ https://factfinder.census.gov/faces/nav/jsf/pages/community_facts.xhtml?src=bkmk
- 1 2 "State & County QuickFacts". United States Census Bureau. Archived from the original on July 11, 2011. Retrieved December 29, 2013.
- ↑ "Find a County". National Association of Counties. Archived from the original on 2011-05-31. Retrieved 2011-06-07.
- ↑ "Utah: Individual County Chronologies". Utah Atlas of Historical County Boundaries. The Newberry Library. 2008. Retrieved June 26, 2015.
- ↑ "2010 Census Gazetteer Files". United States Census Bureau. August 22, 2012. Retrieved June 25, 2015.
- ↑ "Population and Housing Unit Estimates". Retrieved June 9, 2017.
- ↑ "U.S. Decennial Census". United States Census Bureau. Archived from the original on May 12, 2015. Retrieved June 25, 2015.
- ↑ "Historical Census Browser". University of Virginia Library. Retrieved June 25, 2015.
- ↑ Forstall, Richard L., ed. (June 25, 1995). "Population of Counties by Decennial Census: 1900 to 1990". United States Census Bureau. Retrieved March 27, 2015.
- ↑ "Census 2000 PHC-T-4. Ranking Tables for Counties: 1990 and 2000" (PDF). United States Census Bureau. April 2, 2001. Retrieved June 25, 2015.
- ↑ "American FactFinder". United States Census Bureau. Retrieved 2011-05-14.
- ↑ "Archived copy". Archived from the original on 2014-05-08. Retrieved 2014-05-30.
- ↑ "Archived copy". Archived from the original on 2014-05-08. Retrieved 2014-05-30.
- ↑ "Archived copy". Archived from the original on 2013-12-19. Retrieved 2014-05-30.
- ↑ Leip, David. "Dave Leip's Atlas of U.S. Presidential Elections". uselectionatlas.org. Retrieved 2018-03-31.
External links
| Wikimedia Commons has media related to Iron County, Utah. |
Places adjacent to Iron County, Utah | |
|---|---|
Municipalities and communities of Iron County, Utah, United States | ||
|---|---|---|
| Cities | | |
| Towns | ||
| CDPs | ||
| Unincorporated communities | ||
| Ghost town | ||
| Indian reservation | ||
| Footnotes | ‡This populated place also has portions in an adjacent county or counties | |