Cibola County, New Mexico
| Cibola County, New Mexico | |
|---|---|
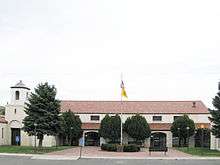 Cibola County Courthouse in Grants | |
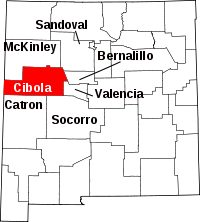 Location in the U.S. state of New Mexico | |
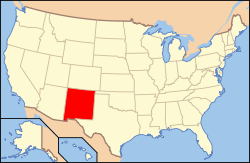 New Mexico's location in the U.S. | |
| Founded | June 19, 1981 |
| Seat | Grants |
| Largest city | Grants |
| Area | |
| • Total | 4,542 sq mi (11,764 km2) |
| • Land | 4,539 sq mi (11,756 km2) |
| • Water | 2.3 sq mi (6 km2), 0.05% |
| Population (est.) | |
| • (2016) | 27,487 |
| • Density | 6.0/sq mi (2.3/km2) |
| Congressional district | 2nd |
| Time zone | Mountain: UTC−7/−6 |
| Website |
www |
Cibola County is a county in the U.S. state of New Mexico. As of the 2010 census, the population was 27,213.[1] Its county seat is Grants.[2] It is New Mexico's youngest county, and the third youngest county in the United States, created on June 19, 1981, from the westernmost four-fifths of the formerly much larger Valencia County.
Cibola County comprises the Grants, NM Micropolitan Statistical Area, which is also part of the Albuquerque-Santa Fe-Las Vegas, NM Combined Statistical Area.
Geography
According to the U.S. Census Bureau, the county has an area of 4,542 square miles (11,760 km2), of which 4,539 square miles (11,760 km2) is land and 2.3 square miles (6.0 km2) (0.05%) is water.[3]
Adjacent counties
- McKinley County - north
- Sandoval County - northeast
- Bernalillo County - east
- Valencia County - east
- Socorro County - southeast
- Catron County - south
- Apache County, Arizona - west
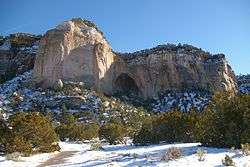
National protected areas
Demographics
| Historical population | |||
|---|---|---|---|
| Census | Pop. | %± | |
| 1990 | 23,794 | — | |
| 2000 | 25,595 | 7.6% | |
| 2010 | 27,213 | 6.3% | |
| Est. 2016 | 27,487 | [4] | 1.0% |
| U.S. Decennial Census[5] 1790-1960[6] 1900-1990[7] 1990-2000[8] 2010-2016[1] | |||
2000 census
As of the 2000 census[9], there were 25,595 people, 8,327 households, and 6,278 families residing in the county. The population density was 6 people per square mile (2/km²). There were 10,328 housing units at an average density of 2 per square mile (1/km²). The racial makeup of the county was 39.61% White, 0.96% Black or African American, 40.32% Native American, 0.38% Asian, 0.05% Pacific Islander, 15.44% from other races, and 3.24% from two or more races. 33.42% of the population were Hispanic or Latino of any race.
There were 8,327 households out of which 38.00% had children under the age of 18 living with them, 50.60% were married couples living together, 18.30% had a female householder with no husband present, and 24.60% were non-families. 21.10% of all households were made up of individuals and 7.30% had someone living alone who was 65 years of age or older. The average household size was 2.95 and the average family size was 3.41.
In the county, the population was spread out with 30.70% under the age of 18, 9.60% from 18 to 24, 27.50% from 25 to 44, 21.50% from 45 to 64, and 10.70% who were 65 years of age or older. The median age was 33 years. For every 100 females there were 95.50 males. For every 100 females age 18 and over, there were 92.20 males.
The median income for a household in the county was $27,774, and the median income for a family was $30,714. Males had a median income of $27,652 versus $20,078 for females. The per capita income for the county was $11,731. About 21.50% of families and 24.80% of the population were below the poverty line, including 32.00% of those under age 18 and 17.70% of those age 65 or over.
2010 census
As of the 2010 census, there were 27,213 people, 8,860 households, and 6,274 families residing in the county.[10] The population density was 6.0 inhabitants per square mile (2.3/km2). There were 11,101 housing units at an average density of 2.4 per square mile (0.93/km2).[11] The racial makeup of the county was 41.8% white, 41.0% American Indian, 1.0% black or African American, 0.5% Asian, 0.1% Pacific islander, 12.4% from other races, and 3.1% from two or more races. Those of Hispanic or Latino origin made up 36.5% of the population.[10] In terms of ancestry, 5.4% were Irish, and 1.5% were American.[12]
Of the 8,860 households, 38.0% had children under the age of 18 living with them, 41.1% were married couples living together, 20.8% had a female householder with no husband present, 29.2% were non-families, and 24.9% of all households were made up of individuals. The average household size was 2.79 and the average family size was 3.30. The median age was 36.6 years.[10]
The median income for a household in the county was $37,361 and the median income for a family was $41,187. Males had a median income of $36,027 versus $25,318 for females. The per capita income for the county was $14,712. About 20.1% of families and 24.0% of the population were below the poverty line, including 32.7% of those under age 18 and 14.3% of those age 65 or over.[13]
Education
All public schools in the county are operated by Grants/Cibola County Schools.
Corrections
Cibola County is home to three prisons:
- the Cibola County Correctional Center, operated by Corrections Corporation of America, housing 1129 federal inmates under a contract with the Federal Bureau of Prisons and the United States Marshal Service[14][15]
- the New Mexico Women's Correctional Facility, run by CCA for the state of New Mexico, and
- Western New Mexico Correctional Facility, owned and operated by the state, with about 440 male inmates[16]
Politics
| Year | Republican | Democratic | Third parties |
|---|---|---|---|
| 2016 | 39.6% 3,195 | 46.4% 3,741 | 14.0% 1,127 |
| 2012 | 36.4% 2,998 | 60.2% 4,961 | 3.5% 284 |
| 2008 | 34.4% 3,131 | 64.1% 5,827 | 1.5% 139 |
| 2004 | 46.4% 3,477 | 52.3% 3,913 | 1.3% 97 |
| 2000 | 38.8% 2,752 | 58.2% 4,127 | 2.9% 209 |
| 1996 | 32.6% 2,245 | 58.6% 4,030 | 8.8% 605 |
| 1992 | 32.6% 2,051 | 53.1% 3,334 | 14.3% 899 |
| 1988 | 43.0% 2,640 | 56.4% 3,458 | 0.6% 39 |
| 1984 | 53.1% 3,578 | 46.6% 3,140 | 0.3% 22 |
Communities
City
- Grants (county seat)
Town
Census-designated places
Unincorporated communities
- Alaska
- Candy Kitchen
- Casa Blanca
- Cebolleta
- Cebolletita
- Cubero
- El Rito
- New Laguna
See also
References
- Specific
- 1 2 "State & County QuickFacts". United States Census Bureau. Retrieved September 27, 2013.
- ↑ "Find a County". National Association of Counties. Archived from the original on May 31, 2011. Retrieved June 7, 2011.
- ↑ "2010 Census Gazetteer Files". United States Census Bureau. August 22, 2012. Archived from the original on January 1, 2015. Retrieved January 1, 2015.
- ↑ "Population and Housing Unit Estimates". Retrieved June 9, 2017.
- ↑ "U.S. Decennial Census". United States Census Bureau. Archived from the original on May 12, 2015. Retrieved January 1, 2015.
- ↑ "Historical Census Browser". University of Virginia Library. Retrieved January 1, 2015.
- ↑ "Population of Counties by Decennial Census: 1900 to 1990". United States Census Bureau. Retrieved January 1, 2015.
- ↑ "Census 2000 PHC-T-4. Ranking Tables for Counties: 1990 and 2000" (PDF). United States Census Bureau. Retrieved January 1, 2015.
- ↑ "American FactFinder". United States Census Bureau. Archived from the original on September 11, 2013. Retrieved January 31, 2008.
- 1 2 3 "DP-1 Profile of General Population and Housing Characteristics: 2010 Demographic Profile Data". United States Census Bureau. Retrieved 2016-01-24.
- ↑ "Population, Housing Units, Area, and Density: 2010 - County". United States Census Bureau. Retrieved 2016-01-24.
- ↑ "DP02 SELECTED SOCIAL CHARACTERISTICS IN THE UNITED STATES – 2006-2010 American Community Survey 5-Year Estimates". United States Census Bureau. Retrieved 2016-01-24.
- ↑ "DP03 SELECTED ECONOMIC CHARACTERISTICS – 2006-2010 American Community Survey 5-Year Estimates". United States Census Bureau. Retrieved 2016-01-24.
- ↑ CoreCivic. "CoreCivic: Better the Public Good". cca.com. Retrieved 2018-04-01.
- ↑ "Cibola County Correctional Center". Corrections Corporation of America. Retrieved 26 August 2016.
- ↑ "Western New Mexico Correctional Facility". New Mexico Corrections Department. Retrieved 26 August 2016.
- ↑ Leip, David. "Dave Leip's Atlas of U.S. Presidential Elections". uselectionatlas.org. Retrieved 2018-04-01.
- General
- County status and boundary changes United States Census Bureau
Further reading
- Baldwin, J.A. and D.R. Rankin. (1995). Hydrogeology of Cibola County, New Mexico [Water-Resources Investigations Report 94-4178]. Albuquerque: U.S. Department of the Interior, U.S. Geological Survey.
- Maxwell, C.H. (1989). Mineral resources of the Petaca Pinta wilderness study area, Cibola County, New Mexico [U.S. Geological Survey Bulletin 1734-H]. Denver: U.S. Department of the Interior, U.S. Geological Survey.
Places adjacent to Cibola County, New Mexico | ||||||||||
|---|---|---|---|---|---|---|---|---|---|---|
| ||||||||||
| Wikimedia Commons has media related to Cibola County, New Mexico. |
Municipalities and communities of Cibola County, New Mexico, United States | ||
|---|---|---|
| City | | |
| Village | ||
| CDPs | ||
| Unincorporated communities | ||
| Indian reservations | ||
| Footnotes | ‡This populated place also has portions in an adjacent county or counties | |
Santa Fe (capital) | ||
| Topics |
| |
| Society | ||
| Regions |
| |
| Cities | ||
| Counties | ||