Morgan County, Utah
| Morgan County, Utah | |
|---|---|
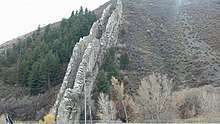 Devil's Slide, a limestone rock formation in Weber Canyon, November 2013. | |
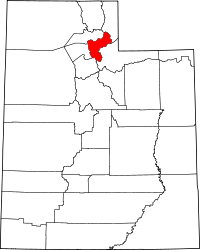 Location in the U.S. state of Utah | |
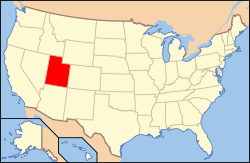 Utah's location in the U.S. | |
| 41°05′N 111°35′W / 41.08°N 111.58°WCoordinates: 41°05′N 111°35′W / 41.08°N 111.58°W | |
| Founded | 1862 |
| Named for | Jedediah Morgan Grant |
| Seat | Morgan |
| Largest city | Morgan |
| Area | |
| • Total | 611 sq mi (1,582 km2) |
| • Land | 609 sq mi (1,577 km2) |
| • Water | 1.7 sq mi (4 km2), 0.3% |
| Population (est.) | |
| • (2017) | 11,873[1] |
| • Density | 19.5/sq mi (7.5/km2) |
| Congressional district | 1st |
| Time zone | Mountain: UTC−7/−6 |
| Website |
www |
Morgan County is a county in northern Utah, United States. As of the 2010 census, the population was 9,469.[2] Its county seat and largest city is Morgan.[3] The county was named for Jedediah Morgan Grant, father of Heber J. Grant, who served as president of The Church of Jesus Christ of Latter-day Saints.
Morgan County is part of the Ogden-Clearfield, UT Metropolitan Statistical Area as well as the Salt Lake City-Provo-Orem, UT Combined Statistical Area.
History
An early route of the Hastings Cutoff ran through the Morgan Valley and down through a narrow gorge in Weber Canyon. The Donner Party avoided going through the Morgan Valley in order to speed up their journey. However, their alternate route proved more time-consuming.
In 1855, Charles Sreeve Peterson and his family became the first white settlers to take up permanent residence in the Morgan Valley after cutting a road through Weber Canyon.
Geography
According to the U.S. Census Bureau, the county has an area of 611 square miles (1,580 km2), of which 609 square miles (1,580 km2) is land and 1.7 square miles (4.4 km2) (0.3%) is water.[4] It is Utah's third-smallest county by land area and smallest by total area.
Major highways
Adjacent counties
- Weber County (north)
- Summit County (east)
- Salt Lake County (southwest)
- Davis County (west)
- Rich County (northeast)
National protected areas
- Cache National Forest (part)
- Wasatch National Forest (part)
| Historical population | |||
|---|---|---|---|
| Census | Pop. | %± | |
| 1870 | 1,972 | — | |
| 1880 | 1,783 | −9.6% | |
| 1890 | 1,780 | −0.2% | |
| 1900 | 2,045 | 14.9% | |
| 1910 | 2,467 | 20.6% | |
| 1920 | 2,542 | 3.0% | |
| 1930 | 2,536 | −0.2% | |
| 1940 | 2,611 | 3.0% | |
| 1950 | 2,519 | −3.5% | |
| 1960 | 2,837 | 12.6% | |
| 1970 | 3,983 | 40.4% | |
| 1980 | 4,917 | 23.4% | |
| 1990 | 5,528 | 12.4% | |
| 2000 | 7,129 | 29.0% | |
| 2010 | 9,469 | 32.8% | |
| Est. 2017 | 11,873 | [5] | 25.4% |
| U.S. Decennial Census[6] 1790–1960[7] 1900–1990[8] 1990–2000[9] 2010–2014[2] | |||
Demographics
As of the census[10] of 2000, there were 7,129 people, 2,046 households, and 1,782 families residing in the county. The population density was 12 people per square mile (5/km²). There were 2,158 housing units at an average density of 4 per square mile (1/km²). The racial makeup of the county was 98.11% White, 0.04% Black or African American, 0.18% Native American, 0.15% Asian, 0.45% from other races, and 1.07% from two or more races. 1.44% of the population were Hispanic or Latino of any race.
There were 2,046 households out of which 49.70% had children under the age of 18 living with them, 79.60% were married couples living together, 5.60% had a female householder with no husband present, and 12.90% were non-families. 11.70% of all households were made up of individuals and 5.80% had someone living alone who was 65 years of age or older. The average household size was 3.48 and the average family size was 3.81.
In the county, the population was spread out with 37.10% under the age of 18, 9.70% from 18 to 24, 24.30% from 25 to 44, 20.20% from 45 to 64, and 8.70% who were 65 years of age or older. The median age was 28 years. For every 100 females, there were 102.90 males. For every 100 females age 18 and over, there were 99.70 males.
The median income for a household in the county was $50,273, and the median income for a family was $53,365. Males had a median income of $42,350 versus $23,036 for females. The per capita income for the county was $17,684. About 3.70% of families and 5.20% of the population were below the poverty line, including 5.70% of those under age 18 and 6.90% of those age 65 or over.
Politics
| Year | Republican | Democratic | Third parties |
|---|---|---|---|
| 2016 | 61.4% 3,188 | 11.1% 577 | 27.5% 1,427 |
| 2012 | 89.5% 4,114 | 8.8% 403 | 1.7% 80 |
| 2008 | 79.1% 3,311 | 16.5% 689 | 4.5% 188 |
| 2004 | 85.9% 3,301 | 12.3% 472 | 1.8% 68 |
| 2000 | 77.7% 2,464 | 17.4% 553 | 4.9% 154 |
| 1996 | 57.1% 1,659 | 29.5% 859 | 13.4% 390 |
| 1992 | 45.5% 1,339 | 17.7% 520 | 36.8% 1,081 |
| 1988 | 73.6% 1,889 | 25.2% 647 | 1.2% 31 |
| 1984 | 79.6% 1,934 | 19.8% 481 | 0.6% 15 |
| 1980 | 81.5% 1,985 | 15.3% 373 | 3.2% 77 |
| 1976 | 63.0% 1,356 | 32.5% 701 | 4.5% 97 |
| 1972 | 71.5% 1,456 | 17.8% 363 | 10.7% 217 |
| 1968 | 59.9% 1,020 | 32.4% 551 | 7.8% 132 |
| 1964 | 40.7% 572 | 59.4% 835 | |
| 1960 | 55.4% 775 | 44.5% 622 | 0.1% 1 |
| 1956 | 67.4% 905 | 32.6% 438 | |
| 1952 | 64.9% 862 | 35.1% 467 | |
| 1948 | 46.4% 587 | 53.0% 670 | 0.6% 8 |
| 1944 | 44.4% 535 | 55.6% 671 | |
| 1940 | 45.1% 575 | 54.9% 699 | |
| 1936 | 39.3% 483 | 60.2% 739 | 0.5% 6 |
| 1932 | 48.3% 568 | 51.2% 602 | 0.4% 5 |
| 1928 | 53.0% 513 | 46.9% 454 | 0.1% 1 |
| 1924 | 54.1% 482 | 40.4% 360 | 5.5% 49 |
| 1920 | 57.6% 544 | 42.0% 397 | 0.4% 4 |
| 1916 | 48.5% 464 | 50.6% 484 | 0.8% 8 |
| 1912 | 36.6% 318 | 26.8% 233 | 36.6% 318 |
| 1908 | 58.2% 494 | 36.0% 306 | 5.8% 49 |
| 1904 | 57.3% 492 | 36.7% 315 | 6.1% 52 |
| 1900 | 51.7% 391 | 48.0% 363 | 0.3% 2 |
| 1896 | 19.2% 138 | 80.8% 582 |
Communities
Cities
- Morgan (county seat)
Census-designated places
Other unincorporated places
See also
References
- ↑ https://factfinder.census.gov/faces/nav/jsf/pages/community_facts.xhtml?src=bkmk
- 1 2 "State & County QuickFacts". United States Census Bureau. Archived from the original on July 15, 2011. Retrieved December 29, 2013.
- ↑ "Find a County". National Association of Counties. Retrieved 2011-06-07.
- ↑ "2010 Census Gazetteer Files". United States Census Bureau. August 22, 2012. Retrieved June 25, 2015.
- ↑ "Population and Housing Unit Estimates". Retrieved June 9, 2017.
- ↑ "U.S. Decennial Census". United States Census Bureau. Retrieved June 25, 2015.
- ↑ "Historical Census Browser". University of Virginia Library. Retrieved June 25, 2015.
- ↑ Forstall, Richard L., ed. (June 25, 1995). "Population of Counties by Decennial Census: 1900 to 1990". United States Census Bureau. Retrieved March 27, 2015.
- ↑ "Census 2000 PHC-T-4. Ranking Tables for Counties: 1990 and 2000" (PDF). United States Census Bureau. April 2, 2001. Retrieved June 25, 2015.
- ↑ "American FactFinder". United States Census Bureau. Retrieved 2011-05-14.
- ↑ Leip, David. "Dave Leip's Atlas of U.S. Presidential Elections". uselectionatlas.org. Retrieved 2018-03-31.
- ↑ "Croyden". Geographic Names Information System. United States Geological Survey.
- ↑ "Milton". Geographic Names Information System. United States Geological Survey.
- ↑ "Richville". Geographic Names Information System. United States Geological Survey.
- ↑ "Sotddard". Geographic Names Information System. United States Geological Survey.
Further reading
- Smith, Linda H. (1999). A History of Morgan County. Salt Lake City, UT: Utah State Historical Society. ISBN 978-0-913738-36-8.
External links
Places adjacent to Morgan County, Utah | ||||||||||
|---|---|---|---|---|---|---|---|---|---|---|
| ||||||||||
Municipalities and communities of Morgan County, Utah, United States | ||
|---|---|---|
| City | | |
| CDPs | ||
| Unincorporated communities | ||