Bernalillo County, New Mexico
| Bernalillo County, New Mexico | |||
|---|---|---|---|
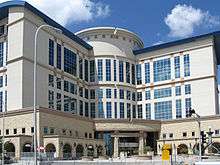 Bernalillo County Courthouse in Albuquerque | |||
| |||
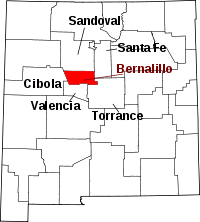 Location in the U.S. state of New Mexico | |||
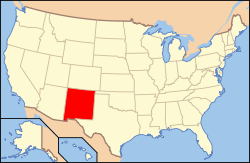 New Mexico's location in the U.S. | |||
| Founded | 1852 | ||
| Seat | Albuquerque | ||
| Largest city | Albuquerque | ||
| Area | |||
| • Total | 1,167 sq mi (3,023 km2) | ||
| • Land | 1,161 sq mi (3,007 km2) | ||
| • Water | 6.4 sq mi (17 km2), 0.5% | ||
| Population (est.) | |||
| • (2016) | 676,953[1] | ||
| • Density | 571/sq mi (220/km2) | ||
| Congressional districts | 1st, 2nd, 3rd | ||
| Time zone | Mountain: UTC−7/−6 | ||
| Website |
www | ||

Bernalillo County is the most populous county in the U.S. state of New Mexico.[2] As of the 2010 census, the population was 662,564.[3] The county seat, Albuquerque,[4] is the most populous city in New Mexico.
Bernalillo County is the central county of the Albuquerque, NM Metropolitan Statistical Area.
History
Bernalillo County was one of seven partidos established during Mexican rule; in 1852, within two years of the creation of the New Mexico Territory, Bernalillo became one of that territory's nine original counties.[2] In 1876, it absorbed Santa Ana County.
In 1906, years after the Land Revision Act of 1891 provided for the setting aside of forest reserves, the parts of Bernalillo County currently known as Cibola National Forest were established as reserves.[5]
USS LST-306, a World War II tank landing ship which participated in the Allied invasion of Italy, was renamed USS Bernalillo County in 1955. Sandia Mountain Wilderness was created in 1978 and the Petroglyph National Monument was established in June 1990.
Geography
According to the U.S. Census Bureau, the county has a total area of 1,167 square miles (3,020 km2), of which 1,161 square miles (3,010 km2) is land and 6.4 square miles (17 km2) (0.5%) is water.[6] It is the third-smallest county in New Mexico by area.
Bernalillo County is in central New Mexico, and "stretches from the East Mountain area (just east of the Sandia Mountains) to the Volcano Cliffs on the west mesa."[7]
Adjacent counties
- Sandoval County - north
- Santa Fe County - east
- Torrance County - east
- Valencia County - south
- Cibola County - west
National protected areas
Demographics
| Historical population | |||
|---|---|---|---|
| Census | Pop. | %± | |
| 1850 | 7,751 | — | |
| 1860 | 8,769 | 13.1% | |
| 1870 | 7,591 | −13.4% | |
| 1880 | 17,225 | 126.9% | |
| 1890 | 20,913 | 21.4% | |
| 1900 | 28,630 | 36.9% | |
| 1910 | 23,606 | −17.5% | |
| 1920 | 29,855 | 26.5% | |
| 1930 | 45,430 | 52.2% | |
| 1940 | 69,391 | 52.7% | |
| 1950 | 145,673 | 109.9% | |
| 1960 | 262,199 | 80.0% | |
| 1970 | 315,774 | 20.4% | |
| 1980 | 419,700 | 32.9% | |
| 1990 | 480,577 | 14.5% | |
| 2000 | 556,678 | 15.8% | |
| 2010 | 662,564 | 19.0% | |
| Est. 2016 | 676,953 | [8] | 2.2% |
| U.S. Decennial Census[9] 1790-1960[10] 1900-1990[11] 1990-2000[12] 2010-2016[3] | |||

2000 census
As of the census[13] of 2000, there were 556,678 people, 220,936 households, and 141,178 families residing in the county, making Bernalillo the most populous county in the state.[2] The population density was 477 people per square mile (184/km²). There were 239,074 housing units at an average density of 205 per square mile (79/km²). The racial makeup of the county was 70.75% White, 2.77% Black or African American, 4.16% Native American, 1.93% Asian, 0.10% Pacific Islander, 16.07% from other races, and 4.22% from two or more races. 41.96% of the population were Hispanic or Latino of any race.
There were 220,936 households out of which 31.40% had children under the age of 18 living with them, 46.00% were married couples living together, 12.90% had a female householder with no husband present, and 36.10% were non-families. 28.50% of all households were made up of individuals and 7.90% had someone living alone who was 65 years of age or older. The average household size was 2.47 and the average family size was 3.06.
In the county, the population was spread out with 25.30% under the age of 18, 10.30% from 18 to 24, 30.40% from 25 to 44, 22.40% from 45 to 64, and 11.50% who were 65 years of age or older. The median age was 35 years. For every 100 females there were 95.50 males. For every 100 females age 18 and over, there were 92.90 males.
The median income for a household in the county was $38,788, and the median income for a family was $46,613. Males had a median income of $33,720 versus $26,318 for females. The per capita income for the county was $20,790. About 10.20% of families and 13.70% of the population were below the poverty line, including 17.90% of those under age 18 and 9.10% of those age 65 or over.
2010 census
As of the 2010 United States Census, there were 662,564 people, 266,000 households, and 164,104 families residing in the county.[14] The population density was 570.8 inhabitants per square mile (220.4/km2). There were 284,234 housing units at an average density of 244.9 per square mile (94.6/km2).[15] The racial makeup of the county was 69.4% white, 4.8% American Indian, 3.0% black or African American, 2.3% Asian, 0.1% Pacific islander, 16.0% from other races, and 4.4% from two or more races. Those of Hispanic or Latino origin made up 47.9% of the population.[14] The largest ancestry groups were:[16]
- 27.6% Mexican
- 18.5% Spanish
- 11.6% German
- 8.5% Irish
- 7.6% English
- 3.4% Italian
- 2.6% American
- 2.3% French
- 1.9% Scottish
- 1.7% Scotch-Irish
- 1.7% Polish
- 1.3% Norwegian
- 1.2% Swedish
- 1.1% Dutch
Of the 266,000 households, 31.9% had children under the age of 18 living with them, 41.4% were married couples living together, 14.1% had a female householder with no husband present, 38.3% were non-families, and 30.4% of all households were made up of individuals. The average household size was 2.45 and the average family size was 3.07. The median age was 35.8 years.[14]
The median income for a household in the county was $47,481 and the median income for a family was $59,809. Males had a median income of $42,189 versus $34,432 for females. The per capita income for the county was $26,143. About 11.8% of families and 15.6% of the population were below the poverty line, including 22.8% of those under age 18 and 9.8% of those age 65 or over.[17]
Politics
New Mexico Senate
| District | Name | Party | Took office |
|---|---|---|---|
| 9 | John Sapien | Democratic | 2009 |
| 10 | John Ryan | Republican | 2005 |
| 11 | Linda M. Lopez | Democratic | 1997 |
| 12 | Jerry Ortiz y Pino | Democratic | 2005 |
| 13 | Bill B. O'Neill | Democratic | 2013 |
| 14 | Michael Padilla | Democratic | 2013 |
| 15 | Daniel Ivey-Soto | Democratic | 2013 |
| 16 | Cisco McSorley | Democratic | 1997 |
| 17 | Mimi Stewart | Democratic | 2009 |
| 18 | Lisa Torraco | Republican | 2013 |
| 19 | Sue Wilson Beffort | Republican | 1997 |
County offices
| Office | Name | Party | Took office |
|---|---|---|---|
| Sheriff | Manuel Gonzales III | Democratic | 2015 |
| Assessor | Tanya R. Giddings | Democratic | 2012 |
| Clerk | Linda Stover | Democratic | 2016 |
| Treasurer | Nancy M. Bearce | Democratic | 2016 |
| Probate Judge | Willow Misty Parks | Democratic | 2011 |
County Commission
| District | Name | Party | Took office |
|---|---|---|---|
| 1 | Debbie O'Malley | Democratic | 2012 |
| 2 | Steven Michael Quezada | Democratic | 2016 |
| 3 | Maggie Hart Stebbins | Democratic | 2010 |
| 4 | Lonnie C. Talbert | Republican | 2012 |
| 5 | Wayne Johnson | Republican | 2010 |
Congressional
Michelle Lujan Grisham (D) is the representative for the 1st Congressional District.
Presidential
| Year | Republican | Democratic | Third parties |
|---|---|---|---|
| 2016 | 34.5% 94,698 | 52.2% 143,417 | 13.3% 36,547 |
| 2012 | 39.3% 106,408 | 55.6% 150,739 | 5.1% 13,822 |
| 2008 | 38.7% 110,521 | 60.0% 171,556 | 1.3% 3,701 |
| 2004 | 47.3% 121,454 | 51.5% 132,252 | 1.2% 3,105 |
| 2000 | 46.6% 95,249 | 48.7% 99,461 | 4.7% 9,609 |
| 1996 | 43.2% 78,832 | 48.3% 88,140 | 8.5% 15,571 |
| 1992 | 38.5% 77,304 | 45.3% 90,863 | 16.2% 32,531 |
| 1988 | 53.6% 92,830 | 45.3% 78,346 | 1.1% 1,959 |
| 1984 | 60.1% 104,694 | 38.9% 67,789 | 1.0% 1,779 |
| 1980 | 53.5% 83,956 | 34.9% 54,841 | 11.6% 18,266 |
| 1976 | 54.0% 76,614 | 45.1% 63,949 | 1.0% 1,363 |
| 1972 | 60.8% 79,993 | 37.1% 48,753 | 2.1% 2,816 |
| 1968 | 55.0% 56,234 | 39.9% 40,835 | 5.1% 5,252 |
| 1964 | 43.3% 42,583 | 56.0% 55,036 | 0.7% 698 |
| 1960 | 52.1% 44,805 | 47.5% 40,908 | 0.4% 348 |
| 1956 | 64.3% 41,893 | 35.2% 22,954 | 0.5% 296 |
| 1952 | 59.4% 33,964 | 40.5% 23,164 | 0.1% 72 |
| 1948 | 47.1% 16,668 | 51.8% 18,305 | 1.1% 391 |
| 1944 | 48.8% 11,662 | 51.2% 12,229 | 0.1% 13 |
| 1940 | 45.4% 11,999 | 54.5% 14,428 | 0.1% 34 |
| 1936 | 31.5% 7,107 | 67.8% 15,305 | 0.8% 170 |
| 1932 | 40.1% 7,309 | 58.8% 10,722 | 1.2% 212 |
| 1928 | 57.0% 8,725 | 42.9% 6,572 | 0.1% 14 |
| 1924 | 49.6% 7,078 | 42.2% 6,023 | 8.3% 1,183 |
| 1920 | 50.5% 4,969 | 48.9% 4,808 | 0.6% 56 |
| 1916 | 52.3% 2,711 | 46.1% 2,394 | 1.6% 83 |
| 1912 | 26.6% 1,002 | 31.9% 1,199 | 41.6% 1,564 |
Communities

A local geographical oddity is that the town of Bernalillo, north of Albuquerque, is not actually in Bernalillo County. It is the county seat of Sandoval County.
- Bracketed number refers to location on map, right
Cities
- Albuquerque (3) (county seat)
Villages
- Los Ranchos de Albuquerque (1)
- Tijeras (6)
Census-designated places
- Carnuel (9)
- Cedar Crest (5)
- Cedro
- Chilili (8)
- Edith Endave
- Isleta Village Proper (7)
- Manzano Springs (partial)
- North Valley (2)
- Pajarito Mesa
- Paradise Hills
- Ponderosa Pine
- San Antonito
- Sandia Heights
- Sandia Knolls
- Sandia Park
- Sedillo
- South Valley (4)
Unincorporated communities
- Alameda
- Carpenter
- Isleta Pueblo
- Laguna Pueblo
- Sandia Pueblo (partial)
- Zuzax
See also
References
- ↑ "Population and Housing Unit Estimates". U.S. Census Bureau. August 15, 2017. Retrieved August 15, 2017.
- 1 2 3 Bernalillo County Archived October 8, 2010, at the Wayback Machine. from the website of the New Mexico Office of the State Historian
- 1 2 "State & County QuickFacts". United States Census Bureau. Retrieved September 27, 2013.
- ↑ "Find a County". National Association of Counties. Archived from the original on May 31, 2011. Retrieved June 7, 2011.
- ↑ Southwestern Region Initial Forest Reserves and National Forests, from a U.S. Forest Service website
- ↑ "2010 Census Gazetteer Files". United States Census Bureau. August 22, 2012. Archived from the original on January 1, 2015. Retrieved January 1, 2015.
- ↑ Bernalillo County Extension Office from a New Mexico State University website
- ↑ "Population and Housing Unit Estimates". Retrieved June 9, 2017.
- ↑ "U.S. Decennial Census". United States Census Bureau. Archived from the original on April 22, 2013. Retrieved January 1, 2015.
- ↑ "Historical Census Browser". University of Virginia Library. Retrieved January 1, 2015.
- ↑ "Population of Counties by Decennial Census: 1900 to 1990". United States Census Bureau. Retrieved January 1, 2015.
- ↑ "Census 2000 PHC-T-4. Ranking Tables for Counties: 1990 and 2000" (PDF). United States Census Bureau. Retrieved January 1, 2015.
- ↑ "American FactFinder". United States Census Bureau. Archived from the original on September 11, 2013. Retrieved January 31, 2008.
- 1 2 3 "DP-1 Profile of General Population and Housing Characteristics: 2010 Demographic Profile Data". United States Census Bureau. Retrieved 2016-01-24.
- ↑ "Population, Housing Units, Area, and Density: 2010 - County". United States Census Bureau. Retrieved 2016-01-24.
- ↑ "DP02 SELECTED SOCIAL CHARACTERISTICS IN THE UNITED STATES – 2006-2010 American Community Survey 5-Year Estimates". United States Census Bureau. Retrieved 2016-01-24.
- ↑ "DP03 SELECTED ECONOMIC CHARACTERISTICS – 2006-2010 American Community Survey 5-Year Estimates". United States Census Bureau. Retrieved 2016-01-24.
- ↑ Leip, David. "Dave Leip's Atlas of U.S. Presidential Elections". uselectionatlas.org. Retrieved 2018-04-01.
External links

Places adjacent to Bernalillo County, New Mexico | ||||||||||
|---|---|---|---|---|---|---|---|---|---|---|
| ||||||||||
 | ||
Municipalities and communities of Bernalillo County, New Mexico, United States | ||
|---|---|---|
| Cities | | |
| Town | ||
| Villages | ||
| CDPs | ||
| Other unincorporated communities | ||
| Indian reservations | ||
| Footnotes | ‡This populated place also has portions in an adjacent county or counties | |
Santa Fe (capital) | ||
| Topics |
| |
| Society | ||
| Regions |
| |
| Cities | ||
| Counties | ||