Rio Arriba County, New Mexico
| Rio Arriba County, New Mexico | ||
|---|---|---|
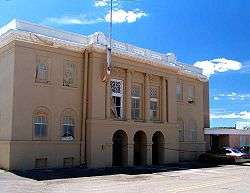 Rio Arriba County Courthouse, Isaac Rapp, architect, 1916-17 | ||
| ||
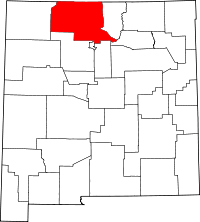 Location in the U.S. state of New Mexico | ||
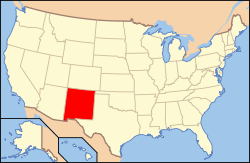 New Mexico's location in the U.S. | ||
| Founded | 1852 | |
| Seat | Tierra Amarilla | |
| Largest city | Española | |
| Area | ||
| • Total | 5,896 sq mi (15,271 km2) | |
| • Land | 5,861 sq mi (15,180 km2) | |
| • Water | 35 sq mi (91 km2), 0.6% | |
| Population (est.) | ||
| • (2016) | 40,040 | |
| • Density | 6.9/sq mi (2.7/km2) | |
| Congressional district | 3rd | |
| Time zone | Mountain: UTC−7/−6 | |
| Website |
www | |

Rio Arriba County is a county in the U.S. state of New Mexico. As of the 2010 census, the population was 40,246.[1] Its county seat is Tierra Amarilla.[2] Its northern border is the Colorado state line.
Rio Arriba County comprises the Española, NM Micropolitan Statistical Area, which is also included in the Albuquerque-Santa Fe-Las Vegas, NM Combined Statistical Area.
History
The county was one of nine originally created for the Territory of New Mexico in 1852. Originally extending west to the California line, it included the site of present-day Las Vegas, Nevada.[3] The county seat was initially sited at San Pedro de Chamita, and shortly afterwards at Los Luceros. In 1860 the seat was moved to Plaza del Alcalde. Since 1880 Tierra Amarilla has been the county seat.[4]
The Battle of Embudo Pass took place in the southern part of the county during the American invasion in January 1847.
Geography
According to the U.S. Census Bureau, the county has a total area of 5,896 square miles (15,270 km2), of which 5,861 square miles (15,180 km2) are land and 35 square miles (91 km2) (0.6%) are water.[5] It is the fifth-largest county in New Mexico by area. The highest point in the county is the summit of Truchas Peak at 13,102 feet (3,993 m).
The county acquired its present proportions after the creation of San Juan County and other adjustments.[4]
Adjacent counties
- Taos County - east
- Mora County - southeast
- Santa Fe County - south
- Los Alamos County - south
- Sandoval County - south
- San Juan County - west
- Archuleta County, Colorado - north
- Conejos County, Colorado - north
National protected areas
Demographics
| Historical population | |||
|---|---|---|---|
| Census | Pop. | %± | |
| 1910 | 16,624 | — | |
| 1920 | 19,552 | 17.6% | |
| 1930 | 21,381 | 9.4% | |
| 1940 | 25,352 | 18.6% | |
| 1950 | 24,997 | −1.4% | |
| 1960 | 24,193 | −3.2% | |
| 1970 | 25,170 | 4.0% | |
| 1980 | 29,282 | 16.3% | |
| 1990 | 34,365 | 17.4% | |
| 2000 | 41,190 | 19.9% | |
| 2010 | 40,246 | −2.3% | |
| Est. 2016 | 40,040 | [6] | −0.5% |
| U.S. Decennial Census[7] 1790-1960[8] 1900-1990[9] 1990-2000[10] 2010-2016[1] | |||
2000 census
As of the 2000 census[11], there were 41,190 people, 15,044 households, and 10,816 families residing in the county. The population density was 7 people per square mile (3/km²). There were 18,016 housing units at an average density of 3 per square mile (1/km²). The racial makeup of the county was 56.62% White, 0.35% Black or African American, 13.88% Native American, 0.14% Asian, 0.11% Pacific Islander, 25.62% from other races, and 3.28% from two or more races. 72.89% of the population were Hispanic or Latino of any race.
There were 15,044 households out of which 36.90% had children under the age of 18 living with them, 48.80% were married couples living together, 15.90% had a female householder with no husband present, and 28.10% were non-families. 23.50% of all households were made up of individuals and 7.80% had someone living alone who was 65 years of age or older. The average household size was 2.71 and the average family size was 3.19.
In the county, the population was spread out with 28.60% under the age of 18, 8.90% from 18 to 24, 28.80% from 25 to 44, 22.90% from 45 to 64, and 10.90% who were 65 years of age or older. The median age was 34 years. For every 100 females there were 98.00 males. For every 100 females age 18 and over, there were 97.70 males.
The median income for a household in the county was $29,429, and the median income for a family was $32,901. Males had a median income of $26,897 versus $22,223 for females. The per capita income for the county was $14,263. About 16.60% of families and 20.30% of the population were below the poverty line, including 23.30% of those under age 18 and 22.90% of those age 65 or over.
2010 census
As of the 2010 census, there were 40,246 people, 15,768 households, and 10,477 families residing in the county.[12] The population density was 6.9 inhabitants per square mile (2.7/km2). There were 19,638 housing units at an average density of 3.4 per square mile (1.3/km2).[13] The racial makeup of the county was 51.6% white, 16.0% American Indian, 0.5% black or African American, 0.4% Asian, 28.0% from other races, and 3.3% from two or more races. Those of Hispanic or Latino origin made up 71.3% of the population.[12]
The largest ancestry groups were:[14]
- 20.6% Mexican
- 15.5% Spanish
- 4.5% German
- 3.2% English
- 2.7% Irish
- 1.7% French
- 1.5% Navajo
- 1.2% Scottish
Of the 15,768 households, 33.6% had children under the age of 18 living with them, 42.3% were married couples living together, 16.0% had a female householder with no husband present, 33.6% were non-families, and 28.2% of all households were made up of individuals. The average household size was 2.53 and the average family size was 3.09. The median age was 39.0 years.[12]
The median income for a household in the county was $41,437 and the median income for a family was $47,840. Males had a median income of $39,757 versus $31,657 for females. The per capita income for the county was $19,913. About 15.7% of families and 19.7% of the population were below the poverty line, including 20.6% of those under age 18 and 18.3% of those age 65 or over.[15]
Politics
From New Mexico’s statehood to the early 1940s Rio Arriba was a traditional Republican county. That would later change and the county would become a Democratic stronghold from the 1960s to the present day. The last Republican Presidential candidate to carry the county was Dwight D. Eisenhower in 1956.[16] No Republican candidate for governor has won the county since at least 1966.[17]
| Year | Republican | Democratic | Third parties |
|---|---|---|---|
| 2016 | 24.2% 3,599 | 64.5% 9,592 | 11.3% 1,687 |
| 2012 | 22.1% 3,397 | 74.7% 11,465 | 3.1% 481 |
| 2008 | 24.1% 4,086 | 75.0% 12,703 | 0.9% 151 |
| 2004 | 34.3% 5,149 | 65.0% 9,753 | 0.7% 97 |
| 2000 | 28.9% 3,495 | 67.5% 8,169 | 3.6% 433 |
| 1996 | 22.6% 2,551 | 70.5% 7,965 | 7.0% 789 |
| 1992 | 23.2% 2,680 | 67.9% 7,832 | 8.9% 1,030 |
| 1988 | 28.5% 3,024 | 70.6% 7,503 | 0.9% 99 |
| 1984 | 36.9% 4,116 | 62.3% 6,938 | 0.8% 92 |
| 1980 | 35.8% 3,794 | 59.0% 6,245 | 5.2% 552 |
| 1976 | 30.8% 3,213 | 68.2% 7,125 | 1.1% 111 |
| 1972 | 42.7% 4,351 | 55.3% 5,642 | 2.0% 202 |
| 1968 | 43.2% 3,935 | 52.7% 4,799 | 4.1% 368 |
| 1964 | 29.8% 2,906 | 69.6% 6,787 | 0.7% 64 |
| 1960 | 37.3% 3,716 | 62.7% 6,250 | 0.0% 3 |
| 1956 | 51.5% 4,566 | 48.4% 4,291 | 0.0% 3 |
| 1952 | 48.7% 4,336 | 51.3% 4,564 | 0.1% 5 |
| 1948 | 47.3% 4,273 | 52.6% 4,753 | 0.2% 17 |
| 1944 | 48.2% 3,532 | 51.8% 3,792 | 0.0% 3 |
| 1940 | 46.4% 4,289 | 53.6% 4,952 | 0.1% 6 |
| 1936 | 46.5% 4,093 | 53.3% 4,691 | 0.2% 18 |
| 1932 | 35.0% 2,880 | 64.9% 5,337 | 0.2% 12 |
| 1928 | 62.7% 4,109 | 37.3% 2,444 | 0.1% 4 |
| 1924 | 56.2% 3,707 | 41.5% 2,734 | 2.3% 150 |
| 1920 | 66.0% 3,986 | 34.0% 2,056 | |
| 1916 | 56.6% 1,992 | 43.4% 1,528 | 0.0% 1 |
| 1912 | 58.3% 1,549 | 37.8% 1,004 | 4.0% 106 |
It is located in New Mexico's 3rd congressional district, which has a Cook Partisan Voting Index rating of D+7 and is represented by Democrat Ben R. Luján. In the New Mexico legislature it is represented by Representative Nick Salazar, Representative Debbie Rodella and Senator Richard Martinez.[19]
Current commissioners are:
| District | Name | Party | First elected | Term ends |
|---|---|---|---|---|
| District 1 | Barney Trujillo | Democratic | 2010 | 2018 |
| District 2 | Alex Naranjo | Democratic | 2014 | 2018 |
| District 3 | Danny Garcia | Democratic | 2012 | 2020 |
Education
School districts
Rio Arriba County has 6 public school districts. Española Public Schools is the largest.
- Chama Valley Independent Schools
- Jemez Mountain Public Schools
- Dulce Independent Schools
- Mesa Vista Consolidated Schools
- Espanola Public Schools
- Penasco Independent Schools
Colleges
- Northern New Mexico College with campuses in Española and El Rito
- New Mexico Highlands University campus in Española
Points of interest
Communities

City
Town
Village
Census-designated places
- Abiquiú
- Alcalde
- Brazos
- Canjilon
- Cañones
- Canova
- Chamita
- Chili
- Chimayo‡
- Cordova
- Coyote
- Dixon
- Dulce
- El Duende
- El Rito
- Ensenada
- Gallina
- Hernandez
- La Madera
- La Mesilla
- La Villita
- Los Luceros
- Los Ojos
- Lumberton
- Lyden
- Ohkay Owingeh
- Pueblito
- San Jose
- San Juan (former)
- Santa Clara Pueblo
- Tierra Amarilla (county seat)
- Truchas
- Velarde
- Youngsville
Other communities
Ghost towns
See also
References
- 1 2 "State & County QuickFacts". United States Census Bureau. Retrieved September 30, 2013.
- ↑ "Find a County". National Association of Counties. Retrieved June 7, 2011.
- ↑ David Rumsey Historical Map Collection
- 1 2 Twitchell, Ralph Emerson (1911–1917). The leading facts of New Mexican history. Cedar Rapids, Iowa: Torch Press. pp. 538–539. OCLC 3828708.
- ↑ "2010 Census Gazetteer Files". United States Census Bureau. August 22, 2012. Archived from the original on January 1, 2015. Retrieved January 2, 2015.
- ↑ "Population and Housing Unit Estimates". Retrieved June 9, 2017.
- ↑ "U.S. Decennial Census". United States Census Bureau. Retrieved January 2, 2015.
- ↑ "Historical Census Browser". University of Virginia Library. Retrieved January 2, 2015.
- ↑ "Population of Counties by Decennial Census: 1900 to 1990". United States Census Bureau. Retrieved January 2, 2015.
- ↑ "Census 2000 PHC-T-4. Ranking Tables for Counties: 1990 and 2000" (PDF). United States Census Bureau. Retrieved January 2, 2015.
- ↑ "American FactFinder". United States Census Bureau. Retrieved January 31, 2008.
- 1 2 3 "DP-1 Profile of General Population and Housing Characteristics: 2010 Demographic Profile Data". United States Census Bureau. Retrieved 2016-01-24.
- ↑ "Population, Housing Units, Area, and Density: 2010 - County". United States Census Bureau. Retrieved 2016-01-24.
- ↑ "DP02 SELECTED SOCIAL CHARACTERISTICS IN THE UNITED STATES – 2006-2010 American Community Survey 5-Year Estimates". United States Census Bureau. Retrieved 2016-01-24.
- ↑ "DP03 SELECTED ECONOMIC CHARACTERISTICS – 2006-2010 American Community Survey 5-Year Estimates". United States Census Bureau. Retrieved 2016-01-24.
- ↑ "Presidential election of 1956 - Map by counties". geoelections.free.fr. Retrieved 2016-07-27.
- ↑ "Gubernatorial General Election Map Comparison New Mexico". uselectionatlas.org. Retrieved 27 July 2016.
- ↑ Leip, David. "Dave Leip's Atlas of U.S. Presidential Elections". uselectionatlas.org. Retrieved 2018-04-01.
- ↑ "Districts - New Mexico Legislature". www.nmlegis.gov. Retrieved 2016-07-27.
Further reading
- Dethier, D.P. (2004). Geologic map of the Puye quadrangle, Los Alamos, Rio Arriba, Sandoval, and Santa Fe Counties, New Mexico [Miscellaneous Field Studies Map MF-2419)]. Reston, Va.: U.S. Department of the Interior, U.S. Geological Survey.
- Maldonado, F. (2008). Geologic map of the Abiquiu quadrangle, Rio Arriba County, New Mexico [Scientific Investigations Map 2998]. Reston, Va.: U.S. Department of the Interior, U.S. Geological Survey.
External links
| Wikimedia Commons has media related to Rio Arriba County, New Mexico. |
Places adjacent to Rio Arriba County, New Mexico | ||||||||||
|---|---|---|---|---|---|---|---|---|---|---|
| ||||||||||
Municipalities and communities of Rio Arriba County, New Mexico, United States | ||
|---|---|---|
| City | | |
| Village | ||
| CDPs |
| |
| Other unincorporated communities | ||
| Ghost towns and former settlements | ||
| Indian reservations | ||
| Footnotes | ‡This populated place also has portions in an adjacent county or counties | |
Santa Fe (capital) | ||
| Topics |
| |
| Society | ||
| Regions |
| |
| Cities | ||
| Counties | ||