Demographics of Canada
| Historical population | ||
|---|---|---|
| Year | Pop. | ±% |
| 1851 | 2,414,519 | — |
| 1861 | 3,174,442 | +31.5% |
| 1871 | 3,689,000 | +16.2% |
| 1881 | 4,325,000 | +17.2% |
| 1891 | 4,833,000 | +11.7% |
| 1901 | 5,371,000 | +11.1% |
| 1911 | 7,207,000 | +34.2% |
| 1921 | 8,788,000 | +21.9% |
| 1931 | 10,377,000 | +18.1% |
| 1941 | 11,507,000 | +10.9% |
| 1951 | 14,050,000 | +22.1% |
| 1961 | 18,271,000 | +30.0% |
| 1971 | 21,962,032 | +20.2% |
| 1981 | 24,819,915 | +13.0% |
| 1991 | 28,037,420 | +13.0% |
| 2001 | 31,020,596 | +10.6% |
| 2011 | 33,476,688 | +7.9% |
| 2016 | 35,151,728 | +5.0% |
| Starting in 1951, figures represent third quarter populations (July 1). Source: Statistics Canada, 1851–1941[1] and 1951–2011[2] | ||
This article is about the demographic features of the population of Canada, including population density, ethnicity, religious affiliations and other aspects of the population, the People of Canada.
Population
.svg.png)
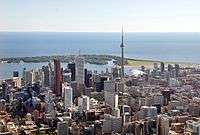
The Canada 2016 Census had a total population count of 35,151,728 individuals, making up approximately 0.5% of the world's total population.[3][4]
Provinces and territories
| Province or territory | Population, | Population, | Population
Change (%), 2011–2016 |
Total land area (km2) |
Density (people/km2) |
House of Commons seats |
People per seat | ||
|---|---|---|---|---|---|---|---|---|---|
| Number | Percentage | Number | Percentage | ||||||
| 13,448,494 | 38.26% | 12,851,821 | 38.39% | 4.64% | 1,076,395 | 12.49 | 121 | 111,145 | |
| 8,164,361 | 23.23% | 7,903,001 | 23.61% | 3.30% | 1,365,128 | 5.98 | 78 | 104,671 | |
| 4,648,055 | 13.22% | 4,400,057 | 13.14% | 5.63% | 925,186 | 5.02 | 42 | 110,668 | |
| 4,067,175 | 11.57% | 3,645,257 | 10.89% | 11.57% | 642,317 | 6.33 | 34 | 119,623 | |
| 1,278,365 | 3.64% | 1,208,268 | 3.61% | 5.80% | 553,556 | 2.31 | 14 | 91,312 | |
| 1,098,352 | 3.12% | 1,033,381 | 3.09% | 6.29% | 591,670 | 1.86 | 14 | 78,454 | |
| 923,598 | 2.63% | 921,727 | 2.75% | 0.20% | 53,338 | 17.32 | 11 | 83,963 | |
| 747,101 | 2.13% | 751,171 | 2.24% | -0.54% | 71,450 | 10.46 | 10 | 74,710 | |
| 519,716 | 1.48% | 514,536 | 1.54% | 1.01% | 373,872 | 1.39 | 7 | 74,245 | |
| 142,907 | 0.41% | 140,204 | 0.42% | 1.93% | 5,660 | 25.25 | 4 | 35,727 | |
| 41,786 | 0.12% | 41,462 | 0.12% | 0.78% | 1,183,085 | 0.04 | 1 | 41,786 | |
| 35,944 | 0.10% | 31,906 | 0.09% | 12.66% | 1,936,113 | 0.02 | 1 | 35,944 | |
| 35,874 | 0.10% | 33,897 | 0.10% | 5.83% | 474,391 | 0.08 | 1 | 35,874 | |
| 35,151,728 | 100% | 33,476,688 | 100% | 5.00% | 9,252,161 | 3.80 | 338 | 103,999 | |
Cities
| Rank | Name | Province | Pop. | Rank | Name | Province | Pop. | ||
|---|---|---|---|---|---|---|---|---|---|
 Toronto  Montreal |
1 | Toronto | Ontario | 2,731,571 | 11 | Quebec City | Quebec | 531,902 |  Calgary  Ottawa |
| 2 | Montreal | Quebec | 1,704,694 | 12 | Surrey | British Columbia | 517,887 | ||
| 3 | Calgary | Alberta | 1,239,220 | 13 | Laval | Quebec | 422,993 | ||
| 4 | Ottawa | Ontario | 934,243 | 14 | Halifax | Nova Scotia | 403,131 | ||
| 5 | Edmonton | Alberta | 932,546 | 15 | London | Ontario | 383,822 | ||
| 6 | Mississauga | Ontario | 721,599 | 16 | Markham | Ontario | 328,966 | ||
| 7 | Winnipeg | Manitoba | 705,244 | 17 | Vaughan | Ontario | 306,233 | ||
| 8 | Vancouver | British Columbia | 631,486 | 18 | Gatineau | Quebec | 276,245 | ||
| 9 | Brampton | Ontario | 593,638 | 19 | Saskatoon | Saskatchewan | 246,376 | ||
| 10 | Hamilton | Ontario | 536,917 | 20 | Longueuil | Quebec | 239,700 | ||
Census metropolitan areas
| CMA | Province | Population | CMA | Province | Population | |
|---|---|---|---|---|---|---|
| Toronto | Ontario | 5,928,040 | London | Ontario | 494,069 | |
| Montreal | Quebec | 4,098,927 | St. Catharines–Niagara | Ontario | 406,074 | |
| Vancouver | British Columbia | 2,463,431 | Halifax | Nova Scotia | 403,390 | |
| Calgary | Alberta | 1,392,609 | Oshawa | Ontario | 379,848 | |
| Ottawa–Gatineau | Ontario–Quebec | 1,323,783 | Victoria | British Columbia | 367,770 | |
| Edmonton | Alberta | 1,321,426 | Windsor | Ontario | 329,144 | |
| Quebec | Quebec | 800,296 | Saskatoon | Saskatchewan | 295,095 | |
| Winnipeg | Manitoba | 778,489 | Regina | Saskatchewan | 236,481 | |
| Hamilton | Ontario | 747,545 | Sherbrooke | Quebec | 212,105 | |
| Kitchener–Cambridge–Waterloo | Ontario | 523,894 | St. John's | Newfoundland and Labrador | 205,955 | |

Population growth rates
According to Organisation for Economic Co-operation and Development (OECD)/World Bank, the population in Canada increased from 1990 to 2008 with 5.6 million and 20.4% growth in population, compared to 21.7% growth in the United States and 31.2% growth in Mexico. According to the OECD/World Bank population statistics, for the same period the world population growth was 27%, a total of 1,423 million people.[8] However, over the same period, the population of France grew by 8.0%. And from 1991 to 2011, the population of the UK increased by 10.0%.
Total Fertility Rates in the 19th century
The total fertility rate is the number of children born per woman. Source: Statistics Canada.[9][10]
| Years | 1851 | 1871 | 1891 |
|---|---|---|---|
| Total Fertility Rate in Canada | 6.56 | 6.83 | 4.92 |
Life expectancy at birth from 1831 to 2015
Sources: Our World In Data and the United Nations.
1831-1950
| Years | 1831 | 1841 | 1851 | 1861 | 1871 | 1881 | 1891 | 1901 | 1911 | 1921 | 1922 | 1923 | 1924 | 1925 | 1926 | 1927 | 1928 | 1929 | 1930[11] |
|---|---|---|---|---|---|---|---|---|---|---|---|---|---|---|---|---|---|---|---|
| Life expectancy in Canada | 39.0 | 40.3 | 41.0 | 41.6 | 42.6 | 44.7 | 45.2 | 48.6 | 52.5 | 57.0 | 57.0 | 56.9 | 58.8 | 59.2 | 57.2 | 58.6 | 58.4 | 57.9 | 58.9 |
| Years | 1931 | 1932 | 1933 | 1934 | 1935 | 1936 | 1937 | 1938 | 1939 | 1940[11] |
|---|---|---|---|---|---|---|---|---|---|---|
| Life expectancy in Canada | 60.3 | 61.4 | 62.3 | 62.7 | 62.4 | 62.7 | 61.3 | 63.3 | 63.7 | 64.0 |
| Years | 1941 | 1942 | 1943 | 1944 | 1945 | 1946 | 1947 | 1948 | 1949 | 1950[11] |
|---|---|---|---|---|---|---|---|---|---|---|
| Life expectancy in Canada | 63.7 | 64.6 | 64.6 | 65.3 | 66.3 | 66.5 | 66.7 | 67.3 | 67.6 | 68.2 |
1950-2015
| Period | Life expectancy in Years |
Period | Life expectancy in Years |
|---|---|---|---|
| 1950–1955 | 69.1 | 1985–1990 | 76.8 |
| 1955–1960 | 70.3 | 1990–1995 | 77.8 |
| 1960–1965 | 71.3 | 1995–2000 | 78.6 |
| 1965–1970 | 72.2 | 2000–2005 | 79.7 |
| 1970–1975 | 73.0 | 2005–2010 | 80.8 |
| 1975–1980 | 74.3 | 2010–2015 | 81.8 |
| 1980–1985 | 75.9 |
Source: UN World Population Prospects[12]
Vital statistics
| [13][14][15] | Average population | Live births | Deaths | Natural change | Birth rate (per 1,000) | Death rate (per 1,000) | Natural change (per 1,000) | Total Fertility Rate[lower-alpha 1][10][16] |
|---|---|---|---|---|---|---|---|---|
| 1900 | 5,500,000 | 150,000 | 89,000 | 61,000 | 27.2 | 16.2 | 11.0 | |
| 1901 | 5,600,000 | 175,000 | 79,000 | 96,000 | 31.2 | 14.1 | 17.1 | |
| 1902 | 5,760,000 | 180,000 | 77,000 | 103,000 | 31.3 | 13.4 | 17.9 | 4.8 |
| 1903 | 5,930,000 | 186,000 | 78,000 | 108,000 | 31.3 | 13.2 | 18.1 | |
| 1904 | 6,100,000 | 192,000 | 82,000 | 110,000 | 31.4 | 13.5 | 17.9 | |
| 1905 | 6,280,000 | 195,000 | 82,000 | 113,000 | 31.0 | 13.0 | 18.0 | |
| 1906 | 6,460,000 | 193,000 | 85,000 | 108,000 | 29.9 | 13.2 | 16.7 | |
| 1907 | 6,650,000 | 196,000 | 85,000 | 111,000 | 29.5 | 12.8 | 16.7 | 4.74 |
| 1908 | 6,850,000 | 208,000 | 86,000 | 122,000 | 30.3 | 12.6 | 17.7 | |
| 1909 | 7,040,000 | 213,000 | 90,000 | 123,000 | 30.2 | 12.8 | 17.4 | |
| 1910 | 7,250,000 | 220,000 | 95,000 | 125,000 | 30.4 | 13.1 | 17.3 | |
| 1911 | 7,460,000 | 225,000 | 100,000 | 125,000 | 30.1 | 13.4 | 16.7 | 4.7 |
| 1912 | 7,610,000 | 238,000 | 99,000 | 139,000 | 31.3 | 13.0 | 19.3 | 4.62 |
| 1913 | 7,760,000 | 246,000 | 102,000 | 144,000 | 31.7 | 13.1 | 19.6 | |
| 1914 | 7,910,000 | 252,000 | 100,000 | 152,000 | 31.9 | 12.6 | 19.3 | |
| 1915 | 8,060,000 | 257,000 | 101,000 | 156,000 | 31.9 | 12.5 | 19.4 | |
| 1916 | 8,220,000 | 252,000 | 107,000 | 145,000 | 30.7 | 13.0 | 17.7 | |
| 1917 | 8,380,000 | 244,000 | 106,000 | 138,000 | 29.1 | 12.7 | 16.4 | 4.26 |
| 1918 | 8,450,000 | 243,000 | 134,000 | 109,000 | 28.8 | 15.9 | 12.9 | |
| 1919 | 8,710,000 | 241,000 | 119,000 | 122,000 | 27.7 | 13.7 | 14.0 | |
| 1920 | 8,880,000 | 259,000 | 118,000 | 141,000 | 29.2 | 13.3 | 15.9 | |
| 1921 | 9,060,000 | 265,000 | 105,000 | 160,000 | 29.3 | 11.6 | 17.7 | 3.98 |
| 1922 | 9,230,000 | 261,000 | 107,000 | 154,000 | 28.3 | 11.6 | 16.7 | 3.86 |
| 1923 | 9,400,000 | 251,000 | 111,000 | 140,000 | 26.7 | 11.8 | 14.9 | |
| 1924 | 9,560,000 | 255,000 | 104,000 | 151,000 | 26.7 | 10.9 | 15.8 | |
| 1925 | 9,730,000 | 254,000 | 104,000 | 150,000 | 26.1 | 10.7 | 15.4 | |
| 1926 | 9,890,000 | 244,000 | 113,000 | 131,000 | 24.7 | 11.4 | 13.3 | |
| 1927 | 10,040,000 | 244,000 | 110,000 | 134,000 | 24.3 | 11.0 | 13.3 | 3.32 |
| 1928 | 10,190,000 | 246,000 | 114,000 | 132,000 | 24.1 | 11.2 | 12.9 | |
| 1929 | 10,350,000 | 243,000 | 118,000 | 125,000 | 23.5 | 11.4 | 12.1 | 3.22 |
| 1930 | 10,498,000 | 251,000 | 113,000 | 138,000 | 23.9 | 10.8 | 13.1 | 3.28 |
| 1931 | 10,630,000 | 247,000 | 108,000 | 139,000 | 23.2 | 10.2 | 13.0 | 3.2 |
| 1932 | 10,794,000 | 243,000 | 108,000 | 135,000 | 22.5 | 10.0 | 12.5 | 3.08 |
| 1933 | 10,919,000 | 229,000 | 106,000 | 123,000 | 21.0 | 9.7 | 11.3 | 2.86 |
| 1934 | 11,029,000 | 228,296 | 105,277 | 123,019 | 20.7 | 9.5 | 11.2 | 2.8 |
| 1935 | 11,135,000 | 228,396 | 109,724 | 118,672 | 20.5 | 9.9 | 10.6 | 2.76 |
| 1936 | 11,242,000 | 227,980 | 111,111 | 116,869 | 20.3 | 9.9 | 10.4 | 2.70 |
| 1937 | 11,339,000 | 227,878 | 118,019 | 109,859 | 20.1 | 10.4 | 9.7 | 2.65 |
| 1938 | 11,448,000 | 237,091 | 110,647 | 126,444 | 20.7 | 9.7 | 11.0 | 2.70 |
| 1939 | 11,565,000 | 237,991 | 112,729 | 125,262 | 20.6 | 9.7 | 10.9 | 2.65 |
| 1940 | 11,682,000 | 252,577 | 114,717 | 137,860 | 21.6 | 9.8 | 11.8 | 2.77 |
| 1941 | 11,810,000 | 263,993 | 118,797 | 145,196 | 22.4 | 10.1 | 12.3 | 2.83 |
| 1942 | 11,962,000 | 281,569 | 117,110 | 164,459 | 23.5 | 9.8 | 13.7 | 2.96 |
| 1943 | 12,125,000 | 292,943 | 122,640 | 170,303 | 24.2 | 10.1 | 14.1 | 3.04 |
| 1944 | 12,291,000 | 283,967 | 120,393 | 163,574 | 24.0 | 9.8 | 14.2 | 3.01 |
| 1945 | 12,441,000 | 300,570 | 117,319 | 183,251 | 24.3 | 9.5 | 14.8 | 3.02 |
| 1946 | 12,637,000 | 343,504 | 118,785 | 224,719 | 27.2 | 9.4 | 17.8 | 3.37 |
| 1947 | 12,919,000 | 372,443 | 121,478 | 250,965 | 28.9 | 9.4 | 19.5 | 3.60 |
| 1948 | 13,167,000 | 359,860 | 122,974 | 236,886 | 27.3 | 9.3 | 18.0 | 3.44 |
| 1949 | 13,475,000 | 367,092 | 124,567 | 242,525 | 27.2 | 9.2 | 18.0 | 3.46 |
| 1950 | 13,737,000 | 372,009 | 124,220 | 247,789 | 27.1 | 9.0 | 18.0 | 3.46 |
| 1951 | 14,050,000 | 381,092 | 125,823 | 255,269 | 27.1 | 9.0 | 18.2 | 3.50 |
| 1952 | 14,496,000 | 403,559 | 126,385 | 277,174 | 27.8 | 8.7 | 19.1 | 3.64 |
| 1953 | 14,886,000 | 417,884 | 127,791 | 290,093 | 28.1 | 8.6 | 19.5 | 3.72 |
| 1954 | 15,330,000 | 436,198 | 124,855 | 311,343 | 28.5 | 8.1 | 20.3 | 3.83 |
| 1955 | 15,736,000 | 442,937 | 128,476 | 314,461 | 28.1 | 8.2 | 20.0 | 3.83 |
| 1956 | 16,123,000 | 450,739 | 131,961 | 318,778 | 28.0 | 8.2 | 19.8 | 3.86 |
| 1957 | 16,677,000 | 469,093 | 136,579 | 332,514 | 28.1 | 8.2 | 19.9 | 3.93 |
| 1958 | 17,120,000 | 470,118 | 135,201 | 334,917 | 27.5 | 7.9 | 19.6 | 3.88 |
| 1959 | 17,522,000 | 479,275 | 139,913 | 339,362 | 27.4 | 8.0 | 19.4 | 3.94 |
| 1960 | 17,909,000 | 478,551 | 139,693 | 338,858 | 26.7 | 7.8 | 18.9 | 3.895 |
| 1961 | 18,271,000 | 475,700 | 140,985 | 334,715 | 26.0 | 7.7 | 18.3 | 3.840 |
| 1962 | 18,614,000 | 469,693 | 143,699 | 325,994 | 25.2 | 7.7 | 17.5 | 3.767 |
| 1963 | 18,964,000 | 465,767 | 147,367 | 318,400 | 24.6 | 7.8 | 16.8 | 3.694 |
| 1964 | 19,325,000 | 452,915 | 145,850 | 307,065 | 23.4 | 7.5 | 15.9 | 3.192 |
| 1965 | 19,678,000 | 418,595 | 148,939 | 269,656 | 21.3 | 7.6 | 13.7 | 3.449 |
| 1966 | 20,048,000 | 387,710 | 149,863 | 237,847 | 19.3 | 7.5 | 11.9 | 2.749 |
| 1967 | 20,412,000 | 370,894 | 150,283 | 220,611 | 18.2 | 7.4 | 10.8 | 2.528 |
| 1968 | 20,744,000 | 364,310 | 153,196 | 211,114 | 17.6 | 7.4 | 10.2 | 2.386 |
| 1969 | 21,028,000 | 369,647 | 154,477 | 215,170 | 17.6 | 7.3 | 10.2 | 2.334 |
| 1970 | 21,324,000 | 371,988 | 155,961 | 216,027 | 17.4 | 7.3 | 10.1 | 2.258 |
| 1971 | 21,962,000 | 362,187 | 157,272 | 204,915 | 16.7 | 7.3 | 9.5 | 2.141 |
| 1972 | 22,218,000 | 347,319 | 162,413 | 184,906 | 15.8 | 7.4 | 8.4 | 1.98 |
| 1973 | 22,492,000 | 343,373 | 164,039 | 179,334 | 15.4 | 7.4 | 8.1 | 1.89 |
| 1974 | 22,808,000 | 350,650 | 166,794 | 178,851 | 15.3 | 7.4 | 7.9 | 1.837 |
| 1975 | 23,143,000 | 359,323 | 167,176 | 191,919 | 15.6 | 7.3 | 8.3 | 1.824 |
| 1976 | 23,450,000 | 359,987 | 167,009 | 192,978 | 15.4 | 7.2 | 8.3 | 1.796 |
| 1977 | 23,726,000 | 361,400 | 167,498 | 193,902 | 15.3 | 7.1 | 8.2 | 1.782 |
| 1978 | 23,963,000 | 358,852 | 168,179 | 190,673 | 15.0 | 7.0 | 8.0 | 1.768 |
| 1979 | 24,202,000 | 366,064 | 168,183 | 197,881 | 15.1 | 6.9 | 8.2 | 1.754 |
| 1980 | 24,516,000 | 370,709 | 171,473 | 199,236 | 15.1 | 7.0 | 8.1 | 1.74 |
| 1981 | 24,820,000 | 371,346 | 171,029 | 200,317 | 14.9 | 6.8 | 8.0 | 1.7 |
| 1982 | 25,117,000 | 373,082 | 174,413 | 198,669 | 14.8 | 6.9 | 7.9 | 1.69 |
| 1983 | 25,367,000 | 373,689 | 174,484 | 199,205 | 14.6 | 6.8 | 7.8 | 1.68 |
| 1984 | 25,608,000 | 377,031 | 175,727 | 201,304 | 14.6 | 6.8 | 7.8 | 1.65 |
| 1985 | 25,843,000 | 375,727 | 181,323 | 194,404 | 14.4 | 7.0 | 7.5 | 1.67 |
| 1986 | 26,101,000 | 372,913 | 184,224 | 188,689 | 14.3 | 7.1 | 7.2 | 1.675 |
| 1987 | 26,449,000 | 369,742 | 184,953 | 184,789 | 14.0 | 7.0 | 7.0 | 1.68 |
| 1988 | 26,795,000 | 376,795 | 190,011 | 186,784 | 14.1 | 7.1 | 7.0 | 1.68 |
| 1989 | 27,282,000 | 392,661 | 190,965 | 201,696 | 14.4 | 7.0 | 7.4 | 1.77 |
| 1990 | 27,698,000 | 405,486 | 191,973 | 213,513 | 14.6 | 6.9 | 7.7 | 1.83 |
| 1991 | 28,031,000 | 402,533 | 195,569 | 206,964 | 14.4 | 7.0 | 7.4 | 1.7 |
| 1992 | 28,367,000 | 398,643 | 196,535 | 202,108 | 14.1 | 6.9 | 7.1 | 1.71 |
| 1993 | 28,682,000 | 388,394 | 204,912 | 183,482 | 13.5 | 7.1 | 6.4 | 1.7 |
| 1994 | 28,999,000 | 385,114 | 207,077 | 178,037 | 13.3 | 7.1 | 6.1 | 1.67 |
| 1995 | 29,302,000 | 378,016 | 210,733 | 167,283 | 12.9 | 7.2 | 5.7 | 1.639 |
| 1996 | 29,611,000 | 366,200 | 212,880 | 153,320 | 12.4 | 7.2 | 5.2 | 1.592 |
| 1997 | 29,907,000 | 348,598 | 215,669 | 132,929 | 11.7 | 7.2 | 4.4 | 1.55 |
| 1998 | 30,157,000 | 342,418 | 218,091 | 124,327 | 11.4 | 7.2 | 4.1 | 1.53 |
| 1999 | 30,404,000 | 337,249 | 219,530 | 117,719 | 11.1 | 7.2 | 3.9 | 1.51 |
| 2000 | 30,689,000 | 327,882 | 218,062 | 109,820 | 10.7 | 7.1 | 3.6 | 1.49 |
| 2001 | 31,021,000 | 333,744 | 219,538 | 114,206 | 10.8 | 7.1 | 3.7 | 1.505 |
| 2002 | 31,373,000 | 328,802 | 223,603 | 105,199 | 10.5 | 7.1 | 3.4 | 1.52 |
| 2003 | 31,676,000 | 335,202 | 226,169 | 109,033 | 10.6 | 7.1 | 3.4 | 1.53 |
| 2004 | 31,941,000 | 337,072 | 226,584 | 110,488 | 10.6 | 7.1 | 3.5 | 1.53 |
| 2005 | 32,245,000 | 342,176 | 230,132 | 112,044 | 10.6 | 7.1 | 3.5 | 1.54 |
| 2006 | 32,576,000 | 354,617 | 228,079 | 126,538 | 10.9 | 7.0 | 3.9 | 1.586 |
| 2007 | 32,930,000 | 367,864 | 235,217 | 132,647 | 11.2 | 7.1 | 4.0 | 1.659 |
| 2008 | 33,318,000 | 377,886 | 238,617 | 139,269 | 11.3 | 7.2 | 4.2 | 1.681 |
| 2009 | 33,727,000 | 380,863 | 242,277 | 138,586 | 11.3 | 7.2 | 4.1 | 1.668 |
| 2010 | 34,127,000 | 377,213 | 247,926 | 129,287 | 11.1 | 7.3 | 3.8 | 1.627 |
| 2011 | 34,484,000 | 377,636 | 254,731 | 122,905 | 11.0 | 7.4 | 3.6 | 1.61 |
| 2012 | 34,880,000 | 381,869 | 256,965 | 124,904 | 10.9 | 7.4 | 3.6 | 1.614 |
| 2013 | 35,293,000 | 380,323 | 256,982 | 123,341 | 10.8 | 7.3 | 3.5 | 1.587 |
| 2014 | 35,667,000 | 383,478 | 259,520 | 123,958 | 10.7 | 7.3 | 3.4 | 1.582 |
| 2015 | 35,981,000 | 385,292 | 267,353 | 117,939 | 10.7 | 7.4 | 3.3 | 1.563 |
| 2016 | 36,503,000 | 389,874 | 273,374 | 116,500 | 10.6 | 7.5 | 3.2 | 1.543 |
| 2017 | 36,963,000 | 390,573 | 281,457 | 109,116 | 10.3 | 7.6 | 3.0 | 1.494 |
Current population growth
- Births from January–March 2017 =

- Births from January–March 2018 =
- Deaths from January–March 2017 =

- Deaths from January–March 2018 =
- Natural increase from January–March 2017 =

- Natural increase from January–March 2018 =
Population projection
|
| |||||||||||||||||||||||||||||||||||||||||||||
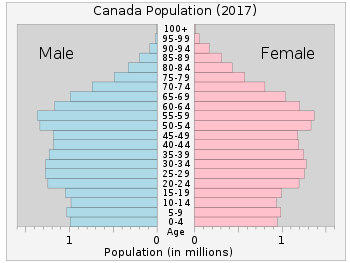
Age characteristics
| Population by age and gender, 2016[20] | ||||
|---|---|---|---|---|
| Age group | Male | Female | Total | Percent |
| 0 to 4 years | 973,030 | 925,760 | 1,898,790 | 5.4% |
| 5 to 9 years | 1,034,685 | 983,445 | 2,018,130 | 5.7% |
| 10 to 14 years | 985,200 | 937,445 | 1,922,645 | 5.5% |
| 15 to 19 years | 1,039,215 | 986,940 | 2,026,160 | 5.8% |
| 20 to 24 years | 1,144,495 | 1,098,200 | 2,242,690 | 6.4% |
| 25 to 29 years | 1,144,470 | 1,141,515 | 2,285,990 | 6.5% |
| 30 to 34 years | 1,148,290 | 1,181,110 | 2,329,395 | 6.6% |
| 35 to 39 years | 1,118,635 | 1,169,730 | 2,288,365 | 6.5% |
| 40 to 44 years | 1,104,440 | 1,150,695 | 2,255,135 | 6.4% |
| 45 to 49 years | 1,157,760 | 1,202,210 | 2,359,965 | 6.7% |
| 50 to 54 years | 1,318,755 | 1,359,320 | 2,678,075 | 7.6% |
| 55 to 59 years | 1,285,190 | 1,335,055 | 2,620,240 | 7.5% |
| 60 to 64 years | 1,114,885 | 1,175,630 | 2,290,510 | 6.5% |
| 65 to 69 years | 953,075 | 1,019,405 | 1,972,480 | 5.6% |
| 70 to 74 years | 677,975 | 742,900 | 1,420,875 | 4% |
| 75 to 79 years | 469,550 | 552,300 | 1,021,850 | 2.9% |
| 80 to 84 years | 325,765 | 423,880 | 749,650 | 2.1% |
| 85 years and over | 268,790 | 501,990 | 770,780 | 2.2% |
| Total | 16,414,225 | 17,062,460 | 33,476,685 | 100% |
| 0 to 14 years | 2,992,920 | 2,846,645 | 5,839,565 | 16.6% |
| 15 to 64 years | 11,576,130 | 11,800,400 | 23,376,530 | 66.5% |
| 65 years and over | 2,695,150 | 3,240,485 | 5,935,630 | 16.9% |
Other demographics statistics
32.3% of Canadians considered their ethnic origin to be Canadian. Other major groups recorded were English (18.3%), Scottish (13.9%), French (13.6%), Irish (13.4%), German (9.6%) and Chinese (5.1%). When reading these figures, you should bear in mind that census respondents could select multiple ethnic groups.[21]
Nearly 22% of the population is now foreign-born, and about 60% of new immigrants come from Asia, particularly China and India.[21]
Frank Trovato, a professor of population and demography studies at the University of Alberta, told CBS news that "Canada needs a robust increase to keep up with demands in the workforce and maintain a strong economy. It may be time for policymakers in the country to consider ways to boost Canada's fertility rates, such as with "family friendly" policies that allow women to combine a family with a career."[21]
Although there are 11 aboriginal languages, only a few are spoken by enough people to ensure that they are safe from extinction.[21]
Demographic statistics according to the World Population Review (beginning of 2018).[21]
- One birth every 1 minutes
- One death every 2 minutes
- One net migrant every 2 minutes
- Net gain of one person every 2 minutes
Demographic statistics according to the CIA World Factbook, unless otherwise indicated.[16]
- Population
- 35,623,680 (July 2017 est.)
- Age structure
- 0-14 years: 15.44% (male 2,819,279/female 2,680,024)
- 15-24 years: 11.85% (male 2,171,703/female 2,048,546)
- 25-54 years: 39.99% (male 7,227,145/female 7,020,156)
- 55-64 years: 14.1% (male 2,492,120/female 2,529,652)
- 65 years and over: 18.63% (male 2,958,721/female 3,676,334) (2017 est.)
- Total fertility rate
- 1.6 children born/woman (2017 est.) Country comparison to the world: 183rd
- Median age
- total: 42.2 years. Country comparison to the world: 29th
- male: 40.9 years
- female: 43.5 years (2017 est.)
- total: 40.6 years
- male: 39.6 years
- female: 41.5 years (2011)
- Median age by province and territory, 2011
- Newfoundland and Labrador: 44.0
- Nova Scotia: 43.7
- New Brunswick:43.7
- Prince Edward Island: 42.8
- Quebec: 41.9
- British Columbia: 41.9
- Ontario: 40.4
- Yukon: 39.1
- Manitoba: 38.4
- Saskatchewan: 38.2
- Alberta: 36.5
- Northwest Territories: 32.3
- Nunavut: 24.1
Total: 40.6
- Sources: Statistics Canada[22]
- Population growth rate
- 0.73% (2017 est.) Country comparison to the world: 141st
- Birth rate
- 10.3 births/1,000 population (2017 est.) Country comparison to the world: 190th
- Death rate
- 8.7 deaths/1,000 population (2017 est.)
- Net migration rate
- 5.7 migrant(s)/1,000 population (2017 est.) Country comparison to the world: 18th
- 5.65 migrant(s)/1,000 population (2013 est.)
- Mother's mean age at first birth
- 28.1 years (2012 est.)
- Life expectancy at birth
- total population: 81.9 years. Country comparison to the world: 21st
- male: 79.3 years
- female: 84.7 years (2017 est.)
- Ethnic groups
Canadian 32.2%, English 19.8%, French 15.5%, Scottish 14.4%, Irish 13.8%, German 9.8%, Italian 4.5%, Chinese 4.5%, North American Indian 4.2%, other 50.9%
Note: percentages add up to more than 100% because respondents were able to identify more than one ethnic origin (2011 est.)
- Languages
English (official) 58.7%, French (official) 22%, Punjabi 1.4%, Italian 1.3%, Spanish 1.3%, German 1.3%, Cantonese 1.2%, Tagalog 1.2%, Arabic 1.1%, other 10.5% (2011 est.)
- Population distribution
vast majority of Canadians are positioned in a discontinuous band within approximately 300 km of the southern border with the United States; the most populated province is Ontario, followed by Quebec and British Columbia
- Religions
Catholic 39% (includes Roman Catholic 38.8%, other Catholic .2%), Protestant 20.3% (includes United Church 6.1%, Anglican 5%, Baptist 1.9%, Lutheran 1.5%, Pentecostal 1.5%, Presbyterian 1.4%, other Protestant 2.9%), Orthodox 1.6%, other Christian 6.3%, Muslim 3.2%, Hindu 1.5%, Sikh 1.4%, Buddhist 1.1%, Jewish 1%, other 0.6%, none 23.9% (2011 est.)
- Dependency ratios
- total dependency ratio: 47.3
- youth dependency ratio: 23.5
- elderly dependency ratio: 23.8
- potential support ratio: 4.2 (2015 est.)
- Unemployment, youth ages 15–24
- total: 13.1% Country comparison to the world: 100th
- male: 14.8%
- female: 11.3% (2016 est.)
- Urbanization
- urban population: 81% of total population (2010)
- rate of urbanization: 1.1% annual rate of change (2010–2015 est.)
Sex ratio:
- at birth: 1.06 male(s)/female
- under 15 years: 1.05 male(s)/female
- 15 – 24 years: 1.06 male(s)/female
- 25 – 54 years: 1.03 male(s)/female
- 55 – 64 years: 0.98 male(s)/female
- 65 years and over: 0.79 male(s)/female
- total population: 0.99 male(s)/female (2013 est.)
- Infant mortality rate
- total: 4.5 deaths/1,000 live births. Country comparison to the world: 180th
- male: 4.8 deaths/1,000 live births
- female: 4.2 deaths/1,000 live births (2017 est.)
- Maternal mortality rate
- 7 deaths/100,000 live births (2015. World Health Organization[23]) Country comparison to the world: 161st
Ethnicity
Ethnic origin
As data is completely self-reported, and reporting individuals may have varying definitions of "Ethnic origin" (or may not know their ethnic origin), these figures should not be considered an exact record of the relative prevalence of different ethno-cultural ancestries but rather how Canadians self-identify.
Statistics Canada projects that immigrants will represent between 24.5% and 30.0% of Canada’s population in 2036, compared with 20.7% in 2011.[24] Statistics Canada further projects that visible minorities will make up 33.7-34.3% of Canada's total population, compared to 22.3% in 2016.[25]
Counting both single and multiple responses, the most commonly identified ethnic origins were (2016):
| Ethnic origin[26] | % | Population |
|---|---|---|
| Canadian[lower-alpha 2] | 32.32% | 11,135,965 |
| English | 18.34% | 6,320,085 |
| Scottish | 13.93% | 4,799,010 |
| French | 13.55% | 4,670,595 |
| Irish | 13.43% | 4,627,000 |
| German | 9.64% | 3,322,405 |
| Chinese | 5.13% | 1,769,195 |
| Italian | 4.61% | 1,587,970 |
| First Nations[lower-alpha 3] | 4.43% | 1,525,565 |
| East Indian | 3.99% | 1,374,710 |
| Ukrainian | 3.95% | 1,359,655 |
| Dutch | 3.23% | 1,111,655 |
| Polish | 3.21% | 1,106,585 |
| Filipino | 2.43% | 837,130 |
| British, not included elsewhere | 1.87% | 644,695 |
| Russian | 1.81% | 622,445 |
| Métis | 1.74% | 600,000 |
| Portuguese | 1.40% | 482,610 |
| Welsh | 1.38% | 474,805 |
| Norwegian | 1.34% | 463,275 |
| Spanish | 1.15% | 396,460 |
| American | 1.10% | 377,410 |
| Swedish | 1.02% | 349,640 |
| Hungarian | 1.01% | 348,085 |
The most common ethnic origins per province are as follows in 2006[27] (total responses; only percentages 10% or higher shown; ordered by percentage of "Canadian"):
- Quebec (7,723,525): Canadian (59.1%), French (29.1%)
- New Brunswick (735,835): Canadian (50.3%), French (27.2%), English (25.9%), Irish (21.6%), Scottish (19.9%)
- Newfoundland and Labrador (507,265): Canadian (49.0%), English (43.4%), Irish (21.8%)
- Nova Scotia (906,170): Canadian (39.1%), Scottish (31.2%), English (30.8%), Irish (22.3%), French (17.0%), German (10.8%)
- Prince Edward Island (137,375): Scottish (39.3%), Canadian (36.8%), English (31.1%), Irish (30.4%), French (21.1%)
- Ontario (12,651,795): Canadian (23.3%), English (23.1%), Scottish (16.4%), Irish (16.4%), French (10.8%), German (9.5%), Italian (7.2%)
- Alberta (3,567,980): English (24.9%), Canadian (21.8%), German (19.2%), Scottish (18.8%), Irish (15.8%), French (11.1%)
- Manitoba (1,174,345): English (21.8%), German (18.6%), Canadian (18.5%), Scottish (18.0%), Ukrainian (14.9%), Irish (13.2%), French (12.6%), North American Indian (10.6%)
- Saskatchewan (1,008,760): German (28.6%), English (24.9%), Scottish (18.9%), Canadian (18.8%), Irish (15.5%), Ukrainian (13.5%), French (12.2%), North American Indian (12.1%)
- British Columbia (4,324,455): English (27.7%), Scottish (19.3%), Canadian (19.1%), German (13.1%), Chinese (10.7%)
- Yukon (33,320): English (28.5%), Scottish (25.0%), Irish (22.0%), North American Indian (21.8%), Canadian (21.8%), German (15.6%), French (13.1%)
- Northwest Territories (40,800): North American Indian (37.0%), Scottish (13.9%), English (13.7%), Canadian (12.8%), Irish (11.9%), Inuit (11.7%)
- Nunavut (31,700): Inuit (85.4%)
Bold indicates either that this response is dominant within this province, or that this province has the highest ratio (percentage) of this response among provinces.
Visible minority population
| Visible and non-visible minority populations by group, 1996–2016 | ||||||||||
|---|---|---|---|---|---|---|---|---|---|---|
| Group | 1996[28][29] | 2001[30] | 2006[31] | 2011[32] | 2016[33] | |||||
| Total | Pct. | Total | Pct. | Total | Pct. | Total | Pct. | Total | Pct. | |
| Total visible minority population | 3,197,480 | 11.2% | 3,983,845 | 13.4% | 5,068,095 | 16.2% | 6,264,750 | 19.1% | 7,674,580 | 22.3% |
| South Asian | 670,590 | 2.4% | 917,075 | 3.1% | 1,262,865 | 4% | 1,567,400 | 4.8% | 1,924,635 | 5.6% |
| Chinese | 860,150 | 3% | 1,029,395 | 3.5% | 1,216,565 | 3.9% | 1,324,750 | 4% | 1,769,195 | 5.1% |
| Black | 573,860 | 2% | 662,215 | 2.2% | 783,795 | 2.5% | 945,665 | 2.9% | 1,198,540 | 3.5% |
| Filipino | 234,195 | 0.8% | 308,575 | 1% | 410,695 | 1.3% | 619,310 | 1.9% | 780,125 | 2.3% |
| Latin American | 176,970 | 0.6% | 216,980 | 0.7% | 304,245 | 1% | 381,280 | 1.2% | 447,325 | 1.3% |
| Arab/West Asian | 244,665 | 0.9% | ||||||||
| Arab | 194,685 | 0.7% | 265,550 | 0.9% | 380,620 | 1.2% | 523,235 | 1.5% | ||
| Southeast Asian | 172,765 | 0.6% | 198,880 | 0.7% | 239,935 | 0.8% | 312,075 | 0.9% | 313,260 | 0.9% |
| West Asian | 109,285 | 0.4% | 156,700 | 0.5% | 206,840 | 0.6% | 264,305 | 0.8% | ||
| Korean | 64,835 | 0.2% | 100,660 | 0.3% | 141,890 | 0.5% | 161,130 | 0.5% | 188,710 | 0.5% |
| Japanese | 68,135 | 0.2% | 73,315 | 0.2% | 81,300 | 0.3% | 87,270 | 0.3% | 92,920 | 0.3% |
| Visible minority, n.i.e. | 69,745 | 0.2% | 98,915 | 0.3% | 71,420 | 0.2% | 106,475 | 0.3% | 132,090 | 0.4% |
| Multiple visible minorities | 61,575 | 0.2% | 73,875 | 0.2% | 133,120 | 0.4% | 171,935 | 0.5% | 232,375 | 0.7% |
| Not a visible minority | 25,330,645 | 88.8% | 25,655,185 | 86.6% | 26,172,935 | 83.8% | 26,587,575 | 80.9% | 26,785,480 | 77.7% |
| Aboriginal identity (see breakdown below) | 799,005 | 2.8% | 976,305 | 3.3% | 1,172,785 | 3.8% | 1,400,685 | 4.3% | 1,673,785 | 4.9% |
| Others (European or White) | 24,531,640 | 86% | 24,678,880 | 83.3% | 25,000,150 | 80% | 25,186,890 | 76.7% | 25,111,695 | 72.9% |
| Total population in private households | 28,528,125 | 100% | 29,639,030 | 100% | 31,241,030 | 100% | 32,852,320 | 100% | 34,460,065 | 100% |
By province and territory
| Visible minority population by province and territory, 2011[34] | |||||||||||||||||||||
|---|---|---|---|---|---|---|---|---|---|---|---|---|---|---|---|---|---|---|---|---|---|
| Province/territory | Not a visible minority | South Asian | Chinese | Black | Filipino | Latin American | Arab | Southeast Asian | West Asian | Korean | Japanese | Visible minority, n.i.e. | Multiple visible minorities | Total visible minority population | Total population | Percent visible minority | |||||
| Alberta[35] | 2,690,960 | 156,665 | 133,390 | 74,435 | 106,035 | 41,305 | 34,920 | 41,025 | 16,030 | 15,000 | 12,415 | 6,270 | 18,840 | 656,325 | 3,567,980 | 18.39% | |||||
| British Columbia[36] | 2,911,295 | 313,440 | 438,140 | 33,260 | 126,040 | 35,465 | 14,090 | 51,970 | 38,960 | 53,770 | 38,120 | 6,465 | 31,160 | 1,180,870 | 4,324,455 | 27.31% | |||||
| Manitoba[37] | 824,830 | 25,265 | 17,025 | 19,610 | 59,220 | 9,140 | 3,235 | 7,565 | 2,040 | 3,045 | 1,745 | 1,765 | 3,975 | 153,625 | 1,174,350 | 13.08% | |||||
| New Brunswick[38] | 696,080 | 2,445 | 2,540 | 4,870 | 1,100 | 1,160 | 1,380 | 730 | 305 | 1,855 | 305 | 85 | 360 | 17,135 | 735,835 | 2.33% | |||||
| Newfoundland and Labrador[39] | 464,540 | 1,855 | 1,645 | 1,455 | 350 | 185 | 370 | 320 | 155 | 80 | 60 | 205 | 250 | 6,930 | 507,270 | 1.37% | |||||
| Northwest Territories[40] | 16,920 | 185 | 380 | 555 | 895 | 105 | 115 | 230 | 60 | 50 | 45 | 75 | 30 | 2,720 | 40,800 | 6.67% | |||||
| Nova Scotia[41] | 825,055 | 4,965 | 6,050 | 20,790 | 1,890 | 1,360 | 6,290 | 1,155 | 1,365 | 960 | 445 | 720 | 1,290 | 47,270 | 906,175 | 5.22% | |||||
| Nunavut[42] | 3,825 | 95 | 65 | 120 | 130 | 25 | 15 | 30 | 0 | 10 | 0 | 10 | 0 | 510 | 31,700 | 1.61% | |||||
| Ontario[43] | 9,070,800 | 965,990 | 629,140 | 539,205 | 275,380 | 172,560 | 151,645 | 137,875 | 122,530 | 78,290 | 29,085 | 81,130 | 96,735 | 3,279,565 | 12,651,795 | 25.92% | |||||
| Prince Edward Island[44] | 130,890 | 485 | 1,830 | 390 | 85 | 235 | 200 | 205 | 345 | 140 | 210 | 75 | 70 | 4,260 | 137,380 | 3.10% | |||||
| Quebec[45] | 6,740,375 | 83,320 | 82,845 | 243,625 | 31,495 | 116,380 | 166,260 | 65,855 | 23,445 | 6,665 | 4,025 | 8,895 | 17,420 | 850,235 | 7,732,525 | 11.00% | |||||
| Saskatchewan[46] | 787,745 | 12,325 | 11,300 | 7,255 | 16,025 | 3,250 | 2,095 | 4,910 | 1,600 | 1,270 | 720 | 745 | 1,775 | 63,275 | 1,008,760 | 6.27% | |||||
| Yukon[47] | 23,590 | 365 | 400 | 100 | 675 | 110 | 0 | 210 | 0 | 0 | 80 | 35 | 35 | 2,025 | 33,320 | 6.08% | |||||
| Canada[48] | 25,186,890 | 1,567,400 | 1,324,750 | 945,665 | 619,310 | 381,280 | 380,620 | 312,075 | 206,840 | 161,130 | 87,270 | 106,475 | 171,935 | 6,264,750 | 32,852,325 | 19.07% | |||||
By city over 100,000
| Visible minority in Canadian cities over 100,000 people, 2016[34] | ||||||||||||||
|---|---|---|---|---|---|---|---|---|---|---|---|---|---|---|
| City | Population | Visible minority | Black | East Asian | Latin American | South Asian | Southeast Asian | West Asian | Arab | Multiracial | Other | |||
| Toronto | 2,731,571 | 51.5% | 8.9% | 13.2% | 2.9% | 12.6% | 7.2% | 2.2% | 1.3% | 1.8% | 1.4% | |||
| Montreal | 1,704,694 | 34.2% | 10.3% | 3.7% | 4.1% | 3.3% | 3.5% | 0.9% | 7.3% | 0.7% | 0.3% | |||
| Calgary | 1,239,220 | 36.2% | 4.2% | 8.5% | 2.1% | 9.5% | 7.3% | 1.0% | 2.0% | 1.1% | 0.4% | |||
| Ottawa | 934,243 | 26.3% | 6.6% | 5.1% | 1.2% | 4.2% | 2.7% | 1.0% | 4.5% | 0.9% | 0.3% | |||
| Edmonton | 932,546 | 37.1% | 5.9% | 7.3% | 1.9% | 9.5% | 7.7% | 0.7% | 2.6% | 1.1% | 0.4% | |||
| Mississauga | 721,599 | 57.2% | 6.6% | 8.7% | 2.3% | 23.2% | 7.2% | 1.1% | 5.1% | 1.9% | 1.3% | |||
| Winnipeg | 705,224 | 28.0% | 3.9% | 3.6% | 1.0% | 5.4% | 11.8% | 0.4% | 0.7% | 0.9% | 0.4% | |||
| Vancouver | 631,486 | 51.6% | 1.0% | 30.2% | 1.8% | 6.0% | 8.7% | 1.4% | 0.5% | 1.8% | 0.2% | |||
| Brampton | 593,638 | 73.3% | 13.9% | 1.7% | 2.4% | 44.3% | 4.8% | 0.9% | 1.0% | 1.6% | 2.7% | |||
| Hamilton | 536,917 | 19.0% | 3.8% | 2.5% | 1.6% | 4.2% | 2.8% | 0.9% | 2.0% | 0.7% | 0.5% | |||
| Quebec City | 531,902 | 6.4% | 2.4% | 0.5% | 1.3% | 0.3% | 0.5% | 0.1% | 1.2% | 0.1% | 0.1% | |||
| Surrey | 517,887 | 58.5% | 1.8% | 7.8% | 1.4% | 32.8% | 8.8% | 0.7% | 1.1% | 1.2% | 0.4% | |||
| Laval | 422,993 | 26.1% | 7.8% | 1.0% | 3.1% | 2.1% | 2.1% | 1.0% | 8.2% | 0.3% | 0.1% | |||
| Halifax | 403,131 | 11.4% | 3.8% | 2.2% | 0.3% | 1.6% | 0.9% | 0.3% | 1.8% | 0.3% | 0.1% | |||
| London | 383,822 | 19.9% | 3.0% | 3.8% | 2.4% | 3.1% | 2.1% | 0.9% | 3.6% | 0.6% | 0.4% | |||
| Markham | 328,966 | 77.9% | 2.9% | 46.8% | 0.5% | 17.8% | 3.8% | 2.4% | 1.0% | 2.1% | 0.9% | |||
| Vaughan | 306,233 | 35.4% | 2.7% | 8.7% | 2.4% | 10.1% | 5.1% | 2.9% | 1.4% | 1.4% | 0.8% | |||
| Gatineau | 276,245 | 13.5% | 6.1% | 1.0% | 1.5% | 0.4% | 0.7% | 0.3% | 3.1% | 0.3% | 0.2% | |||
| Longueuil | 239,700 | 18.6% | 7.0% | 1.4% | 3.1% | 0.8% | 1.3% | 0.8% | 3.2% | 0.4% | 0.3% | |||
| Burnaby | 232,755 | 63.6% | 1.6% | 38.9% | 2.0% | 8.1% | 7.7% | 2.2% | 0.7% | 2.1% | 0.3% | |||
| Saskatoon | 246,376 | 19.8% | 2.2% | 3.6% | 0.8% | 5.5% | 5.4% | 0.5% | 1.0% | 0.6% | 0.2% | |||
| Kitchener | 233,222 | 21.8% | 4.1% | 2.6% | 2.6% | 5.0% | 2.9% | 1.2% | 1.8% | 0.8% | 0.8% | |||
| Windsor | 217,188 | 26.9% | 5.0% | 3.6% | 1.2% | 4.5% | 3.0% | 0.6% | 7.5% | 0.9% | 0.6% | |||
| Regina | 215,106 | 19.2% | 3.0% | 6.2% | 0.6% | 5.9% | 5.2% | 0.3% | 0.7% | 0.4% | 0.2% | |||
| Richmond | 198,309 | 76.3% | 0.6% | 55.6% | 0.8% | 7.3% | 7.9% | 0.6% | 0.8% | 2.4% | 0.2% | |||
| Richmond Hill | 195,022 | 60.0% | 2.0% | 32.5% | 0.8% | 7.7% | 2.7% | 10.4% | 1.8% | 1.6% | 0.4% | |||
| Oakville | 193,832 | 30.8% | 2.9% | 9.0% | 1.9% | 8.9% | 2.4% | 1.1% | 3.2% | 1.0% | 0.4% | |||
| Burlington | 183,314 | 16.0% | 2.1% | 2.9% | 1.3% | 4.8% | 2.0% | 0.6% | 1.4% | 0.6% | 0.4% | |||
| Greater Sudbury | 161,531 | 3.8% | 0.9% | 0.7% | 0.2% | 0.9% | 0.4% | 0.1% | 0.4% | 0.1% | 0.0% | |||
| Sherbrooke | 161,323 | 7.3% | 2.2% | 0.4% | 1.7% | 0.3% | 0.4% | 0.8% | 1.2% | 0.2% | 0.0% | |||
| Oshawa | 159,458 | 16.0% | 5.5% | 2.0% | 0.8% | 3.8% | 1.6% | 0.4% | 0.6% | 0.8% | 0.8% | |||
| Saguenay | 145,949 | 1.4% | 0.5% | 0.2% | 0.2% | 0.1% | 0.1% | 0.0% | 0.2% | 0.0% | 0.0% | |||
| Lévis | 143,414 | 2.2% | 0.7% | 0.3% | 0.4% | 0.1% | 0.2% | 0.0% | 0.4% | 0.0% | 0.0% | |||
| Barrie | 141,434 | 10.3% | 2.7% | 1.8% | 1.1% | 2.2% | 1.4% | 0.2% | 0.3% | 0.4% | 0.3% | |||
| Abbotsford | 141,397 | 33.7% | 1.0% | 3.0% | 0.8% | 25.5% | 2.2% | 0.2% | 0.2% | 0.5% | 0.2% | |||
| St. Catharines | 133,113 | 12.7% | 2.9% | 2.7% | 1.7% | 1.4% | 1.8% | 0.3% | 1.1% | 0.7% | 0.2% | |||
| Trois-Rivières | 134,413 | 3.5% | 1.4% | 0.3% | 0.8% | 0.1% | 0.2% | 0.0% | 0.6% | 0.0% | 0.0% | |||
| Cambridge | 129,920 | 15.6% | 2.5% | 1.4% | 1.3% | 6.2% | 2.1% | 0.3% | 0.8% | 0.4% | 0.6% | |||
| Coquitlam | 139,284 | 50.2% | 1.1% | 29.3% | 1.6% | 4.5% | 5.2% | 5.6% | 1.0% | 1.7% | 0.2% | |||
| Kingston | 123,798 | 9.7% | 1.5% | 2.7% | 0.7% | 2.0% | 1.1% | 0.4% | 0.8% | 0.4% | 0.1% | |||
| Whitby | 128,377 | 25.3% | 8.0% | 3.1% | 1.1% | 6.6% | 2.4% | 1.0% | 0.8% | 1.5% | 0.9% | |||
| Guelph | 131,794 | 18.8% | 2.2% | 3.6% | 1.0% | 5.0% | 4.1% | 1.2% | 0.6% | 0.9% | 0.2% | |||
| Kelowna | 127,380 | 9.5% | 0.8% | 2.9% | 0.6% | 2.6% | 1.6% | 0.3% | 0.2% | 0.3% | 0.2% | |||
| Saanich | 114,148 | 22.1% | 1.0% | 10.5% | 0.7% | 5.0% | 3.0% | 0.4% | 0.6% | 0.6% | 0.2% | |||
| Ajax | 119,677 | 56.7% | 16.7% | 3.2% | 1.4% | 20.9% | 5.3% | 2.4% | 1.7% | 2.4% | 2.7% | |||
| Thunder Bay | 107,909 | 4.5% | 0.6% | 1.1% | 0.3% | 0.9% | 0.8% | 0.2% | 0.3% | 0.2% | 0.0% | |||
| Terrebonne | 111,575 | 11.8% | 4.5% | 0.4% | 1.7% | 0.1% | 0.6% | 0.1% | 1.7% | 0.1% | 0.0% | |||
| St. John's | 108,860 | 7.0% | 1.4% | 1.6% | 0.5% | 1.5% | 0.7% | 0.2% | 1.0% | 0.1% | 0.1% | |||
| Langley | 117,285 | 18.7% | 1.0% | 8.0% | 0.9% | 4.4% | 3.0% | 0.3% | 0.3% | 0.5% | 0.1% | |||
| Chatham-Kent | 101,647 | 4.6% | 2.1% | 0.6% | 0.2% | 0.6% | 0.5% | 0.0% | 0.2% | 0.2% | 0.1% | |||
| Milton | 110,128 | 42.8% | 4.8% | 3.1% | 2.4% | 21.0% | 4.7% | 0.9% | 3.5% | 1.4% | 0.9% | |||
| Waterloo | 104,986 | 26.4% | 1.9% | 10.6% | 1.4% | 6.4% | 1.7% | 1.1% | 1.8% | 0.9% | 0.6% | |||
| Delta | 102,238 | 36.0% | 0.8% | 9.2% | 0.8% | 20.3% | 3.2% | 0.3% | 0.3% | 0.8% | 0.3% | |||
| Red Deer | 100,418 | 15.5% | 1.8% | 1.8% | 1.8% | 1.7% | 7.0% | 0.4% | 0.5% | 0.4% | 0.1% | |||
Aboriginal population
| Aboriginal population in Canada, 1996–2016 censuses | ||||||||||
|---|---|---|---|---|---|---|---|---|---|---|
| Group | 1996[28] | 2001[30] | 2006[31] | 2011[32] | 2016[49] | |||||
| % | Total | % | Total | % | Total | % | Total | % | Total | |
| Total Aboriginal | 2.8% | 799,005 | 3.3% | 976,305 | 3.8% | 1,172,785 | 4.3% | 1,400,685 | 4.9% | 1,673,780 |
| First Nations | 1.8% | 529,040 | 2.1% | 608,850 | 2.2% | 698,025 | 2.6% | 851,560 | 2.8% | 977,230 |
| Métis | 0.7% | 204,115 | 1.0% | 292,305 | 1.2% | 389,780 | 1.4% | 451,795 | 1.7% | 587,545 |
| Inuit | 0.14% | 40,220 | 0.16% | 50,485 | 0.2% | 59,445 | 0.2% | 65,025 | ||
Note: Inuit, other Aboriginal and mixed Aboriginal groups are not listed as their own, but they are all accounted for in total Aboriginal
By province and territory
| Aboriginal population by province and territory, 2011[34] | |||||||||||||||||||||
|---|---|---|---|---|---|---|---|---|---|---|---|---|---|---|---|---|---|---|---|---|---|
| Province/territory | Not Aboriginal | First Nations | Métis | Inuit | Aboriginal, n.i.e. | Multiple Aboriginal identities | Total Aboriginal population | Total population | |||||||||||||
| Alberta[35] | 2,690,960 | 116,670 | 96,870 | 1,985 | 3,300 | 1,870 | 220,695 | 3,567,980 | |||||||||||||
| British Columbia[36] | 2,911,295 | 155,020 | 69,475 | 1,570 | 3,745 | 2,480 | 232,290 | 4,324,455 | |||||||||||||
| Manitoba[37] | 824,830 | 114,225 | 78,830 | 580 | 1,055 | 1,200 | 195,895 | 1,174,350 | |||||||||||||
| New Brunswick[38] | 696,080 | 16,120 | 4,850 | 485 | 1,020 | 150 | 22,620 | 735,835 | |||||||||||||
| Newfoundland and Labrador[39] | 464,540 | 19,315 | 7,660 | 6,265 | 2,300 | 260 | 35,800 | 507,270 | |||||||||||||
| Northwest Territories[40] | 16,920 | 13,350 | 3,250 | 4,335 | 185 | 45 | 21,160 | 40,800 | |||||||||||||
| Nova Scotia[41] | 825,055 | 21,895 | 10,050 | 695 | 980 | 225 | 33,850 | 906,175 | |||||||||||||
| Nunavut[42] | 3,825 | 125 | 130 | 27,070 | 15 | 20 | 27,365 | 31,700 | |||||||||||||
| Ontario[43] | 9,070,800 | 201,100 | 86,020 | 3,355 | 8,040 | 2,910 | 301,430 | 12,651,795 | |||||||||||||
| Prince Edward Island[44] | 130,890 | 1,520 | 410 | 55 | 235 | 0 | 2,230 | 137,380 | |||||||||||||
| Quebec[45] | 6,740,375 | 82,425 | 40,960 | 12,570 | 4,415 | 1,545 | 141,915 | 7,732,525 | |||||||||||||
| Saskatchewan[46] | 787,745 | 103,205 | 52,450 | 290 | 1,120 | 675 | 157,740 | 1,008,760 | |||||||||||||
| Yukon[47] | 23,590 | 6,585 | 845 | 175 | 70 | 25 | 7,705 | 33,320 | |||||||||||||
| Canada[48] | 25,186,890 | 851,560 | 451,795 | 59,440 | 26,475 | 11,415 | 1,400,685 | 32,852,325 | |||||||||||||
All statistics are from the Canada 2011 Census.
By city over 100,000
| Aboriginal population in Canadian cities over 100,000 people, 2011[34] | ||||||||||||||
|---|---|---|---|---|---|---|---|---|---|---|---|---|---|---|
| City | Population | European | Total Aboriginal | First Nations | Métis | |||||||||
| Toronto | 2,576,025 | 50.2% | 0.7% | 0.5% | 0.2% | |||||||||
| Montreal | 1,612,640 | 67.7% | 0.6% | 0.3% | 0.2% | |||||||||
| Calgary | 1,082,235 | 67.3% | 2.7% | 1.2% | 1.4% | |||||||||
| Ottawa | 867,090 | 74.2% | 2.1% | 1.2% | 0.7% | |||||||||
| Edmonton | 795,675 | 64.7% | 5.3% | 2.4% | 2.7% | |||||||||
| Mississauga | 708,725 | 45.8% | 0.5% | 0.3% | 0.1% | |||||||||
| Winnipeg | 649,995 | 66.9% | 11.7% | 5.9% | 6.3% | |||||||||
| Vancouver | 590,210 | 46.2% | 2.0% | 1.3% | 0.6% | |||||||||
| Brampton | 521,315 | 32.9% | 0.7% | 0.4% | 0.2% | |||||||||
| Hamilton | 509,640 | 82.3% | 2.0% | 1.6% | 0.3% | |||||||||
| Quebec City | 502,595 | 95.0% | 0.9% | 0.5% | 0.4% | |||||||||
| Surrey | 463,340 | 44.5% | 2.9% | 1.9% | 1.0% | |||||||||
| Laval | 392,725 | 78.7% | 0.6% | 0.3% | 0.2% | |||||||||
| Halifax | 384,330 | 88.4% | 2.5% | 1.5% | 0.8% | |||||||||
| London | 360,715 | 82.0% | 1.9% | 1.4% | 0.4% | |||||||||
| Markham | 300,135 | 27.5% | 0.2% | 0.1% | 0.1% | |||||||||
| Vaughan | 286,305 | 68.4% | 0.2% | 0.1% | 0.0% | |||||||||
| Gatineau | 261,665 | 86.2% | 3.5% | 1.8% | 1.5% | |||||||||
| Longueuil | 227,970 | 84.8% | 1.0% | 0.6% | 0.0% | |||||||||
| Burnaby | 220,255 | 39.1% | 1.5% | 0.9% | 0.5% | |||||||||
| Saskatoon | 218,315 | 77.4% | 10.2% | 4.9% | 4.6% | |||||||||
| Kitchener | 215,950 | 80.1% | 1.5% | 0.9% | 0.5% | |||||||||
| Windsor | 208,015 | 74.8% | 2.3% | 1.3% | 0.9% | |||||||||
| Regina | 189,740 | 78.6% | 9.9% | 5.8% | 3.9% | |||||||||
| Richmond | 189,305 | 28.6% | 1.0% | 0.7% | 0.3% | |||||||||
| Richmond Hill | 184,370 | 46.9% | 0.2% | 0.1% | 0.0% | |||||||||
| Oakville | 180,430 | 77.2% | 0.6% | 0.4% | 0.2% | |||||||||
| Burlington | 173,495 | 87.1% | 0.9% | 0.5% | 0.3% | |||||||||
| Greater Sudbury | 157,765 | 89.1% | 8.2% | 3.8% | 4.1% | |||||||||
| Sherbrooke | 150,255 | 93.6% | 0.9% | 0.5% | 0.3% | |||||||||
| Oshawa | 147,680 | 88.7% | 2.0% | 1.2% | 0.8% | |||||||||
| Saguenay | 141,335 | 96.6% | 2.5% | 0.8% | 1.6% | |||||||||
| Lévis | 135,835 | 98.0% | 0.5% | 0.2% | 0.2% | |||||||||
| Barrie | 133,240 | 89.8% | 2.6% | 1.4% | 1.2% | |||||||||
| Abbotsford | 130,950 | 66.5% | 4.0% | 2.5% | 1.6% | |||||||||
| St. Catharines | 128,770 | 88.3% | 1.9% | 1.2% | 0.6% | |||||||||
| Trois-Rivières | 126,980 | 96.3% | 1.1% | 0.6% | 0.4% | |||||||||
| Cambridge | 125,060 | 85.4% | 2.0% | 1.2% | 0.6% | |||||||||
| Coquitlam | 125,015 | 54.1% | 2.1% | 1.1% | 0.9% | |||||||||
| Kingston | 118,930 | 89.7% | 2.9% | 2.0% | 0.8% | |||||||||
| Whitby | 120,285 | 79.5% | 1.2% | 0.7% | 0.4% | |||||||||
| Guelph | 120,550 | 82.7% | 1.6% | 1.0% | 0.6% | |||||||||
| Kelowna | 114,570 | 87.9% | 4.5% | 2.1% | 2.3% | |||||||||
| Saanich | 107,855 | 79.3% | 2.7% | 1.5% | 1.1% | |||||||||
| Ajax | 109,220 | 53.2% | 1.0% | 0.7% | 0.3% | |||||||||
| Thunder Bay | 105,950 | 87.1% | 9.5% | 7.3% | 2.0% | |||||||||
| Terrebonne | 105,610 | 91.7% | 0.7% | 0.5% | 0.1% | |||||||||
| St. John's | 103,905 | 93.3% | 2.6% | 1.2% | 0.8% | |||||||||
| Langley | 103,145 | 83.2% | 3.4% | 1.6% | 1.7% | |||||||||
| Chatham-Kent | 101,680 | 93.2% | 2.9% | 1.7% | 0.9% | |||||||||
Languages
Language used most often at work:[50]
Languages by language used most often at home:[51]
Languages by mother tongue:
| First language | Population (2016) | % of total population (2016) | Population (2011) | % of total population (2011) | Population (2006) | % of total population (2006) | Notes |
|---|---|---|---|---|---|---|---|
| Single language responses | 33,947,610 | 97.64% | 32,481,635 | 98.07% | 30,848,270 | 98.74% | |
| Official languages | 26,627,545 | 76.59% | 25,913,955 | 78.24% | 24,700,425 | 79.06% | |
| English | 19,460,855 | 55.97% | 18,858,980 | 56.94% | 17,882,775 | 57.24% | |
| French | 7,166,700 | 20.61% | 7,054,975 | 21.3% | 6,817,650 | 21.82% | |
| Non-official languages | 7,321,070 | 21.06% | 6,567,680 | 19.83% | 6,147,840 | 19.68% | |
| Combined Chinese Responses | 1,227,680 | 3.53% | n/a | n/a | n/a | n/a | Combined responses of Mandarin, Cantonese, Chinese n.o.s. and Min Nan |
| Mandarin (Standard Chinese) | 592,035 | 1.7% | 248,705 | 0.75% | 170,950 | 0.55% | |
| Cantonese | 565,275 | 1.63% | 372,460 | 1.12% | 361,450 | 1.16% | |
| Punjabi | 501,680 | 1.44% | 430,705 | 1.3% | 367,505 | 1.18% | |
| Spanish | 458,850 | 1.32% | 410,670 | 1.24% | 345,345 | 1.11% | |
| Tagalog (Filipino) | 431,385 | 1.24% | 327,445 | 0.99% | 235,615 | 0.75% | |
| Arabic | 419,895 | 1.21% | 327,870 | 0.99% | 261,640 | 0.84% | |
| German | 384,040 | 1.1% | 409,200 | 1.24% | 450,570 | 1.44% | |
| Italian | 375,645 | 1.08% | 407,485 | 1.23% | 455,040 | 1.46% | |
| Portuguese | 221,535 | 0.64% | 211,335 | 0.64% | 219,275 | 0.7% | |
| Persian (Farsi) | 214,200 | 0.62% | 170,045 | 0.51% | 134,080 | 0.43% | |
| Urdu | 210,820 | 0.61% | 172,800 | 0.52% | 145,805 | 0.47% | |
| Russian | 188,255 | 0.54% | 164,330 | 0.5% | 133,580 | 0.43% | |
| Polish | 181,705 | 0.52% | 191,645 | 0.58% | 211,175 | 0.68% | |
| Vietnamese | 156,430 | 0.45% | 144,880 | 0.44% | 141,625 | 0.45% | |
| Korean | 153,425 | 0.44% | 137,925 | 0.42% | 125,570 | 0.4% | |
| Tamil | 140,720 | 0.4% | 131,265 | 0.4% | 115,880 | 0.37% | Most of the Canadian Tamils live in Toronto. |
| Ukrainian | 102,485 | 0.29% | 111,540 | 0.34% | 134,500 | 0.43% | |
| Dutch | 99,015 | 0.28% | 110,490 | 0.33% | 128,900 | 0.41% | |
| Greek | 106,520 | 0.31% | 108,925 | 0.33% | 117,285 | 0.38% | |
| Gujarati | 108,775 | 0.31% | 91,450 | 0.28% | 81,465 | 0.26% | |
| Hindi | 110,645 | 0.32% | 90,545 | 0.27% | 78,240 | 0.25% | |
| Romanian | 96,660 | 0.28% | 90,300 | 0.27% | 78,495 | 0.25% | |
| Cree, n.o.s.[nb 1] | 64,045 | 0.18% | 77,900 | 0.24% | 78,855 | 0.25% | In the 2006 Census, this language was referred to simply as 'Cree'. |
| Hungarian | 61,235 | 0.18% | 67,920 | 0.21% | 73,335 | 0.23% | The majority of Hungarian speakers in Canada live in Ontario. A community of Hungarian speakers is found within a part of Windsor, Ontario. |
| Creoles | 72,130 | 0.21% | 61,725 | 0.19% | 53,515 | 0.17% | |
| Bengali | 73,125 | 0.21% | 59,370 | 0.18% | 45,685 | 0.15% | |
| Berber languages (Kabyle) | n/a | n/a | 57,855 | 0.17% | 25,578 | 0.08% | |
| Serbian | 57,345 | 0.16% | 56,420 | 0.17% | 51,665 | 0.17% | |
| Croatian | 48,200 | 0.14% | 49,730 | 0.15% | 55,330 | 0.18% | |
| Japanese | 43,640 | 0.13% | 39,985 | 0.12% | 40,200 | 0.13% | |
| Chinese, n.o.s.[nb 1] | 38,575 | 0.11% | 425,210 | 1.28% | 456,705 | 1.46% | |
| Inuktitut | 35,215 | 0.1% | 33,500 | 0.1% | 32,015 | 0.1% | In the 2006 Census, this language was referred to as 'Inuktitut, n.i.e.'.[nb 2] |
| Somali | 36,760 | 0.11% | 31,380 | 0.09% | 27,320 | 0.09% | |
| Armenian | 33,455 | 0.1% | 29,795 | 0.09% | 30,130 | 0.1% | |
| Turkish | 32,815 | 0.09% | 29,640 | 0.09% | 24,745 | 0.08% | |
| Albanian | 26,895 | 0.08% | 23,820 | 0.07% | n/a | n/a | |
| Czech | 22,295 | 0.06% | 23,585 | 0.07% | 24,450 | 0.08% | |
| Khmer (Cambodian) | 20,130 | 0.06% | 19,440 | 0.06% | 19,105 | 0.06% | |
| Bulgarian | 20,020 | 0.06% | 19,050 | 0.06% | 16,790 | 0.05% | |
| Hebrew | 19,530 | 0.06% | 18,450 | 0.06% | 17,635 | 0.06% | |
| Amharic | 22,465 | 0.06% | 18,020 | 0.05% | 14,555 | 0.05% | |
| Ilocano | 26,345 | 0.08% | 17,915 | 0.05% | 13,450 | 0.04% | |
| Ojibway | 17,885 | 0.05% | 17,625 | 0.05% | 24,190 | 0.08% | |
| Slovak | 17,585 | 0.05% | 17,580 | 0.05% | 18,820 | 0.06% | |
| Finnish | 15,295 | 0.04% | 17,415 | 0.05% | 21,030 | 0.07% | |
| Macedonian | 16,770 | 0.05% | 17,245 | 0.05% | 18,435 | 0.06% | |
| Semitic languages, n.i.e.[nb 2] | 2,155 | 0.01% | 16,970 | 0.05% | n/a | n/a | |
| Bisayan languages | n/a | n/a | 16,240 | 0.05% | 11,240 | 0.04% | |
| Malayalam | 28,570 | 0.08% | 16,080 | 0.05% | 11,925 | 0.04% | |
| Yiddish | 13,555 | 0.04% | 15,205 | 0.05% | 16,295 | 0.05% | |
| Sinhala (Sinhalese) | 16,335 | 0.05% | 14,185 | 0.04% | 10,180 | 0.03% | |
| Danish | 12,630 | 0.04% | 14,145 | 0.04% | 18,735 | 0.06% | |
| Niger–Congo languages, n.i.e.[nb 1] | 19,140 | 0.06% | 14,075 | 0.04% | n/a | n/a | |
| Lao | 12,670 | 0.04% | 12,970 | 0.04% | 13,940 | 0.04% | |
| Akan (Twi) | 13,460 | 0.04% | 12,680 | 0.04% | 12,780 | 0.04% | |
| Pashto | 16,910 | 0.05% | 12,465 | 0.04% | 9,025 | 0.03% | |
| Bosnian | 12,210 | 0.04% | 11,685 | 0.04% | 12,790 | 0.04% | |
| Sindhi | 11,860 | 0.03% | 11,330 | 0.03% | 10,355 | 0.03% | |
| Dene | 10,700 | 0.03% | 11,215 | 0.03% | 9,745 | 0.03% | |
| Oromo | 4,960 | 0.01% | 11,140 | 0.03% | n/a | n/a | |
| Malay | 12,275 | 0.04% | 10,910 | 0.03% | 9,490 | 0.03% | |
| Montagnais (Innu) | 10,230 | 0.03% | 10,785 | 0.03% | 10,975 | 0.04% | In the 2006 Census, this language was referred to as 'Montagnais-Naskapi'. |
| Slovenian | 9,785 | 0.03% | 10,775 | 0.03% | 13,135 | 0.04% | |
| Tigrigna | 16,650 | 0.05% | 10,220 | 0.03% | 7,105 | 0.02% | |
| Serbo-Croatian | 9,555 | 0.03% | 10,155 | 0.03% | 12,510 | 0.04% | |
| Swahili | 13,375 | 0.04% | 10,090 | 0.03% | 7,935 | 0.03% | |
| Oji-Cree | 12,855 | 0.04% | 9,835 | 0.03% | 11,690 | 0.04% | |
| Kurdish | 11,705 | 0.03% | 9,805 | 0.03% | 7,660 | 0.02% | |
| Taiwanese | n/a | n/a | 9,635 | 0.03% | 9,620 | 0.03% | |
| Min Nan (Chaochow, Teochow, Fukien, Taiwanese) | 31,795 | 0.09% | n/a | n/a | n/a | n/a | |
| Telugu | 15,655 | 0.05% | 9,315 | 0.03% | 6,625 | 0.02% | |
| African languages, n.i.e.[nb 2] | n/a | n/a | 9,125 | 0.03% | n/a | n/a | |
| Afrikaans | 10,260 | 0.03% | 8,770 | 0.03% | n/a | n/a | |
| Nepali | 18,275 | 0.05% | 8,480 | 0.03% | n/a | n/a | |
| Thai | 9,255 | 0.03% | 7,935 | 0.02% | n/a | n/a | |
| Mi'kmaq | 6,690 | 0.02% | 7,635 | 0.02% | 7,365 | 0.02% | |
| Swedish | 6,840 | 0.02% | 7,350 | 0.02% | 8,220 | 0.03% | |
| Lithuanian | 7,075 | 0.02% | 7,245 | 0.02% | 8,335 | 0.03% | |
| Bantu languages, n.i.e.[nb 2] | n/a | n/a | 7,150 | 0.02% | n/a | n/a | |
| Estonian | 5,445 | 0.02% | 6,385 | 0.02% | 8,240 | 0.03% | |
| Maltese | 5,565 | 0.02% | 6,220 | 0.02% | 6,405 | 0.02% | |
| Latvian | 5,455 | 0.02% | 6,200 | 0.02% | 7,000 | 0.02% | |
| Canadian Gaelic | n/a | n/a | 6,015 | 0.02% | 6,015 | 0.02% | |
| Scottish Gaelic | 1,095 | <0.01% | n/a | n/a | n/a | n/a | |
| Welsh | 1,075 | <0.01% | n/a | n/a | n/a | n/a | |
| Celtic languages, n.i.e.[nb 2] | 530 | <0.01% | n/a | n/a | n/a | n/a | |
| Fukien (Fuzhou dialect) | n/a | n/a | 5,925 | 0.02% | n/a | n/a | |
| Marathi | 8,295 | 0.02% | 5,830 | 0.02% | n/a | n/a | |
| Atikamekw | 6,150 | 0.02% | 5,820 | 0.02% | 5,250 | 0.02% | |
| Norwegian | 4,615 | 0.01% | 5,800 | 0.02% | 7,225 | 0.02% | |
| Indo-Iranian languages, n.i.e.[nb 2] | 5,180 | 0.01% | 5,255 | 0.02% | n/a | n/a | |
| Hakka | 10,910 | 0.03% | 5,115 | 0.02% | n/a | n/a | |
| Vlaams (Flemish) | 3,895 | 0.01% | 4,690 | 0.01% | 5,660 | 0.02% | |
| Tibetan languages | n/a | n/a | 4,640 | 0.01% | n/a | n/a | |
| Tibetan | 6,165 | 0.02% | n/a | n/a | n/a | n/a | |
| Sino-Tibetan languages, n.i.e.[nb 2] | n/a | n/a | 4,360 | 0.01% | n/a | n/a | |
| Tibeto-Burman languages, n.i.e.[nb 2] | 1,405 | <0.01% | n/a | n/a | n/a | n/a | |
| Rundi (Kirundi) | 5,845 | 0.02% | 3,975 | 0.01% | n/a | n/a | |
| Kinyarwanda (Rwanda) | 5,250 | 0.02% | 3,895 | 0.01% | n/a | n/a | |
| Sign languages, n.i.e.[nb 2] | 4,125 | 0.01% | 3,815 | 0.01% | n/a | n/a | |
| Slavic languages, n.i.e.[nb 2] | 2,420 | 0.01% | 3,630 | 0.01% | n/a | n/a | |
| Lingala | 3,810 | 0.01% | 3,085 | 0.01% | n/a | n/a | |
| Stoney | 3,025 | 0.01% | 3,050 | 0.01% | n/a | n/a | |
| Burmese | 3,585 | 0.01% | 2,985 | 0.01% | n/a | n/a | |
| Shanghainese | n/a | n/a | 2,920 | 0.01% | n/a | n/a | |
| Wu (Shanghainese) | 12,920 | 0.04% | n/a | n/a | n/a | n/a | |
| Siouan languages (Dakota/Sioux) | 1,265 | <0.01% | n/a | n/a | 5,585 | 0.02% | |
| Blackfoot | 2,815 | <0.01% | n/a | n/a | 3,085 | 0.01% | |
| Frisian | 2,095 | <0.01% | n/a | n/a | 2,890 | 0.01% | |
| Dogrib (Tlicho) | 1,645 | <0.01% | n/a | n/a | 2,020 | 0.01% | |
| Algonquin | 1,260 | <0.01% | n/a | n/a | 1,920 | 0.01% | |
| South Slavey | 950 | <0.01% | n/a | n/a | 1,605 | 0.01% | |
| Carrier | 1,030 | <0.01% | n/a | n/a | 1,560 | <0.01% | |
| Gitxsan (Gitksan) | 880 | <0.01% | n/a | n/a | 1,180 | <0.01% | |
| Chilcotin | 655 | <0.01% | n/a | n/a | 1,070 | <0.01% | |
| North Slave (Hare) | 765 | <0.01% | n/a | n/a | 1,065 | <0.01% | |
| Shuswap (Secwepemctsin) | 445 | <0.01% | n/a | n/a | 935 | <0.01% | |
| Nisga'a | 400 | <0.01% | n/a | n/a | 680 | <0.01% | |
| Malecite | 300 | <0.01% | n/a | n/a | 535 | <0.01% | |
| Chipewyan | n/a | n/a | n/a | n/a | 525 | <0.01% | |
| Inuinnaqtun (Inuvialuktun) | 1,020 | <0.01% | n/a | n/a | 365 | <0.01% | |
| Kutchin-Gwich’in (Loucheux) | 260 | <0.01% | n/a | n/a | 360 | <0.01% | |
| Mohawk | 985 | <0.01% | n/a | n/a | 290 | <0.01% | |
| Michif | 465 | <0.01% | n/a | n/a | n/a | n/a | |
| Tlingit | 95 | <0.01% | n/a | n/a | 80 | <0.01% | |
| Other languages | n/a | n/a | 77,890 | 0.2% | 172,650 | 0.55% | |
| Multiple language responses | 818,640 | 2.35% | 639,540 | 1.9% | 392,760 | 1.26% | |
| English and French | 165,335 | 0.48% | 144,685 | 0.4% | 98,630 | 0.32% | |
| English and a non-official language | 533,260 | 1.53% | 396,330 | 1.2% | 240,005 | 0.77% | |
| French and a non-official language | 86,145 | 0.25% | 74,430 | 0.2% | 43,335 | 0.14% | |
| English, French, and a non-official language | 33,900 | 0.1% | 24,095 | 0.07% | 10,790 | 0.03% | |
| Total[52][53][54] | 34,767,250 | 100% | 33,121,175 | 100% | 31,241,030 | 100% |
Religion
Statistics Canada (StatCan) grouped responses to the 2011 National Household Survey (NHS) question on religion into nine core religious categories – Buddhist, Christian, Hindu, Jewish, Muslim, Sikh, Traditional (Aboriginal) Spirituality, other religions and no religious affiliation.[55] Among these, 67% of Canadians were self-identified as Christians in 2011.[56] The second, third, and fourth-largest categories were of Canadians with no religious affiliation at 24%, Canadian Muslims at 3%, and Canadian Hindus at 2%.[56]
Within the 2011 NHS results, StatCan further subcategorized Christianity in nine groups of its own – Anglican, Baptist, Catholic, Christian Orthodox, Lutheran, Pentecostal, Presbyterian, United Church and Other Christian.[55] Among these, 39% of Canadians were self-identified as Catholic in 2011.[56] The second and third-largest ungrouped subcategories of Christian Canadians were United at 6% and Anglican at 5%, while 9% of Christians were grouped into the Other Christian subcategory comprising numerous denominations.[56]
Of the 3,036,785 or 5% of Canadians identified as Other Christians:[56]
- 105,365 (0.3% of Canadians) were identified as Church of Jesus Christ of Latter-day Saints (Mormon);
- 137,775 (0.4% of Canadians) were identified as Jehovah's Witness;
- 175,880 (0.5% of Canadians) were identified as Mennonite;
- 550,965 (1.7% of Canadians) were identified as Protestant; and
- 102,830 (0.3% of Canadians) were identified as Reformed.
| Religion status of the Canadian Population in 2011[56] | ||
|---|---|---|
| Religion | Total | Percent |
| Buddhist | 366,830 | 1% |
| Christian | 22,102,745 | 67% |
| Anglican | 1,631,845 | 5% |
| Baptist | 635,840 | 2% |
| Roman Catholic | 12,810,705 | 39% |
| Christian Orthodox | 550,690 | 2% |
| Lutheran | 478,185 | 1% |
| Pentecostal | 478,705 | 1% |
| Presbyterian | 472,385 | 1% |
| United Church | 2,007,610 | 6% |
| Other Christian | 3,036,785 | 9% |
| Hindu | 497,960 | 1.5% |
| Jewish | 329,500 | 1% |
| Muslim | 1,053,945 | 3% |
| Sikh | 454,965 | 1% |
| Traditional (Aboriginal) Spirituality | 64,940 | 0% |
| Other religions | 130,835 | 0% |
| No religious affiliation | 7,850,605 | 24% |
See also
- 1666 census of New France
- Canada 1906 Census
- Canada 1911 Census
- Canada 1996 Census
- Canada 2001 Census
- Canada 2006 Census
- Canada 2011 Census
- Canada 2016 Census
- List of Canadian census areas demographic extremes
- Cahiers québécois de démographie academic journal
- Canadian Studies in Population academic journal

Notes
- ↑ In fertility rates, 2.1 and above is a stable population and have been marked blue, 2 and below leads an aging population and the result is that the population reduces.
- ↑ All citizens of Canada are classified as "Canadians" as defined by Canada's nationality laws. However, "Canadian" as an ethnic group has since 1996 been added to census questionnaires for possible ancestry. "Canadian" was included as an example on the English
questionnaire and "Canadien" as an example on the French questionnaire. "The majority of respondents to this selection are from the eastern part of the country that was first settled. Respondents generally are visibly European (Anglophones and Francophones), however no-longer self identify with their ethnic ancestral origins. This response is attributed to a multitude or generational distance from ancestral lineage.
Source 1: Jack Jedwab (April 2008). "Our 'Cense' of Self: the 2006 Census saw 1.6 million 'Canadian'" (PDF). Association for Canadian Studies. Retrieved March 7, 2011.
Source 2: Don Kerr (2007). The Changing Face of Canada: Essential Readings in Population. Canadian Scholars' Press. pp. 313–317. ISBN 978-1-55130-322-2. - ↑ The category "North American Indian" includes respondents who indicated that their ethnic origins were from a Canadian First Nation, or another non-Canadian North American aboriginal group (excluding Inuit and Métis).
Source: "How Statistics Canada Identifies Aboriginal Peoples". Statistics Canada. Retrieved January 16, 2011.
References
- ↑ "Estimated population of Canada, 1605 to present". Statistics Canada. March 20, 2013. Retrieved February 8, 2014.
- ↑ "CANSIM Table 051-0005, Estimates of population, Canada, provinces and territories, quarterly (persons)". Statistics Canada. December 18, 2013. Retrieved February 8, 2014.
- ↑ "2011 Census Profile". Statistics Canada. Archived from the original on 2012-02-26. Retrieved 2012-03-08.
- ↑ "Environment — Greenhouse Gases (Greenhouse Gas Emissions per Person)". Human Resources and Skills Development Canada. 2010. Retrieved 23 June 2010.
- ↑ Statistics Canada (2011). "Population data 2011 Census". Retrieved 2012-05-16.
- ↑ Statistics Canada (2005). "Land and freshwater area, by province and territory (2005)". Archived from the original on 2007-07-08. Retrieved 2007-07-22.
- ↑ "Census Profile". 2.statcan.gc.ca. Retrieved 2016-02-08.
- ↑ CO2 Emissions from Fuel Combustion Population 1971–2008 (pdf pages 83–85) IEA (OECD/ World Bank) original population ref e.g. in IEA Key World Energy Statistics 2010 page 57 "Archived copy". Archived from the original on September 25, 2015. Retrieved 2011-06-18.
- ↑ "Fertility: Fewer children, older moms", Statistics Canada, July 17, 2018
- 1 2 Jacques Henripin (1972), Trends and Factors of Fertility in Canada (PDF), Ottawa: Statistics Canada, p. 30, 33
- 1 2 3 "Life expectancy". Our World in Data. Retrieved 2018-08-28.
- ↑ "World Population Prospects – Population Division – United Nations". Retrieved 2017-07-15.
- ↑ B.R. Mitchell. International historical statistics: the Americas, 1750-2000.
- ↑ United nations. Demographic Yearbooks
- ↑ Statistics Canada
- 1 2 "The World FactBook - Canada", The World Factbook, July 12, 2018
- ↑ "Estimates of births, deaths and marriages, Canada, provinces and territories quarterly (number)". Statistics Canada. Retrieved 8 July 2018.
- ↑ "Population Projections for Canada - Components of population growth, high-growth scenario - 2009/2010 to 2060/2061" (PDF). Statistics Canada. Catalogue no. 91-520. 2006. Retrieved September 8, 2013.
- ↑ "International Programs – U.S. Census Bureau". Census.gov. Retrieved 2012-01-22.
- ↑ "Census Profile: Canada (Country)". Statistics Canada. February 9, 2015. Retrieved August 30, 2015.
- 1 2 3 4 5 "Canada Population 2018", World Population Review
- ↑ Statistics Canada (2011). "Population by broad age groups and sex, including median age, 1921 to 2011 for both sex (2011 Census)". Retrieved 2012-05-29.
- ↑ World Health Organization
- ↑ https://www150.statcan.gc.ca/n1/pub/91-551-x/91-551-x2017001-eng.htm
- ↑ https://www150.statcan.gc.ca/n1/pub/91-551-x/2017001/tbl/tbl_05-eng.htm
- ↑ "Immigration and Ethnocultural Diversity Highlight Tables". statcan.gc.ca.
- ↑ Ethnocultural Portrait of Canada – Select a geography
- 1 2 Statistics Canada, Population by Aboriginal Groups and Sex, Showing Age Groups, for Canada, 1996 Census (20% Sample Data)
- ↑ Statistics Canada, Total Population by Visible Minority Population, for Canada, 1996 Census (20% Sample Data)
- 1 2 Statistics Canada, Community Highlights for Canada
- 1 2 Statistics Canada, 2006 Community Profiles: Canada (Country)
- 1 2 Statistics Canada, NHS Profile, Canada, 2011
- ↑ "Census Profile, 2016 Census". Statistics Canada. February 8, 2017. Retrieved February 16, 2018.
- 1 2 3 4 Canada, Government of Canada, Statistics. "Census Program". www12.statcan.gc.ca. Retrieved 2018-04-12.
- 1 2 Statistics Canada, National Household Survey (NHS) Profile, 2011
- 1 2 Statistics Canada, National Household Survey (NHS) Profile, 2011
- 1 2 Statistics Canada, National Household Survey (NHS) Profile, 2011
- 1 2 Statistics Canada, National Household Survey (NHS) Profile, 2011
- 1 2 Statistics Canada, National Household Survey (NHS) Profile, 2011
- 1 2 Statistics Canada, National Household Survey (NHS) Profile, 2011
- 1 2 Statistics Canada, National Household Survey (NHS) Profile, 2011
- 1 2 Statistics Canada, National Household Survey (NHS) Profile, 2011
- 1 2 Statistics Canada, National Household Survey (NHS) Profile, 2011
- 1 2 Statistics Canada, National Household Survey (NHS) Profile, 2011
- 1 2 Statistics Canada, National Household Survey (NHS) Profile, 2011
- 1 2 Statistics Canada, National Household Survey (NHS) Profile, 2011
- 1 2 Statistics Canada, National Household Survey (NHS) Profile, 2011
- 1 2 Statistics Canada, National Household Survey (NHS) Profile, 2011
- ↑ Data tables, 2016 Census Aboriginal Identity
- ↑ Statistics Canada – Language used at work1 by frequency of language used at work and mother tongue, 2006 counts
- ↑ The percentage figures cited are the top languages spoken as a home language in Canada, shown as a percentage of total single responses. Source: Statistics Canada, 2006 Census Profile of Federal Electoral Districts (2003 Representation Order): Language, Mobility and Migration and Immigration and Citizenship. Ottawa, 2007, pp. 6–10. Data available online at: "Detailed Language Spoken Most Often at Home". 2006 Census of Canada: Topic-based tabulations. Statistics Canada. April 8, 2008. Retrieved January 15, 2010.
- ↑ "Census Profile, 2016 Census - Canada". Statistics Canada. August 2, 2017.
- ↑ Census Profile – Province/Territory, Note 20
- ↑ Topic-based tabulations|Detailed Mother Tongue (103), Knowledge of Official Languages, 2006 Census of Canada Archived July 1, 2013, at the Wayback Machine.
- 1 2 "NHS Profile, Canada, 2011". Statistics Canada. November 27, 2015. Retrieved November 15, 2016.
- 1 2 3 4 5 6 "Tabulation: Religion (108), Immigrant Status and Period of Immigration (11), Age Groups (10) and Sex (3) for the Population in Private Households of Canada, Provinces, Territories, Census Metropolitan Areas and Census Agglomerations, 2011 National Household Survey". Statistics Canada. January 7, 2016. Retrieved November 15, 2016.
Further reading
- Bumsted, J. M (2003). Canada's diverse peoples: a reference sourcebook. Library of Congress ( ABC-CLIO). ISBN 978-1-57607-672-9.
- Magocsi, Paul R (1999). Encyclopedia of Canada's peoples. Society of Ontario, University of Toronto Press. ISBN 978-0-8020-2938-6.
- Richard, Madeline (1992). Ethnic history and marital assimilation in Canada, 1871 and 1971. University of British Columbia Press. ISBN 978-0-7748-0431-8.
- Thornton, Russell (2000). Michael R. Haines, Richard Hall Steckel, ed. A population history of North America. Cambridge: Cambridge University Press. ISBN 0-521-49666-7.
- Wilson, Donna M; Northcott, Herbert C (2008). Dying and Death in Canada. Toronto: University of Toronto Press. ISBN 978-1-55111-873-4.
- Roderic Beaujot and Don Kerr, (2007) The Changing Face of Canada: Essential Readings in Population, Canadian Scholars' Press, ISBN 978-1-55130-322-2.
External links
| Wikimedia Commons has media related to Demographics of Canada. |
- Canada Year Book (2010) – Statistics Canada
- Population estimates and projections, 2010 – 2036 – Statistics Canada