Demographics of Panama
This article is about the demographic features of the population of Panama, including population density, ethnicity, education level, health of the populace, economic status, religious affiliations and other aspects of the population.
Population
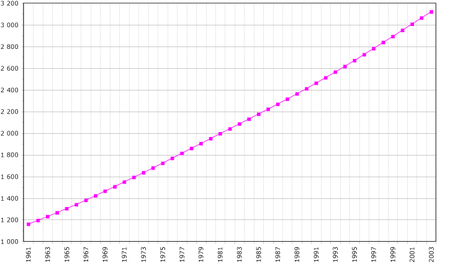
Panama's population was 4,034,119 people in 2016, compared to 860,000 in 1950.[1] The proportion of the population aged below 15 in 2010 was 29%. 64.5% of the population were aged between 15 and 65, with 6.6% of the population being 65 years or older.[2]
| Total population (x 1000) |
Proportion aged 0–14 (%) |
Proportion aged 15–64 (%) |
Proportion aged 65+ (%) | |
|---|---|---|---|---|
| 1950 | 860 | 40.2 | 55.7 | 4.1 |
| 1955 | 983 | 41.8 | 54.1 | 4.1 |
| 1960 | 1 136 | 42.9 | 52.8 | 4.3 |
| 1965 | 1 319 | 43.8 | 51.8 | 4.4 |
| 1970 | 1 526 | 43.9 | 51.8 | 4.3 |
| 1975 | 1 754 | 42.8 | 52.8 | 4.4 |
| 1980 | 1 990 | 40.4 | 55.0 | 4.6 |
| 1985 | 2 233 | 37.6 | 57.6 | 4.7 |
| 1990 | 2 487 | 35.2 | 59.9 | 5.0 |
| 1995 | 2 757 | 33.3 | 61.5 | 5.2 |
| 2000 | 3 055 | 31.8 | 62.6 | 5.5 |
| 2005 | 3 366 | 30.4 | 63.7 | 5.9 |
| 2010 | 3 678 | 29.0 | 64.5 | 6.6 |
| 2015 | 4 080 | 28.1 | 64.6 | 7.3 |
Structure of the population [3]
Structure of the population (01.07.2013) (Estimates - Data refer to projections based on the 2010 Population Census):
| Age Group | Male | Female | Total | % |
|---|---|---|---|---|
| Total | 1 934 264 | 1 916 471 | 3 850 735 | 100 |
| 0-4 | 187 797 | 179 822 | 367 619 | 9,55 |
| 5-9 | 184 487 | 176 909 | 361 396 | 9,39 |
| 10-14 | 180 579 | 173 379 | 353 958 | 9,19 |
| 15-19 | 170 895 | 164 639 | 335 534 | 8,71 |
| 20-24 | 160 414 | 155 878 | 316 292 | 8,21 |
| 25-29 | 154 493 | 150 986 | 305 479 | 7,93 |
| 30-34 | 147 618 | 144 488 | 292 106 | 7,59 |
| 35-39 | 140 942 | 138 936 | 279 878 | 7,27 |
| 40-44 | 130 725 | 130 042 | 260 767 | 6,77 |
| 45-49 | 113 877 | 114 213 | 228 090 | 5,92 |
| 50-54 | 96 564 | 98 076 | 194 640 | 5,05 |
| 55-59 | 76 084 | 78 641 | 154 725 | 4,02 |
| 60-64 | 58 974 | 62 105 | 121 079 | 3,14 |
| 65-69 | 45 360 | 48 700 | 94 060 | 2,44 |
| 70-74 | 33 839 | 37 313 | 71 152 | 1,85 |
| 75-79 | 23 622 | 27 020 | 50 642 | 1,32 |
| 80-84 | 14 944 | 17 956 | 32 900 | 0,85 |
| 85-89 | 8 174 | 10 458 | 18 632 | 0,48 |
| 90-94 | 3 573 | 4 938 | 8 511 | 0,22 |
| 95-99 | 1 119 | 1 678 | 2 797 | 0,07 |
| 100+ | 184 | 294 | 478 | 0,01 |
| Age group | Male | Female | Total | Percent |
|---|---|---|---|---|
| 0-14 | 552 863 | 530 110 | 1 082 973 | 28,12 |
| 15-64 | 1 250 586 | 1 238 004 | 2 488 590 | 64,63 |
| 65+ | 130 815 | 148 357 | 279 172 | 7,25 |
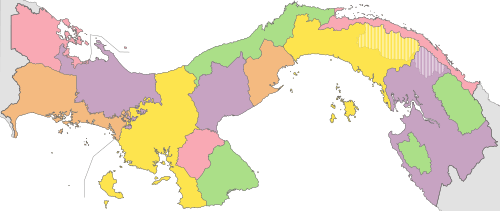
Population distribution
More than half the population lives in the Panama City-Colón metropolitan corridor.
| Province | Capital city | Population(2010 Est.)[4] |
|---|---|---|
| Bocas del Toro | Bocas del Toro | 118,405 |
| Coclé | Penonomé | 237,840 |
| Colón | Colón | 250,802 |
| Chiriquí | David | 426,790 |
| Darién | La Palma | 46,011 |
| Herrera | Chitré | 112,538 |
| Los Santos | Las Tablas | 90,984 |
| Panamá | Ciudad de Panamá | 1,796,674 |
| Veraguas | Santiago | 226,847 |
| Comarca | Capital city | Population |
| Emberá-Wounaan | Unión Choco | 9,497 |
| Kuna de Madugandí | N/D | N/D |
| Kuna Yala | El Porvenir | 37,545 |
| Kuna de Wargandí | N/D | N/D |
| Ngöbe-Buglé | Buabidi | 150,550 |
Ethnic groups
Ethnic Groups in Panama %[5]
The culture, customs, and language of Panama are predominantly Caribbean Spanish. In 2010 the population was 65% Mestizo (mixed white, Native American), 9.2% Black, 6.8% mulattoes, 13% White and 6% Native Americans.[5]
Ethnic groups in Panama include Spanish, British and Irish, Dutch, French, Germans, Italians, Portuguese, Poles, Russians or Ukrainians, (a large number are Jews), Greeks, and Americans.
Afro-Panamanian groups include West Indies/Caribbean (esp. Afro-Caribbean) nationalities, in which thousands of Barbadian and Jamaican workers played a role in the construction of the Panama Canal. During the Atlantic Slave Trade, thousands of West Africans were transported to various places in Panama. This took place around the 1500s, making half of all Panamanians contain African ancestry. There has also been immigration of Arabs and Asians: in particular Chinese, Lebanese, Palestinians, South Asians (from India and Pakistan) and Syrians.
Indigenous
| Ethnic group |
Census 1990 | Census 2000 | Census 2010 | |||
|---|---|---|---|---|---|---|
| Number | % | Number | % | Number | % | |
| Non-indigenous | 2,135,060 | 91.7 | 2,553,946 | 90.0 | 2,988,254 | 87.7 |
| Amerindian | 194,269 | 8.3 | 285,231 | 10.0 | 417,559 | 12.3 |
| Total | 2,329,329 | 2,839,177 | 3,405,813 | |||
| Ethnic group |
Census 1990 | Census 2000 | Census 2010 | |||
|---|---|---|---|---|---|---|
| Number | % | Number | % | Number | % | |
| Ngäbe (Guaymi) | 123,626 | 63.6 | 169,130 | 59.3 | 260,058 | 62.3 |
| Buglé (Bokota) | 3,784 | 1.9 | 18,724 | 6.6 | 26,871 | 6.4 |
| Kuna | 47,298 | 24.3 | 61,707 | 21.6 | 80,526 | 19.3 |
| Emberá | 14,659 | 7.5 | 22,485 | 7.9 | 31,284 | 7.5 |
| Wounaan | 2,605 | 1.3 | 6,882 | 2.4 | 7,279 | 1.7 |
| Teribe/Naso | 2,194 | 1.1 | 3,305 | 1.2 | 4,046 | 1.0 |
| Bribri | 2,521 | 0.9 | 1,068 | 0.3 | ||
| Other | 103 | 0.1 | 460 | 0.1 | ||
| Not declared | 477 | 0.2 | 5,967 | 1.4 | ||
Chinese
Panama has a considerable population of Chinese origin. The first Chinese immigrated to Panama from southern China in the 19th century to help build the Panama Railroad. There followed several waves of immigrants, especially after the 1970s, when the ensuing decades saw up to 80,000 immigrants from all over China. At least 50,000 Panamanians are ethnic Chinese, though some estimates count as many as 135,000. Most of the Chinese population reside in the province of Chiriquí. Some studies suggest that almost 1 million Panamanians have at least one Chinese ancestor. [7][8]
African Panamanians
Afro-Panamanians first arrived during the colonial era. They are intermixed in the general population or live in small Afro-Panamanian communities along the Atlantic Coast and in villages within the Darién jungle. Most of the people in Darien are fishermen or small-scale farmers growing crops such as bananas, rice and coffee as well as raising livestock. Other Afro-Panamanians descend from later migrants from the Caribbean who came to work on railroad-construction projects, commercial agricultural enterprises, and (especially) the canal. Important Afro-Caribbean community areas include towns and cities such as Colón, Cristobal and Balboa, in the former Canal Zone, as well as the Río Abajo area of Panama City. Another region with a large Afro-Caribbean population is the province of Bocas del Toro on the Caribbean coast just south of Costa Rica.[9]
Most of the Panamanian population of West Indian descent owe their presence in the country to the monumental efforts to build the Panama Canal in the late 19th and early 20th centuries. Three-quarters of the 50,000 workers who built the canal were Afro Caribbean migrants from the British West Indies. Thousands of Afro-Caribbean workers were recruited from Jamaica, Barbados and Trinidad.[9]
Languages
Many languages, including seven indigenous languages, are spoken in Panama, although Spanish is the official and dominant language. The local variant is Panamanian Spanish. English is sometimes spoken by many professionals and those working in the business or governmental sectors of society.
Indigenous languages include Guaymí, Kuna, Northern Embera and Teribe. Bocas del Toro Creole is also spoken.
Religion
The majority of Panamanians are Christian; most are Roman Catholics as a result centuries of Spanish colonial influence. Other faiths exist in Panama by the country's tolerance and freedom of religion, there are large Protestant, Jewish, Bahá'í, Muslim and Hindu religious groups in Panama.
Vital statistics
Registration of vital events is in Panama not complete. The Population Departement of the United Nations prepared the following estimates.[2]
| Period | Live births per year |
Deaths per year |
Natural change per year |
CBR* | CDR* | NC* | TFR* | IMR* | Life expectancy total |
Life expectancy males |
Life expectancy females |
|---|---|---|---|---|---|---|---|---|---|---|---|
| 1950-1955 | 38 000 | 11 000 | 27 000 | 41.4 | 12.0 | 29.5 | 5.76 | 92 | 56.8 | 55.9 | 57.8 |
| 1955-1960 | 44 000 | 11 000 | 33 000 | 41.7 | 10.6 | 31.1 | 5.87 | 80 | 59.5 | 58.6 | 60.5 |
| 1960-1965 | 50 000 | 11 000 | 39 000 | 40.9 | 9.2 | 31.6 | 5.79 | 68 | 62.1 | 61.1 | 63.3 |
| 1965-1970 | 55 000 | 12 000 | 44 000 | 38.8 | 8.1 | 30.7 | 5.41 | 58 | 64.3 | 63.2 | 65.6 |
| 1970-1975 | 59 000 | 11 000 | 48 000 | 36.1 | 7.0 | 29.2 | 4.88 | 48 | 66.7 | 65.1 | 68.5 |
| 1975-1980 | 61 000 | 11 000 | 50 000 | 32.5 | 5.9 | 26.6 | 4.19 | 39 | 69.2 | 67.2 | 71.5 |
| 1980-1985 | 62 000 | 11 000 | 51 000 | 29.5 | 5.4 | 24.1 | 3.63 | 34 | 71.0 | 68.6 | 73.7 |
| 1985-1990 | 64 000 | 12 000 | 53 000 | 27.3 | 5.1 | 22.3 | 3.24 | 29 | 72.4 | 69.6 | 75.4 |
| 1990-1995 | 67 000 | 13 000 | 54 000 | 25.5 | 4.9 | 20.6 | 2.96 | 26 | 73.6 | 70.8 | 76.5 |
| 1995-2000 | 71 000 | 14 000 | 57 000 | 24.6 | 4.8 | 19.8 | 2.87 | 24 | 74.6 | 72.2 | 77.2 |
| 2000-2005 | 74 000 | 15 000 | 59 000 | 23.1 | 4.8 | 18.3 | 2.76 | 20 | 75.6 | 73.0 | 78.3 |
| 2005-2010 | 75 000 | 17 000 | 58 000 | 21.3 | 4.9 | 16.4 | 2.62 | 17 | 76.4 | 73.6 | 79.5 |
| 2010-2015 | 19.8 | 5.0 | 14.8 | 2.48 | |||||||
| 2015-2020 | 18.4 | 5.1 | 13.3 | 2.36 | |||||||
| * CBR = crude birth rate (per 1000); CDR = crude death rate (per 1000); NC = natural change (per 1000); IMR = infant mortality rate per 1000 births; TFR = total fertility rate (number of children per woman) | |||||||||||
Births and deaths
| Year | Population | Live births | Deaths | Natural increase | Crude birth rate | Crude death rate | Rate of natural increase | TFR |
|---|---|---|---|---|---|---|---|---|
| 1952 | 29 013 | 6 791 | 22 222 | 36.0 | 8.4 | 27.6 | ||
| 1953 | 31 428 | 7 638 | 23 790 | 37.9 | 9.2 | 28.7 | ||
| 1954 | 33 521 | 7 511 | 26 010 | 39.3 | 8.8 | 30.5 | ||
| 1955 | 34 592 | 8 059 | 26 533 | 39.4 | 9.2 | 30.2 | ||
| 1956 | 35 582 | 8 352 | 27 230 | 39.3 | 9.2 | 30.1 | ||
| 1957 | 37 743 | 8 656 | 29 087 | 40.5 | 9.3 | 31.2 | ||
| 1958 | 37 733 | 8 364 | 29 369 | 39.3 | 8.7 | 30.6 | ||
| 1959 | 40 296 | 8 959 | 31 337 | 40.8 | 9.1 | 31.7 | ||
| 1960 | 42 359 | 8 827 | 33 532 | 39.9 | 8.3 | 31.6 | ||
| 1961 | 44 207 | 8 851 | 35 356 | 40.4 | 8.1 | 32.3 | ||
| 1962 | 46 274 | 8 239 | 38 035 | 41.1 | 7.3 | 33.8 | ||
| 1963 | 46 656 | 9 239 | 37 417 | 40.2 | 8.0 | 32.2 | ||
| 1964 | 47 419 | 8 743 | 38 676 | 39.6 | 7.3 | 32.3 | ||
| 1965 | 48 377 | 9 035 | 39 342 | 39.2 | 7.3 | 31.9 | ||
| 1966 | 49 394 | 9 184 | 40 210 | 38.9 | 7.2 | 31.7 | ||
| 1967 | 50 795 | 8 938 | 41 857 | 38.8 | 6.8 | 32.0 | ||
| 1968 | 52 489 | 9 568 | 42 921 | 38.9 | 7.1 | 31.8 | ||
| 1969 | 52 799 | 9 791 | 43 008 | 38.0 | 7.0 | 31.0 | ||
| 1970 | 53 287 | 10 225 | 43 062 | 37.1 | 7.1 | 30.0 | 5.0 | |
| 1971 | 54 948 | 9 857 | 45 091 | 37.2 | 6.7 | 30.5 | ||
| 1972 | 54 910 | 9 076 | 45 834 | 36.0 | 6.0 | 30.0 | ||
| 1973 | 52 091 | 9 161 | 42 930 | 33.2 | 5.8 | 27.4 | ||
| 1974 | 52 772 | 9 001 | 43 771 | 32. 6 | 5.6 | 27.0 | ||
| 1975 | 53 790 | 8 683 | 45 107 | 32.3 | 5.2 | 27.1 | ||
| 1976 | 53 002 | 8 564 | 44 438 | 30.8 | 5.0 | 25.8 | ||
| 1977 | 52 722 | 8 036 | 44 686 | 29.8 | 4.5 | 25.3 | ||
| 1978 | 53 040 | 7 555 | 45 485 | 29.1 | 4.1 | 25.0 | ||
| 1979 | 52 919 | 8 192 | 44 727 | 28.2 | 4.4 | 23.8 | ||
| 1980 | 52 626 | 7 959 | 44 667 | 26.9 | 4.1 | 22.8 | 3.4 | |
| 1981 | 53 873 | 7 976 | 45 897 | 26.9 | 4.0 | 22.9 | ||
| 1982 | 54 491 | 8 142 | 46 349 | 26.7 | 4.0 | 22.7 | ||
| 1983 | 55 222 | 8 499 | 46 723 | 26.4 | 4.1 | 22.3 | ||
| 1984 | 56 659 | 8 250 | 48 409 | 26.5 | 3.9 | 22.6 | ||
| 1985 | 58 038 | 8 991 | 49 047 | 26.6 | 4.1 | 22.5 | ||
| 1986 | 57 655 | 8 942 | 48 713 | 25.9 | 4.0 | 21.9 | ||
| 1987 | 57 647 | 9 105 | 48 542 | 25.3 | 4.0 | 21.3 | ||
| 1988 | 58 459 | 9 382 | 49 077 | 25.2 | 4.0 | 21.2 | ||
| 1989 | 59 069 | 9 557 | 49 512 | 25.1 | 4.1 | 21.0 | ||
| 1990 | 59 904 | 9 799 | 50 105 | 25.0 | 4.1 | 20.9 | 2.9 | |
| 1991 | 60 080 | 9 683 | 50 397 | 24.6 | 4.0 | 20.6 | ||
| 1992 | 59 905 | 10 143 | 49 762 | 24.1 | 4.1 | 20.0 | ||
| 1993 | 59 191 | 10 669 | 48 522 | 23.3 | 4.2 | 19.1 | ||
| 1994 | 59 947 | 10 983 | 48 964 | 23.2 | 4.3 | 18.9 | ||
| 1995 | 61 939 | 11 032 | 50 907 | 23.5 | 4.2 | 19.3 | ||
| 1996 | 63 401 | 11 161 | 52 240 | 23.7 | 4.2 | 19.5 | ||
| 1997 | 68 009 | 12 179 | 55 830 | 25.0 | 4.5 | 20.5 | ||
| 1998 | 62 351 | 11 824 | 50 527 | 22.6 | 4.3 | 18.3 | ||
| 1999 | 64 248 | 11 938 | 52 310 | 22.9 | 4.2 | 18.7 | ||
| 2000 | 64 839 | 11 841 | 52 998 | 22.7 | 4.1 | 18.6 | 2.7 | |
| 2001 | 63 900 | 12 442 | 51 458 | 21.3 | 4.1 | 17.2 | ||
| 2002 | 61 671 | 12 428 | 49 243 | 20.2 | 4.1 | 16.1 | ||
| 2003 | 61 753 | 13 248 | 48 505 | 19.8 | 4.3 | 15.5 | ||
| 2004 | 62 743 | 13 475 | 49 268 | 19.8 | 4.2 | 15.6 | ||
| 2005 | 63 645 | 14 180 | 49 465 | 19.7 | 4.4 | 15.3 | ||
| 2006 | 65 764 | 14 358 | 51 406 | 20.0 | 4.4 | 15.6 | ||
| 2007 | 67 634 | 14 775 | 52 589 | 19.4 | 4.3 | 15.1 | ||
| 2008 | 68 759 | 15 115 | 53 644 | 19.4 | 4.3 | 15.1 | ||
| 2009 | 68 364 | 15 498 | 52 866 | 19.0 | 4.3 | 14.7 | 2.5 | |
| 2010 | 3 405 813 | 67 955 | 16 542 | 51 413 | 18.6 | 4.5 | 14.1 | 2.4 |
| 2011 | 73 292 | 16 367 | 56 925 | 19.7 | 4.4 | 15.3 | 2.5 | |
| 2012 | 75 486 | 17 350 | 58 136 | 19.9 | 4.6 | 15.3 | 2.5 | |
| 2013 | 73 804 | 17 767 | 56 037 | 19.2 | 4.6 | 14.6 | ||
| 2014 | 75 183 | 18 171 | 57 012 | 19.2 | 4.6 | 14.6 | ||
| 2015 | 75 901 | 18 182 | 57 919 | 19.1 | 4.6 | 14.5 | ||
| 2016 | 75 184 | 18 882 | 56 302 | 18.6 | 4.7 | 13.9 | 2.4 | |
| 2017 | 74 832 | 18 388 | 56 444 | 18.3 | 4.7 | 13.6 | ||
See also
References
- ↑ "World Population Prospects: The 2017 Revision". ESA.UN.org (custom data acquired via website). United Nations Department of Economic and Social Affairs, Population Division. Retrieved 10 September 2017.
- 1 2 Population Division of the Department of Economic and Social Affairs of the United Nations Secretariat, World Population Prospects: The 2012 Revision Archived May 6, 2011, at the Wayback Machine.
- 1 2 http://unstats.un.org/unsd/demographic/products/dyb/dyb2.htm
- ↑ http://www.contraloria.gob.pa/dec/Publicaciones/13-03/Boletin9.pdf
- 1 2 "CIA - The World Factbook -- Panama". CIA. Archived from the original on 22 August 2013. Retrieved 2013-10-07.
- 1 2 Instituto Nacional de Estadistica y Censo (INEC)
- ↑ Jackson, Eric (May 2004). "Panama's Chinese community celebrates a birthday, meets new challenges". The Panama News. 10 (9). Archived from the original on September 16, 2007. Retrieved November 7, 2007.
- ↑ "President Chen's State Visit to Panama". Government Information Office, Republic of China. October 2003. Archived from the original on August 14, 2007. Retrieved November 7, 2007.
- 1 2 "Panama : Afro-Panamanians". Minority Rights Group International. Archived from the original on December 3, 2012. Retrieved June 26, 2010.
- ↑ "Central America and Caribbean :: PANAMA". CIA The World Factbook.
- ↑ "Estadísticas Vitales, Volumen III - Defunciones: Año 2015". Instituto Nacional de Estadística y Censo - INEC. Retrieved 16 February 2018.
![]()
| Indigenous | |
|---|---|
| Non-Indigenous | |
Portal | |
.svg.png)