Demographics of Guatemala
The Demographics of Guatemala are diverse, the 17,263,239 people (2018 estimate)[1] consist primarily of Mestizos, Amerindians, and people of European descent. The population is divided almost evenly between rural and urban areas.[2] About 65% of the population speak Spanish, with nearly all the rest speaking Amerindian languages (there are 23 officially recognized Amerindian languages[3]).
According to official 2012 national statistics, 39.8% of the population is indigenous.[2]
Population
According to the 2017 revision of the World Population Prospects[5] the total population estimate was 16,582,469 in 2016. The proportion of the population below the age of 15 in 2010 was 41.5%, 54.1% were aged between 15 and 65 years of age, and 4.4% were aged 65 years or older.[4]
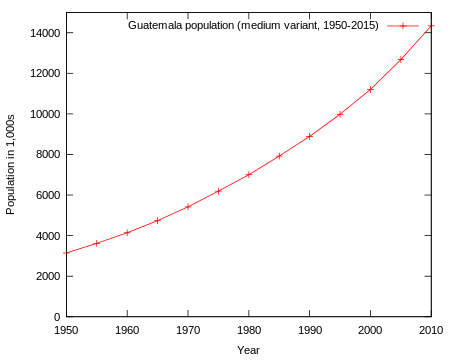
Guatemala City, the largest city in Central America, is home to over 3 million inhabitants. In 1900 Guatemala had a population of 885,000.[6] Over the twentieth century Guatemala's population grew by a factor of fourteen. Even though Guatemala's population grew by a factor of 14, it still wasn't the biggest jump in that region.[7] Although Guatemala does have an increase in population, the annual population isn't the superior in that region of the world as well.[7]
| Total population (x 1000) |
Proportion aged 0–14 (%) |
Proportion aged 15–64 (%) |
Proportion aged 65+ (%) | |
|---|---|---|---|---|
| 1950 | 3 146 | 44.6 | 52.9 | 2.5 |
| 1955 | 3 619 | 45.4 | 52.0 | 2.6 |
| 1960 | 4 141 | 45.8 | 51.6 | 2.7 |
| 1965 | 4 736 | 45.2 | 52.0 | 2.8 |
| 1970 | 5 416 | 44.6 | 52.5 | 2.9 |
| 1975 | 6 194 | 44.8 | 52.3 | 2.9 |
| 1980 | 7 001 | 45.4 | 51.6 | 3.0 |
| 1985 | 7 920 | 45.7 | 51.2 | 3.1 |
| 1990 | 8 890 | 45.4 | 51.3 | 3.4 |
| 1995 | 9 984 | 44.9 | 51.4 | 3.7 |
| 2000 | 11 204 | 44.1 | 51.9 | 4.0 |
| 2005 | 12 679 | 43.2 | 52.6 | 4.3 |
| 2010 | 14 342 | 41.5 | 54.1 | 4.4 |
Population by departments
In Guatemala, there are 22 departments that make up the country. Each department has its own population, with Guatemala City ranking at 1 with the highest population and El Progreso ranking at 22 with the lowest population.[8]
| Rank | Department | Pop. | Rank | Department | Pop. | Rank | Department | Pop. |
| 1 | Guatemala | 3,306,397 | 10 | Suchitepéquez | 555,261 | 18 | Retalhuleu | 325,556 |
| 2 | Huehuetenango | 1,234,593 | 11 | Sololá | 430,573 | 19 | Baja Verapaz | 291,903 |
| 3 | Alta Verapaz | 1,219,585 | 12 | Jutiapa | 489,085 | 20 | Zacapa | 291,903 |
| 4 | San Marcos | 1,095,997 | 13 | Izabal | 445,125 | 21 | Totonicapán | 134,373 |
| 5 | Quiché | 955,705 | 14 | Chiquimula | 397,202 | 22 | El Progreso | 22,654.00 |
| 6 | Quetzaltenango | 844,906 | 15 | Santa Rosa | 367,569 | |||
| 7 | Escuintla | 746,309 | 16 | Jalapa | 345,926 | |||
| 8 | Petén | 711,585 | 17 | Sacatepéquez | 336,606 | |||
| 9 | Chimaltenango | 666,938 | 18 | Total | 15,806,675 (2014) | |||
| Source: National Institute of Statistics (INE).[9] | ||||||||
According to the table, Guatemala City accounts for 20% of the entire population in Guatemala, while El Progreso only accounts for 0.14% of the population. Sololá accounts for 2.7% of the population while ranking in the middle at 11. Overall, the rankings correlate to the percent of the population that each department contains.
Emigration
The Guatemalan civil war from 1960 to 1996 provoked migration of Guatemalans, with a large majority of those leaving for foreign countries living in the United States. According to the International Organization for Migration, the total number of emigrants increased from 6,700 in the 1960s to 558,776 for the period 1995-2000, by 2005 the total number had reached 1.3 million.[10] In 2013, the MPI estimated that there are around 900,000 people of Guatemalan origin in the United States.[11]
| Country | Count |
|---|---|
| 480,665[12] – 1,489,426[13] | |
| 23,529[13] | |
| 14,693[13] | |
| 14,256[13] – 34,665[14] | |
| 5,989[13] | |
| 5,172[13] | |
| 4,209[13] | |
| 2,491[13] |
Ethnic groups
Official 2012 statistics indicate that approximately 60.2% of the population is "non-indigenous",[2] referring to the mestizo population and the people of European origin. These people are called Ladino in Guatemala.
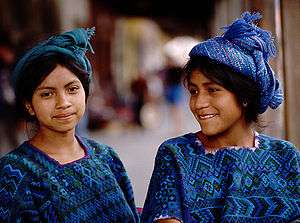
Approximately 39.8% of the population is indigenous[2] and consist of 23 Maya groups and one non-Maya group. These are divided as follows: (K'iche 9.1%, 8.4% Kaqchikel, Mam 7.9%, 6.3% Q'eqchi', other Maya peoples 8.6%, 0.2% indigenous non-Maya).[3] They live all over the country, especially in the highlands.
Other racial groups include numbers of Afro-Guatemalans, Afro-Mestizos, and Garifuna of mixed African and indigenous Caribbean origins who live in the country's eastern end. Some Garifunas live mainly in Livingston, San Vicente and Puerto Barrios. They descend mainly from the Arawaks and Belizean Creoles.[3]
There are thousands of Arab Guatemalans descending from; Palestine, Syria, Jordan, Iraq, and other Arab countries who reside in Guatemala City. Some belong to Christian Churches while others to Islamic Mosques.
There are also thousands of Jews residing in Guatemala. They are immigrants from Germany and Eastern Europe that arrived in the 19th century. Many immigrated during World War II. There are approximately 9,000 Jews living in Guatemala today. Most live in Guatemala City, Quezaltenango and San Marcos. Today, the Jewish community in Guatemala is made up of Orthodox Jews, Sephardi, Eastern European and German Jews.
In 2014, numerous members of the Hassidic communities Lev Tahor and Toiras Jesed began settling in the village of San Juan La Laguna. The mainstream Jewish community was reportedly dismayed and concerned that the arrival of communities with a more visible adherence to Judaism might stir up anti-Jewish sentiment. Despite the tropical heat, the members of the community continued to wear the traditional ancient Jewish clothing.[16][17][18]
Asian Guatemalans are primarily of Korean descent and Chinese descent, whose ancestors were farm workers and railroad laborers in the early 20th century.
History
The Mayan Civilization ruled Guatemala and the surrounding regions until around 1,000 A.D. Following 1,000 A.D., Guatemala became a Spanish colony for approximately three centuries, until in 1821 when Guatemala won its independence. Since the independence of Guatemala, the country has experienced a wide range of governments, including civilian and military governments. In 1996, a peace treaty was signed by the government that ended internal conflicts within the region, which caused over 200,000 casualties and approximately one million refugees. [19]
European Guatemalans
Approximately, 18.5% of the population is considered White or Caucasian, accounts for more than 3 million of the population. Most are of Spanish or German descent, but there is a considerable number of people of Italian, Belgian, French, British, Swiss, Finnish, Russian and Hungarian descent.
The departments of Zacapa and Chiquimula are half or predominantly of Spanish descent, with castizos, the white populations make up more than 80% in these departments, where many European immigrants arrived, mainly the 19th and 20th centuries. In Guatemala City there is a significant amount of minority descendants of Europeans (35-40%), and other minorities with more than 20% in Coban, Carlos V, and Xelaju.
Mestizo Guatemalans
Guatemalan Mestizos are people of mixed European and indigenous ancestry. The Mestizo population is heavily populated in urban areas of the country (the national capital and departmental capitals).[20]
Historically, the Mestizo population in the Kingdom of Guatemala at the time of Independence amounted to nearly 600,000 Indians, 300,000 Castas (mostly Mestizos and a lesser number of Mulattos, Zambos, and Pardos), and 45,000 Criollos or Spanish, with a very small number of Spaniards.[21]
Indigenous Guatemalans
The Amerindian populations in Guatemala include the K'iche' 9.1%, Kaqchikel 8.4%, Mam 7.9% and Q'eqchi 6.3%. 8.6% belongs to other Maya groups, 0.4% belong to non-Maya indigenous peoples. The whole indigenous community in Guatemala is about 40.5% of the population.[22]
Languages
The official language of Guatemala is Spanish. It is spoken by nearly 93% of the population and is found mainly in the departments of the Southern region, Eastern region, Guatemala City and Peten.[23] Though the official language is Spanish, it is often the second language among the indigenous population.
Approximately 23 additional Amerindian languages are spoken by more than 40% of the population.[24] 21 Mayan languages, one indigenous, and one Arawakan are spoken in Guatemala.[25] The most significant are; Quiche, Cakchiquel, Kekchi, Mam, Garifuna and Xinca.[24]
There are also significant numbers of German, Chinese, French and English speakers.
| Rank | Language | Language Family |
| 1 | Spanish | Indo-European |
| 2 | K’iche’ | Mayan |
| 3 | Q'eqchi' | Mayan |
| 4 | Kaqchikel | Mayan |
| 5 | Mam | Mayan |
| 6 | Poqomchi | Mayan |
| 7 | Tz’utujil | Mayan |
| 8 | Achí | Mayan |
| 9 | Q’anjob’al | Mayan |
| 10 | Ixil | Mayan |
| 11 | Akatek | Mayan |
| 12 | Jakaltek | Mayan |
| 13 | Chuj | Mayan |
| 14 | Poqomam | Mayan |
| 15 | Ch'orti' | Mayan |
| 16 | Awakatek | Mayan |
| 17 | Sakapultek | Mayan |
| 18 | Sipakapa | Mayan |
| 19 | Garífuna | Arawakan |
| 20 | Uspantek | Mayan |
| 21 | Tektitek | Mayan |
| 22 | Mopan | Mayan |
| 23 | Xincan languages | Isolate |
| 24 | Itza | Mayan |
[26].
Religion
Catholicism was the official religion during the colonial era. Protestantism has increased in recent decades. More than one third of Guatemalans are Protestant, chiefly Evangelicals and Pentecostals. Eastern and Oriental Orthodoxy claim rapid growth, especially among indigenous Mayans.
The Islamic community in Guatemala is growing, Muslim population of Guatemala is approximately 1,200. Of this population, 95% are Palestinian Arab immigrants. There is a mosque in the outskirts of Guatemala City called the Islamic Da'wah Mosque of Guatemala (Spanish: Mezquita de Aldawaa Islámica) which is available for the five daily prayers and offers classes in Islamic studies.
The president of the Islamic Community of the country is Jamal Mubarak.
Traditionally a large proportion of Guatemalans have been Catholics. This has declined, from 90% of the population in 1950, 61% in 1986, 65% in 1991 (after the visit of the Pope John Paul II), 57% in 2006,[28] and 47% in 2013.[27] Between 1882 and 1940, 2% of the population were Protestants, 17.98% were Protestant in 1978, 30% in 1986, 21% in 1991, 25.27% in 2001, 30.70% in 2006[28] and 40% Protestant in 2014.[27]
3% of Guatemalans follow other religions.[27] 9% are non-religious.[27] Guatemalans who self-identify as atheists/agnostics were 3.25% of the population in 1982, 12% in 1991, and 14.2% in 2001.[28] According to the Latinobarómetro, 8% of the population were irreligious in 1996, 15% in 2000, 16% in 2007, 11% in 2008, 13% in 2010, with 10% irreligious in 2014.[27] The "other religions" were 9% in 1996 to 14% one year later, and 3% in 2013.[27]
| Religious Evolution in Guatemala (by national census) | |||||
|---|---|---|---|---|---|
| Year | % Catholic | % Evangelic | % Others | % No religion | |
| 1882-1940 | 97% | 2% | 0.1% | 0.4% | |
| 1978 | 80.1% |
17.9% |
0.8% |
1.2% | |
| 1980 | 77% |
19.1% |
1.1% |
2.8% | |
| 1982 | 73.4% |
22.3% |
1.1% |
3.2% | |
| 1986 | 62.9% |
30% |
2% |
6% | |
| 1991 | 64.6% |
21% |
2.4% |
12% | |
| 1992 | 60.4% |
26.4% |
2.1% |
11.1% | |
| 2001 | 58.1% |
25.2% |
2.5% |
14.2% | |
| 2006 | 57.3% |
30.7% |
2.1% |
9.9% | |
| 2010 | 47.6% |
31.7% |
2.4% |
18.3% | |
| 2012 | 47.9% |
38.2% |
2.3% |
11.6% | |
| Religious identity in Guatemala (1996-2013). | ||||
|---|---|---|---|---|
| Year | % Catholics | % Protestants | % atheist/non-religion | % others |
| 1996 | 54% | 25% | 8% | 13% |
| 1997 | 54% | 24% | 6% | 16% |
| 1998 | 69% | 19% | 8% | 3% |
| 1999 | 60% | 27% | 9% | 3% |
| 2000 | 52% | 29% | 15% | 4% |
| 2001 | 58% | 29% | 7% | 6% |
| 2002 | 57% | 29% | 8% | 6% |
| 2003 | 59% | 32% | 7% | 2% |
| 2004 | 53% | 33% | 12% | 2% |
| 2005 | 57% | 31% | 10% | 2% |
| 2006 | 54% | 34% | 10% | 2% |
| 2007 | 48% | 36% | 15% | 1% |
| 2008 | 51% | 36% | 11% | 2% |
| 2009 | 54% | 34% | 9% | 3% |
| 2010 | 47% | 39% | 12% | 2% |
| 2011 | 55% | 30% | 11% | 4% |
| 2013 | 47% | 40% | 10% | 3% |
Vital statistics
UN estimates
The Population Department of the United Nations prepared the following estimates. [29]
| Period | Live births per year |
Deaths per year |
Natural change per year |
CBR* | CDR* | NC* | TFR* | IMR* | Life expectancy total |
Life expectancy males |
Life expectancy females |
|---|---|---|---|---|---|---|---|---|---|---|---|
| 1950-1955 | 170 000 | 75 000 | 95 000 | 50.3 | 22.3 | 28.0 | 7.00 | 141 | 42.5 | 41.8 | 43.3 |
| 1955-1960 | 183 000 | 78 000 | 104 000 | 47.0 | 20.2 | 26.9 | 6.60 | 134 | 44.5 | 43.7 | 45.4 |
| 1960-1965 | 204 000 | 80 000 | 124 000 | 46.0 | 18.0 | 28.0 | 6.50 | 127 | 47.1 | 46.2 | 48.1 |
| 1965-1970 | 227 000 | 80 000 | 146 000 | 44.7 | 15.8 | 28.8 | 6.30 | 116 | 50.1 | 49.0 | 51.3 |
| 1970-1975 | 255 000 | 79 000 | 177 000 | 44.0 | 13.5 | 30.4 | 6.20 | 102 | 53.9 | 52.4 | 55.4 |
| 1975-1980 | 287 000 | 80 000 | 206 000 | 43.5 | 12.2 | 31.3 | 6.20 | 91 | 56.2 | 54.4 | 58.2 |
| 1980-1985 | 315 000 | 81 000 | 234 000 | 42.2 | 10.9 | 31.3 | 6.10 | 79 | 58.3 | 56.1 | 60.8 |
| 1985-1990 | 333 000 | 79 000 | 254 000 | 39.6 | 9.4 | 30.2 | 5.70 | 67 | 60.9 | 58.3 | 63.8 |
| 1990-1995 | 367 000 | 76 000 | 291 000 | 38.9 | 8.1 | 30.8 | 5.45 | 55 | 63.5 | 60.5 | 66.9 |
| 1995-2000 | 396 000 | 73 000 | 322 000 | 37.3 | 6.9 | 30.4 | 5.00 | 46 | 66.3 | 62.9 | 70.0 |
| 2000-2005 | 427 000 | 72 000 | 355 000 | 35.8 | 6.1 | 29.7 | 4.60 | 39 | 69.0 | 65.5 | 72.5 |
| 2005-2010 | 449 000 | 77 000 | 373 000 | 33.3 | 5.7 | 27.6 | 4.15 | 30 | 70.3 | 66.7 | 73.8 |
| * CBR = crude birth rate (per 1000); CDR = crude death rate (per 1000); NC = natural change (per 1000); IMR = infant mortality rate per 1000 births; TFR = total fertility rate (number of children per woman) | |||||||||||
Over the course of 60 years, live births per year has increased by a factor of 2.6, while the deaths per year has only increased by a factor of 1.0. This suggests that the natural change per year has increased by a factor of 3.9. The crude birth rate has decreased from 50.3 births per 1,000 population to only 33.3 births per 1,000 population. Meanwhile, the crude death rate has decreased from 22.3 deaths per 1,000 population to 5.6 deaths per 1,000 population. The CDR and CBR correlate to the rate of natural change, which has fluctuated over the 60 year time period. The total fertility rate has decreased from 7.00 children per woman to 4.15 children per woman and the infant mortality rate decreased from 141 infant deaths per 1,000 live births to 30 infant deaths per 1,000 live births. The TFR decreases due to the decreased IMR. [30]Lastly, the table shows the total life expectancy for males and/or females. Overall, the total life expectancy has increased from approximately 43 years to approximately 70 years. [31]
Registered annual data
| Average population (x 1000) | Live births | Deaths | Natural change | Crude birth rate (per 1000) | Crude death rate (per 1000) | Natural change (per 1000) | TFR | |
|---|---|---|---|---|---|---|---|---|
| 1930 | 1 760 | 100 000 | 43 500 | 56 500 | 56.8 | 24.7 | 32.1 | |
| 1931 | 1 810 | 99 000 | 44 000 | 55 000 | 54.7 | 24.3 | 30.4 | |
| 1932 | 1 860 | 93 600 | 43 900 | 49 700 | 50.3 | 23.6 | 26.7 | |
| 1933 | 1 910 | 90 700 | 52 100 | 38 600 | 47.5 | 27.3 | 20.2 | |
| 1934 | 1 940 | 92 205 | 60 051 | 32 154 | 47.5 | 31.0 | 16.6 | |
| 1935 | 1 980 | 96 031 | 54 789 | 41 242 | 48.5 | 27.7 | 20.8 | |
| 1936 | 2 020 | 97 646 | 50 604 | 47 042 | 48.3 | 25.1 | 23.3 | |
| 1937 | 2 070 | 96 981 | 51 027 | 45 954 | 46.9 | 24.7 | 22.2 | |
| 1938 | 2 110 | 98 906 | 56 131 | 42 775 | 46.9 | 26.6 | 20.3 | |
| 1939 | 2 150 | 102 908 | 64 117 | 38 791 | 47.9 | 29.8 | 18.0 | |
| 1940 | 2 200 | 106 998 | 55 083 | 51 915 | 48.6 | 25.0 | 23.6 | |
| 1941 | 2 250 | 103 688 | 56 444 | 47 244 | 46.1 | 25.1 | 21.0 | |
| 1942 | 2 300 | 107 519 | 72 477 | 35 042 | 46.7 | 31.5 | 15.2 | |
| 1943 | 2 340 | 112 407 | 72 837 | 39 570 | 48.0 | 31.1 | 16.9 | |
| 1944 | 2 390 | 111 324 | 63 068 | 48 256 | 46.6 | 26.4 | 20.2 | |
| 1945 | 2 440 | 118 912 | 59 732 | 59 180 | 48.7 | 24.5 | 24.3 | |
| 1946 | 2 500 | 120 525 | 61 641 | 58 884 | 48.2 | 24.7 | 23.6 | |
| 1947 | 2 570 | 134 066 | 63 316 | 70 750 | 52.2 | 24.6 | 27.5 | |
| 1948 | 2 641 | 137 009 | 62 090 | 74 919 | 51.9 | 23.5 | 28.4 | |
| 1949 | 2 724 | 140 596 | 59 277 | 81 319 | 51.6 | 21.8 | 29.9 | |
| 1950 | 3 146 | 142 673 | 61 234 | 81 439 | 48.1 | 20.6 | 27.4 | |
| 1951 | 3 238 | 151 416 | 56 550 | 94 866 | 49.6 | 18.5 | 31.1 | |
| 1952 | 3 331 | 151 865 | 71 994 | 79 871 | 48.3 | 22.9 | 25.4 | |
| 1953 | 3 426 | 156 377 | 70 794 | 85 583 | 48.3 | 21.9 | 26.4 | |
| 1954 | 3 521 | 162 773 | 58 132 | 104 641 | 48.9 | 17.4 | 31.4 | |
| 1955 | 3 619 | 158 856 | 67 088 | 91 768 | 46.3 | 19.6 | 26.7 | |
| 1956 | 3 719 | 163 301 | 66 280 | 97 021 | 46.2 | 18.8 | 27.5 | |
| 1957 | 3 820 | 170 381 | 70 933 | 99 448 | 46.9 | 19.5 | 27.4 | |
| 1958 | 3 924 | 172 745 | 75 634 | 97 111 | 46.2 | 20.2 | 26.0 | |
| 1959 | 4 031 | 181 740 | 63 010 | 118 730 | 47.2 | 16.4 | 30.8 | |
| 1960 | 4 141 | 186 476 | 65 805 | 120 671 | 47.1 | 16.6 | 30.4 | |
| 1961 | 4 253 | 193 833 | 63 287 | 130 546 | 47.5 | 15.5 | 32.0 | |
| 1962 | 4 369 | 191 420 | 69 287 | 122 133 | 45.6 | 16.5 | 29.1 | |
| 1963 | 4 488 | 197 671 | 71 449 | 126 222 | 45.8 | 16.6 | 29.2 | |
| 1964 | 4 610 | 196 386 | 68 278 | 128 108 | 44.2 | 15.4 | 28.9 | |
| 1965 | 4 736 | 201 059 | 74 830 | 126 229 | 44.0 | 16.4 | 27.6 | |
| 1966 | 4 864 | 206 520 | 75 774 | 130 746 | 44.0 | 16.1 | 27.8 | |
| 1967 | 4 996 | 201 816 | 71 191 | 130 625 | 41.8 | 14.8 | 27.1 | |
| 1968 | 5 132 | 211 679 | 79 421 | 132 258 | 42.7 | 16.0 | 26.7 | |
| 1969 | 5 271 | 215 397 | 85 174 | 130 223 | 42.2 | 16.7 | 25.5 | |
| 1970 | 5 416 | 212 151 | 77 333 | 134 818 | 40.5 | 14.7 | 25.7 | |
| 1971 | 5 565 | 229 674 | 75 223 | 154 451 | 42.6 | 14.0 | 28.6 | |
| 1972 | 5 719 | 241 593 | 67 989 | 173 604 | 43.6 | 12.3 | 31.3 | |
| 1973 | 5 877 | 238 498 | 69 454 | 169 044 | 41.8 | 12.2 | 29.6 | |
| 1974 | 6 036 | 252 203 | 69 820 | 182 383 | 43.0 | 11.9 | 31.1 | |
| 1975 | 6 194 | 249 332 | 78 708 | 170 624 | 41.4 | 13.1 | 28.4 | |
| 1976 | 6 352 | 266 728 | 81 627 | 185 101 | 43.2 | 13.2 | 30.0 | |
| 1977 | 6 510 | 284 747 | 71 777 | 212 970 | 45.0 | 11.3 | 33.6 | |
| 1978 | 6 669 | 286 415 | 66 844 | 219 571 | 44.1 | 10.3 | 33.8 | |
| 1979 | 6 832 | 295 972 | 72 274 | 223 698 | 44.5 | 10.9 | 33.6 | |
| 1980 | 7 001 | 303 643 | 71 352 | 232 291 | 44.5 | 10.5 | 34.1 | |
| 1981 | 7 177 | 308 413 | 75 658 | 232 755 | 44.1 | 10.8 | 33.3 | |
| 1982 | 7 358 | 312 047 | 76 267 | 235 780 | 43.5 | 10.6 | 32.9 | |
| 1983 | 7 543 | 306 827 | 74 462 | 232 365 | 41.7 | 10.1 | 31.6 | |
| 1984 | 7 731 | 312 094 | 75 462 | 236 632 | 41.3 | 10.0 | 31.4 | |
| 1985 | 7 920 | 326 849 | 69 455 | 257 394 | 42.2 | 9.0 | 33.3 | |
| 1986 | 8 109 | 318 340 | 66 328 | 252 012 | 40.1 | 8.4 | 31.8 | |
| 1987 | 8 299 | 319 942 | 66 404 | 253 538 | 39.4 | 8.2 | 31.2 | |
| 1988 | 8 492 | 337 396 | 64 100 | 273 296 | 40.5 | 7.7 | 32.8 | |
| 1989 | 8 688 | 340 807 | 61 548 | 279 259 | 39.9 | 7.2 | 32.7 | |
| 1990 | 8 890 | 347 207 | 73 344 | 273 863 | 39.7 | 8.4 | 31.3 | |
| 1991 | 9 099 | 359 904 | 72 896 | 287 008 | 39.6 | 8.0 | 31.5 | |
| 1992 | 9 313 | 363 648 | 73 124 | 290 524 | 39.0 | 7.9 | 31.2 | |
| 1993 | 9 533 | 370 138 | 73 870 | 296 268 | 38.8 | 7.7 | 31.1 | |
| 1994 | 9 756 | 381 497 | 74 761 | 306 736 | 39.1 | 7.7 | 31.4 | |
| 1995 | 9 984 | 371 091 | 65 159 | 305 932 | 37.2 | 6.5 | 30.6 | |
| 1996 | 10 215 | 377 723 | 60 618 | 317 105 | 37.0 | 5.9 | 31.0 | |
| 1997 | 10 450 | 387 862 | 67 691 | 320 171 | 37.1 | 6.5 | 30.6 | |
| 1998 | 10 691 | 400 133 | 69 847 | 330 286 | 37.4 | 6.5 | 30.9 | |
| 1999 | 10 942 | 409 034 | 65 139 | 343 895 | 37.4 | 6.0 | 31.4 | |
| 2000 | 11 204 | 425 410 | 67 284 | 358 126 | 38.0 | 6.0 | 32.0 | |
| 2001 | 11 479 | 415 338 | 68 041 | 347 297 | 36.2 | 5.9 | 30.3 | |
| 2002 | 11 766 | 387 287 | 66 089 | 321 198 | 32.9 | 5.6 | 27.3 | |
| 2003 | 12 063 | 375 092 | 66 695 | 308 397 | 31.1 | 5.5 | 25.6 | |
| 2004 | 12 368 | 383 704 | 66 991 | 316 713 | 31.0 | 5.4 | 25.6 | |
| 2005 | 12 679 | 374 066 | 71 039 | 303 027 | 29.5 | 5.6 | 23.9 | 3.8 |
| 2006 | 12 995 | 368 399 | 69 756 | 298 643 | 28.3 | 5.4 | 22.9 | 3.6 |
| 2007 | 13 318 | 366 128 | 70 030 | 296 098 | 27.4 | 5.2 | 22.2 | 3.5 |
| 2008 | 13 678 | 369 769 | 70 233 | 299 536 | 27.0 | 5.1 | 21.9 | 3.4 |
| 2009 | 14 017 | 351 628 | 71 707 | 279 921 | 25.1 | 5.1 | 20.0 | 3.1 |
| 2010 | 14 362 | 361 906 | 72 748 | 289 158 | 25.2 | 5.1 | 20.1 | 3.1 |
| 2011 | 14 714 | 373 692 | 72 354 | 301 338 | 25.4 | 4.9 | 20.5 | 3.1 |
| 2012 | 15 073 | 388 613 | 72 657 | 315 956 | 25.8 | 4.8 | 21.0 | 3.1 |
| 2013 | 15 438 | 387 342 | 76 639 | 310 703 | 25.1 | 5.0 | 20.1 | 3.1 |
| 2014 | 15 807 | 386 195 | 77 807 | 308 388 | 24.4 | 4.9 | 19.5 | 3.3 |
| 2015 | 16 176 | 391 425 | 80 876 | 310 549 | 24.2 | 5.0 | 19.2 | 2.9 |
| 2016 | 16 500 | 390 382 | 82 585 | 307 797 | 23.7 | 5.0 | 18.7 |
Fertility and Births (Demographic and Health Surveys)
Total Fertility Rate (TFR) (Wanted Fertility Rate) and Crude Birth Rate (CBR):[34][35]
| Year | CBR (Total) | TFR (Total) | CBR (Urban) | TFR (Urban) | CBR (Rural) | TFR (Rural) |
|---|---|---|---|---|---|---|
| 1987 | 5.6 (4.9) | 4.1 (3.5) | 6.5 (5.8) | |||
| 1995 | 5.1 (4.0) | 3.8 (3.0) | 6.2 (4.8) | |||
| 1998-99 | 38.0 | 5.0 (4.1) | 34.8 | 4.1 (3.4) | 40.1 | 5.8 (4.6) |
| 2002 | 4.4 | 3.4 | 5.2 | |||
| 2008-09 | 3.6 | 2.9 | 4.2 | |||
| 2014-15 | 27.3 | 3.1 (2.6) | 22.5 | 2.5 (2.0) | 31.0 | 3.7 (3.0) |
Structure of the population [36]
Structure of the population (01.07.2005) (Estimates) :
| Age Group | Male | Female | Total | % |
|---|---|---|---|---|
| Total | 6 197 399 | 6 502 381 | 12 699 780 | 100 |
| 0-4 | 1 035 549 | 1 000 763 | 2 036 312 | 16,03 |
| 5-9 | 921 924 | 901 718 | 1 823 642 | 14,36 |
| 10-14 | 815 791 | 808 328 | 1 624 119 | 12,79 |
| 15-19 | 685 359 | 694 215 | 1 379 574 | 10,86 |
| 20-24 | 571 385 | 608 879 | 1 180 264 | 9,29 |
| 25-29 | 446 309 | 506 386 | 952 695 | 7,50 |
| 30-34 | 340 378 | 412 767 | 753 145 | 5,93 |
| 35-39 | 270 907 | 329 253 | 600 160 | 4,73 |
| 40-44 | 225 243 | 267 504 | 492 747 | 3,88 |
| 45-49 | 191 635 | 218 053 | 409 688 | 3,23 |
| 50-54 | 175 311 | 191 751 | 367 062 | 2,89 |
| 55-59 | 149 593 | 161 320 | 310 913 | 2,45 |
| 60-64 | 113 686 | 119 957 | 233 643 | 1,84 |
| 65-69 | 94 128 | 98 864 | 192 992 | 1,52 |
| 70-74 | 74 463 | 81 804 | 156 267 | 1,23 |
| 75-79 | 50 340 | 57 089 | 107 429 | 0,85 |
| 80+ | 35 398 | 43 730 | 79 128 | 0,62 |
| Age group | Male | Female | Total | Percent |
|---|---|---|---|---|
| 0-14 | 2 773 264 | 2 710 809 | 5 484 073 | 43,18 |
| 15-64 | 3 169 806 | 3 510 085 | 6 679 891 | 52,60 |
| 65+ | 254 329 | 281 487 | 535 816 | 4,22 |
Structure of the population (01.07.2010) (Estimates) (Projections based on the 2002 Population Census) :
| Age Group | Male | Female | Total | % |
|---|---|---|---|---|
| Total | 7 003 337 | 7 358 328 | 14 361 666 | 100 |
| 0-4 | 1 103 521 | 1 062 224 | 2 165 745 | 15,08 |
| 5-9 | 1 017 180 | 987 490 | 2 004 670 | 13,96 |
| 10-14 | 906 603 | 891 659 | 1 798 262 | 12,52 |
| 15-19 | 794 459 | 795 688 | 1 590 147 | 11,07 |
| 20-24 | 646 911 | 675 214 | 1 322 125 | 9,21 |
| 25-29 | 538 214 | 590 746 | 1 128 960 | 7,86 |
| 30-34 | 418 535 | 494 657 | 913 192 | 6,36 |
| 35-39 | 323 010 | 402 681 | 725 691 | 5,05 |
| 40-44 | 258 454 | 321 849 | 580 303 | 4,04 |
| 45-49 | 215 304 | 260 145 | 475 449 | 3,31 |
| 50-54 | 182 662 | 211 040 | 393 702 | 2,74 |
| 55-59 | 165 910 | 184 214 | 350 124 | 2,44 |
| 60-64 | 139 395 | 152 936 | 292 331 | 2,04 |
| 65-69 | 103 433 | 111 058 | 214 491 | 1,49 |
| 70-74 | 81 809 | 88 219 | 170 028 | 1,18 |
| 75-79 | 60 257 | 68 733 | 128 990 | 0,90 |
| 80+ | 47 678 | 59 778 | 107 456 | 0,75 |
| Age group | Male | Female | Total | Percent |
|---|---|---|---|---|
| 0-14 | 3 027 304 | 2 941 373 | 5 968 677 | 41,56 |
| 15-64 | 3 682 856 | 4 089 167 | 7 772 023 | 54,12 |
| 65+ | 293 177 | 327 788 | 620 965 | 4,32 |
Structure of the population (2015):[37]
| Age Group | Total | % |
|---|---|---|
| Total | 16 176 133 | 100 |
| 0-4 | 2 262 514 | 13.99 |
| 5-9 | 2 142 308 | 13.24 |
| 10-14 | 1 988 541 | 12.29 |
| 15-19 | 1 776 352 | 10.98 |
| 20-24 | 1 553 450 | 9.60 |
| 25-29 | 1 286 639 | 7.95 |
| 30-34 | 1 099 039 | 6.79 |
| 35-39 | 889 673 | 5.50 |
| 40-44 | 707 191 | 4.37 |
| 45-49 | 563 431 | 3.48 |
| 50-54 | 459 432 | 2.84 |
| 55-59 | 377 242 | 2.33 |
| 60-64 | 330 803 | 2.05 |
| 65+ | 739 518 | 4.57% |
| Age group | Total | Percent |
|---|---|---|
| 0-14 | 6 393 363 | 39.52 |
| 15-64 | 9 043 252 | 55.90 |
| 65+ | 739 518 | 4.57 |
References
- ↑ Guatemala: Estimaciones de la Población total por municipio. Período 2008-2020 Archived 2015-04-04 at the Wayback Machine.
- 1 2 3 4 5 "Caracterización estadística República de Guatemala 2012" (PDF). INE. Archived from the original on November 2012. Retrieved 2014-11-02.
- 1 2 3 4 "CIA - The World Factbook". Cia.gov. Retrieved 2013-04-22.
- 1 2 "Population Division of the Department of Economic and Social Affairs of the United Nations Secretariat, World Population Prospects: The 2012 Revision".
- ↑ "World Population Prospects: The 2017 Revision". ESA.UN.org (custom data acquired via website). United Nations Department of Economic and Social Affairs, Population Division. Retrieved 10 September 2017.
- ↑ Lahmeyer, Jan (2002). "Guatemala: historical demographical data of the whole country". Population Statistics. Retrieved 2015-05-03.
- 1 2 "World Population Prospects - Population Division - United Nations". esa.un.org. Retrieved 2017-03-28.
- ↑ "Republica de Guatemala". 2009-04-16. Retrieved 2018-03-25.
- ↑ "Guatemalan population growth (by departament)" (web page). INE. Retrieved 2014-12-12.
- ↑ Economic Migrants Replace Political Refugees see Table 1. Emigration Flows from Guatemala, 1960s through 2005. Retrieved on, 18 November 2014
- ↑ "Largest U.S. Immigrant Groups over Time, 1960-Present". Migration Policy Institute. Retrieved 4 May 2015.
- ↑ The 2000 U.S. Census recorded 480,665 Guatemalan-born respondents; see Smith (2006)
- 1 2 3 4 5 6 7 8 Smith, James (April 2006). "DRC Migration, Globalisation and Poverty". Used the Version 4 data.
- ↑ Da, Wei Wei (2002). "Guatemalans in Canada: Contexts of Departure and Arrival" (PDF). Latin American Study Group. Retrieved June 1, 2010.
- ↑ National population of the National Institute of Statistics (INE). demographic info 2010.
- ↑ "Ancient Jewish Tradition of clothing". Archived from the original on 2015-04-02.
- ↑ "Ultra-orthodox Lev Tahor settlement has spurred tension in Guatemalan village, CIJA says".
- ↑ "More Lev Tahor sect members leaving Canada for Guatemala".
- ↑ "The World Factbook". Central Intelligence Agency. March 25, 2018.
- ↑ "Guatemala - Central America: guatemala history, guatemala population, culture dominant, guatemala republic, independence spain". www.countriesquest.com.
- ↑ "GUATEMALA: DEL MESTIZAJE A LA LADINIZACION, 1524-1964" (PDF). CIRMA. Retrieved 2014-11-04.
- ↑ "Belize" (PDF). 2010 Belize Housing and Population Census. Statistical Institute of Belize. Archived from the original (PDF) on 12 August 2011. Retrieved 7 June 2012.
- ↑ "CIA - The World Factbook". Cia.gov. Retrieved 2013-04-22.
- 1 2 "Central America and Caribbean :: GUATEMALA". CIA The World Factbook.
- ↑ "What Languages Are Spoken In Guatemala?". WorldAtlas. Retrieved 2018-04-09.
- ↑ "What Languages Are Spoken In Guatemala?". WorldAtlas. Retrieved 2018-04-09.
- 1 2 3 4 5 6 7 8 "Las religiones en tiempos del Papa Francisco" (PDF) (in Spanish). Latinobarómetro. April 2014. p. 6. Archived from the original (pdf) on 4 April 2015. Retrieved 4 April 2015.
- 1 2 3 El crecimiento de las Iglesias Evangélicas en Guatemala: Una mirada Socio-religiosa Guatemala, November 2010
- ↑ "Population Division of the Department of Economic and Social Affairs of the United Nations Secretariat, World Population Prospects: The 2012 Revision".
- ↑ Eslami, Mohammad (December 2016). "Decreasing Total Fertility Rate in Developing Countries". Journal of Family & Reproductive Health. 10 (4): 163–164. PMC 5440814. PMID 28546814.
- ↑ "Population Division of the Department of Economic and Social Affairs of the United Nations Secretariat, World Population Prospects: The 2012 Revision".
- ↑ "United Nations Statistics Division - Demographic and Social Statistics". unstats.un.org.
- ↑ "Inicio". www.ine.gob.gt.
- ↑ "The DHS Program - Page Not Found" (PDF). www.dhsprogram.com.
- ↑ "The DHS Program - Survey Search". www.dhsprogram.com.
- ↑ "United Nations Statistics Division - Demographic and Social Statistics". unstats.un.org.
- ↑ "Tema / Indicadores". www.ine.gob.gt.
| Guatemalan Indians (Maya and others) | |
|---|---|
| Former and extinct | |
| Guatemalan mestizo | |
| Descendants of Europeans (whites or Criollo) | |
| Descendants of Asians | |
| Afro-Descendants | |
| Americas | |
Portal | |
| History |  | ||||
|---|---|---|---|---|---|
| Geography |
| ||||
| Politics | |||||
| Economy | |||||
| Society |
| ||||
| |||||