Ethnic origins of people in Canada
| Part of a series on the |
| Culture of Canada |
|---|
 |
| History |
| Topics |
| Research |
| Portal |
Given here are the ethnic origins of Canadian residents (citizens, landed immigrants, and non-citizen temporary residents) as recorded by them on their 2016 census form. The relevant census question asked for "the ethnic or cultural origins" of the respondent's ancestors and not the respondents themselves.
As data were collected by self-declaration, labels may not necessarily describe the true ancestry of respondents.[1] Also note that many respondents acknowledged multiple ancestries. These people were added to the "multiple origin" total for each origin listed. These include responses as varied as a respondent who listed eight different origins and a respondent who answered "French Canadian" (leading to him/her being counted once for "French" and once for "Canadian"). As with all self-reported data, understanding of the question may have varied from respondent to respondent.
Larger ethnic origins (200,000 or more individuals per group; 2016 census)
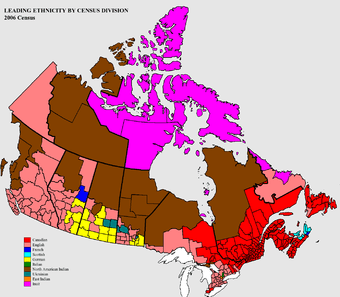
Canadian English French Scottish German |
Italian First Nations (Indigenous) Ukrainian Indian (originating from India) Inuit |

100,000+ |
50,000–99,999 |
20,000–49,999 |
10,000–19,999 |
| Ethnicity[3] | Combined responses[3] |
As single response[3] |
One of multiple responses[3] |
|---|---|---|---|
| Canadian[lower-alpha 1] | 11,135,965 | 6,436,940 | 4,699,030 |
| English | 6,320,085 | 1,098,930 | 5,221,150 |
| Scottish | 4,799,010 | 475,575 | 4,323,430 |
| French | 4,670,595 | 1,006,180 | 3,664,415 |
| Irish | 4,627,000 | 457,905 | 4,169,095 |
| German | 3,322,405 | 569,650 | 2,752,750 |
| Chinese | 1,769,195 | 1,439,980 | 329,215 |
| Italian | 1,587,970 | 695,420 | 892,550 |
| "First Nations"[lower-alpha 2] | 1,525,565 | 526,570 | 999,000 |
| Indian (from India) | 1,374,710 | 1,096,845 | 277,865 |
| Ukrainian | 1,359,655 | 273,810 | 1,085,845 |
| Dutch | 1,111,655 | 289,675 | 821,980 |
| Polish | 1,106,585 | 264,415 | 842,170 |
| Filipino | 837,130 | 651,390 | 185,740 |
| British Isles, not included elsewhere | 644,695 | 132,830 | 511,865 |
| Russian | 622,445 | 120,165 | 502,280 |
| Métis | 600,000 | 91,255 | 508,740 |
| Portuguese | 482,610 | 264,815 | 217,790 |
| Welsh | 474,805 | 25,190 | 449,615 |
| Norwegian | 463,275 | 35,905 | 427,370 |
| Spanish | 396,460 | 70,330 | 326,130 |
| American | 377,410 | 29,590 | 347,810 |
| Swedish | 349,640 | 21,775 | 327,870 |
| Hungarian (Magyar) | 348,085 | 83,400 | 264,685 |
| Jamaican | 309,485 | 161,495 | 147,995 |
| Greek | 271,405 | 141,580 | 129,830 |
| Vietnamese | 240,615 | 165,385 | 75,225 |
| Romanian | 238,050 | 96,910 | 141,145 |
| Lebanese | 219,555 | 130,590 | 88,965 |
| Pakistani | 215,555 | 156,300 | 59,255 |
| African, not included elsewhere | 212,005 | 76,790 | 135,210 |
| Iranian | 210,405 | 170,755 | 39,650 |
| Danish | 207,470 | 26,985 | 180,485 |
| Austrian | 207,050 | 20,225 | 186,820 |
Smaller ethnic origins (2016 census)
| Ethnicity[3] | Combined responses[3] |
As single response[3] |
One of multiple responses per respondent[3] |
|---|---|---|---|
| Korean | 198,210 | 177,920 | 20,285 |
| Québécois | 194,555 | 119,985 | 74,575 |
| Belgian | 186,665 | 31,765 | 154,89 |
| Haitian | 165,100 | 125,780 | 39,32 |
| Swiss | 155,120 | 25,235 | 129,885 |
| Sri Lankan | 152,590 | 114,120 | 38,475 |
| Jewish | 143,660 | 39,710 | 103,950 |
| Finnish | 143,645 | 25,875 | 117,765 |
| Croatian | 133,965 | 55,595 | 78,370 |
| Mexican | 128,480 | 54,300 | 74,180 |
| Japanese | 121,485 | 56,725 | 64,760 |
| Acadian | 119,670 | 22,980 | 96,690 |
| Punjabi, not included elsewhere | 118,400 | 71,535 | 46,860 |
| Arab, not included elsewhere | 111,405 | 73,330 | 38,070 |
| Czech | 104,585 | 23,250 | 81,330 |
| Moroccan | 103,945 | 72,625 | 31,320 |
| Icelandic | 101,795 | 8,630 | 93,165 |
| Egyptian | 99,140 | 62,910 | 36,230 |
| Serbian | 96,535 | 52,730 | 43,800 |
| Colombian | 96,325 | 69,040 | 27,285 |
| Guyanese | 84,275 | 30,825 | 53,445 |
| Afghan | 83,995 | 70,240 | 13,755 |
| Inuit | 79,130 | 44,760 | 34,37 |
| Trinidadian/Tobagonian | 78,965 | 23,900 | 55,065 |
| Syrian | 77,050 | 43,685 | 33,36 |
| South Asian, not included elsewhere | 76,400 | 55,445 | 20,955 |
| Slovak | 72,290 | 20,475 | 51,815 |
| Iraqi | 70,925 | 54,555 | 16,365 |
| West Indian | 70,275 | 30,260 | 40,010 |
| European, not included elsewhere | 67,895 | 33,360 | 34,53 |
| Algerian | 67,330 | 49,520 | 17,810 |
| Salvadorean | 66,215 | 40,510 | 25,705 |
| Turk | 63,955 | 29,885 | 34,070 |
| Armenian | 63,810 | 34,560 | 29,250 |
| Somali | 62,550 | 54,750 | 7,790 |
| Lithuanian | 59,285 | 11,185 | 48,095 |
| Scandinavian, not included elsewhere | 52,785 | 5,085 | 47,695 |
| Nigerian | 51,835 | 38,165 | 13,670 |
| Tamil not included elsewhere | 48,670 | 22,145 | 26,525 |
| Bangladeshi | 45,945 | 39,255 | 6,690 |
| Chilean | 45,190 | 18,685 | 26,510 |
| Palestinian | 44,820 | 25,195 | 19,630 |
| Ethiopian | 44,060 | 34,260 | 9,805 |
| Macedonian | 43,110 | 18,405 | 24,705 |
| Australian | 42,315 | 4,520 | 37,800 |
| Peruvian | 42,145 | 20,645 | 21,500 |
| Maltese | 41,915 | 12,820 | 29,100 |
| South African | 41,380 | 8,005 | 33,37 |
| Czechoslovakian, not otherwise specified | 40,715 | 5,075 | 35,640 |
| Slovenian | 40,470 | 13,690 | 26,78 |
| Cambodian | 38,490 | 21,445 | 17,045 |
| Yugoslav not included elsewhere | 38,480 | 8,570 | 29,91 |
| Congolese | 38,370 | 29,675 | 8,685 |
| Barbadian | 37,775 | 11,605 | 26,170 |
| Berber | 37,060 | 22,965 | 14,100 |
| Brazilian | 36,830 | 11,035 | 25,795 |
| Taiwanese | 36,515 | 23,260 | 13,250 |
| Albanian | 36,185 | 28,425 | 7,760 |
| Ghanaian | 35,495 | 26,535 | 8,960 |
| Bulgarian | 34,560 | 19,965 | 14,595 |
| Latvian | 30,725 | 7,040 | 23,685 |
| Black | 30,385 | 5,535 | 24,855 |
| Cuban | 29,065 | 10,040 | 19,030 |
| Israeli | 28,740 | 6,450 | 22,280 |
| Latin, Central or South American, not included elsewhere | 28,455 | 14,295 | 14,155 |
| Caribbean, not included elsewhere | 26,830 | 8,930 | 17,900 |
| Bosnian | 26,740 | 15,610 | 11,125 |
| Venezuelan | 26,345 | 10,305 | 16,040 |
| Guatemalan | 26,270 | 13,905 | 12,370 |
| Tunisian | 25,650 | 17,620 | 8,030 |
| Ecuadorian | 25,410 | 13,925 | 11,485 |
| West Asian, not included elsewhere | 25,285 | 13,430 | 11,855 |
| Eritrean | 25,255 | 20,625 | 4,630 |
| Cameroonian | 24,615 | 20,605 | 4,010 |
| Laotian | 24,580 | 13,375 | 11,205 |
| Estonian | 24,530 | 6,155 | 18,375 |
| Dominican | 23,130 | 9,930 | 13,200 |
| Bengali | 22,905 | 18,435 | 4,470 |
| Asian, not otherwise specified | 22,740 | 15,760 | 6,980 |
| Aboriginal from Central/South America | 22,720 | 2,080 | 20,645 |
| Newfoundlander | 22,215 | 4,895 | 17,325 |
| Indonesian | 21,395 | 4,775 | 16,615 |
| Byelorussian | 20,710 | 5,125 | 15,585 |
| Argentinian | 20,680 | 4,165 | 16,510 |
| Eastern European, not included elsewhere | 20,420 | 5,875 | 14,545 |
| Sudanese | 19,960 | 15,250 | 4,710 |
| Fijian | 19,370 | 8,270 | 11,105 |
| Thai | 19,005 | 7,740 | 11,265 |
| Grenadian | 17,915 | 7,515 | 10,400 |
| Vincentian/Grenadinian | 17,425 | 7,245 | 10,180 |
| East African | 17,305 | 7,220 | 10,085 |
| Nepali | 17,135 | 13,695 | 3,440 |
| Malaysian | 16,920 | 2,555 | 14,365 |
| Kurd | 16,320 | 10,470 | 5,845 |
| New Zealander | 15,395 | 1,300 | 14,095 |
| Central and West African origins, not included elsewhere | 15,380 | 7,800 | 7,585 |
| Moldovan | 14,915 | 7,415 | 7,505 |
| Jordanian | 14,250 | 7,955 | 6,295 |
| Assyrian | 13,830 | 8,870 | 4,960 |
| Nicaraguan | 13,705 | 6,360 | 7,350 |
| Breton | 11,845 | 3,230 | 8,615 |
| Flemish | 11,685 | 1,485 | 10,200 |
| Hispanic | 11,050 | 5,660 | 5,395 |
| Burundian | 10,990 | 8,965 | 2,025 |
| Ivoirean | 10,935 | 7,795 | 3,140 |
| Kenyan | 10,915 | 5,445 | 5,465 |
| Rwandan | 10,775 | 8,080 | 2,690 |
| Honduran | 10,650 | 5,325 | 5,325 |
| Senegalese | 10,175 | 6,490 | 3,685 |
| Yoruba | 9,585 | 6,870 | 2,715 |
| Burmese | 9,335 | 4,660 | 4,675 |
| Mauritian | 9,325 | 3,520 | 5,805 |
| St. Lucian | 8,985 | 4,040 | 4,945 |
| Gujarati | 8,350 | 5,290 | 3,060 |
| Zimbabwean | 8,090 | 4,945 | 3,140 |
| Tibetan | 8,040 | 7,015 | 1,030 |
| Libyan | 7,745 | 5,755 | 1,985 |
| Mongolian | 7,480 | 2,555 | 4,925 |
| Sinhalese | 7,285 | 4,355 | 2,930 |
| Guinean | 7,240 | 4,705 | 2,540 |
| Basque | 6,970 | 715 | 6,250 |
| Sicilian | 6,940 | 1,345 | 5,600 |
| Saudi Arabian | 6,810 | 4,200 | 2,615 |
| Uruguayan | 6,795 | 1,810 | 4,985 |
| Yemeni | 6,640 | 2,940 | 3,700 |
| East or Southeast Asian, not included elsewhere | 6,505 | 4,235 | 2,270 |
| Azerbaijani | 6,425 | 2,280 | 4,145 |
| Maya | 6,290 | 1,180 | 5,105 |
| Manx | 6,125 | 285 | 5,845 |
| North African, not included elsewhere | 6,115 | 2,905 | 3,210 |
| Goan | 6,070 | 2,040 | 4,030 |
| Ugandan | 5,705 | 3,245 | 2,460 |
| Cypriot | 5,650 | 1,265 | 4,385 |
| Costa Rican | 5,535 | 2,140 | 3,395 |
| Igbo | 5,320 | 3,475 | 1,845 |
| Togolese | 5,300 | 3,095 | 2,205 |
| Bolivian | 5,055 | 1,890 | 3,160 |
| Beninese | 4,990 | 2,650 | 2,340 |
| Slavic, not otherwise specified | 4,870 | 1,470 | 3,400 |
| Tatar | 4,825 | 880 | 3,940 |
| Pashtun | 4,810 | 2,245 | 2,565 |
| Georgian | 4,775 | 1,900 | 2,875 |
| Tanzanian | 4,710 | 1,835 | 2,875 |
| Panamanian | 4,700 | 1,090 | 3,610 |
| Roma (Gypsy) | 4,630 | 745 | 3,895 |
| Frisian | 4,590 | 795 | 3,790 |
| Karen | 4,515 | 3,835 | 680 |
| Antiguan | 4,505 | 1,275 | 3,225 |
| Malagasy | 4,500 | 2,155 | 2,345 |
| Malian | 4,485 | 2,310 | 2,180 |
| Paraguayan | 4,325 | 670 | 3,660 |
| Montenegrin | 4,165 | 915 | 3,245 |
| Bantu, not otherwise specified | 3,965 | 2,315 | 1,645 |
| Uzbek | 3,920 | 1,730 | 2,190 |
| Luxembourger | 3,915 | 440 | 3,475 |
| Bahamian | 3,670 | 810 | 2,860 |
| Bhutanese | 3,600 | 2,440 | 1,160 |
| Channel Islander | 3,590 | 435 | 3,155 |
| Coptic | 3,535 | 1,490 | 2,040 |
| Puerto Rican | 3,410 | 445 | 2,960 |
| Western European origins, not included elsewhere | 3,370 | 840 | 2,530 |
| Oromo | 3,355 | 2,410 | 945 |
| Kazakh | 3,325 | 1,465 | 1,860 |
| Hawaiian | 3,295 | 120 | 3,175 |
| Burkinabe | 3,155 | 1,980 | 1,165 |
| Kashmiri | 3,115 | 1,095 | 2,020 |
| Bermudan | 3,075 | 310 | 2,765 |
| Carib | 3,035 | 130 | 2,905 |
| Angolan | 2,955 | 1,140 | 1,820 |
| Kittitian/Nevisian | 2,920 | 750 | 2,165 |
| Tajik | 2,910 | 1,240 | 1,665 |
| Kosovar | 2,870 | 1,710 | 1,160 |
| Singaporean | 2,850 | 495 | 2,355 |
| Alsatian | 2,800 | 375 | 2,425 |
| Sierra Leonean | 2,620 | 1,580 | 1,040 |
| Maori | 2,500 | 155 | 2,345 |
| Liberian | 2,485 | 1,520 | 965 |
| Peulh | 2,440 | 1,425 | 1,015 |
| Pacific Islands origins, not included elsewhere | 2,335 | 470 | 1,865 |
| Kuwaiti | 2,235 | 1,080 | 1,155 |
| Southern European origins, not included elsewhere | 2,165 | 440 | 1,730 |
| Tigrian | 2,155 | 1,340 | 810 |
| Martinican | 2,005 | 370 | 1,635 |
| Cornish | 1,970 | 120 | 1,855 |
| Akan | 1,955 | 1,235 | 720 |
| Edo | 1,945 | 1,180 | 765 |
| Other North American origins, not included elsewhere | 1,895 | 655 | 1,240 |
| Afrikaner | 1,870 | 280 | 1,595 |
| Zambian | 1,865 | 1,055 | 805 |
| Chadian | 1,845 | 1,185 | 655 |
| Belizean | 1,755 | 250 | 1,505 |
| Corsican | 1,750 | 165 | 1,590 |
| Djiboutian | 1,710 | 980 | 730 |
| Ashanti | 1,585 | 765 | 825 |
| Uighur | 1,555 | 1,010 | 540 |
| Amhara | 1,530 | 710 | 820 |
| Samoan | 1,530 | 150 | 1,375 |
| Hazara | 1,515 | 585 | 930 |
| Arawak | 1,440 | 55 | 1,385 |
| Gabonese | 1,405 | 595 | 820 |
| Seychellois | 1,285 | 575 | 710 |
| Catalan | 1,275 | 200 | 1,075 |
| Maure | 1,190 | 400 | 790 |
| Guadeloupean | 1,130 | 245 | 885 |
| Malinké | 1,120 | 675 | 455 |
| Polynesian, not otherwise specified | 1,105 | 90 | 1,015 |
| Kyrgyz | 1,060 | 580 | 475 |
| Turkmen | 1,040 | 390 | 655 |
| Gambian | 975 | 580 | 395 |
| Zulu | 945 | 285 | 660 |
| Bavarian | 940 | 50 | 890 |
| Montserratan | 935 | 190 | 745 |
| Dinka | 900 | 585 | 320 |
| Ewe | 845 | 320 | 525 |
| Wolof | 835 | 465 | 375 |
| Hmong | 810 | 585 | 220 |
| Harari | 660 | 395 | 265 |
See also
Notes
- ↑ All citizens of Canada are classified as "Canadians" as defined by Canada's nationality laws. However, "Canadian" as an ethnic group has since 1996 been added to census questionnaires for possible ancestry. "Canadian" was included as an example on the English
questionnaire and "Canadien" as an example on the French questionnaire. "The majority of respondents to this selection are from the eastern part of the country that was first settled. Respondents generally are visibly European (Anglophones and Francophones), however no-longer self identify with their ethnic ancestral origins. This response is attributed to a multitude or generational distance from ancestral lineage.
Source 1: Jack Jedwab (April 2008). "Our 'Cense' of Self: the 2006 Census saw 1.6 million 'Canadian'" (PDF). Association for Canadian Studies. Retrieved March 7, 2011.
Source 2: Don Kerr (2007). The Changing Face of Canada: Essential Readings in Population. Canadian Scholars' Press. pp. 313–317. ISBN 978-1-55130-322-2. - ↑ The category "North American Indian" includes respondents who indicated that their ethnic origins were from a Canadian First Nation, or another non-Canadian North American aboriginal group (excluding Inuit and Métis).
Source: "How Statistics Canada Identifies Aboriginal Peoples". Statistics Canada. Retrieved January 16, 2011.
References
- ↑ Source: "Ethnocultural Portrait of Canada – Data table". Statistics Canada. Retrieved 2011-01-16. Additional data: "2006 Census release topics". Statistics Canada. Retrieved 2011-01-16.
- ↑ "Population and growth components (1851–2001 Censuses)". Statistics Canada. 2010. Retrieved 2011-01-19.
- 1 2 3 4 5 6 7 8 "Immigration and Ethnocultural Diversity Highlight Tables". statcan.gc.ca.
Further reading
- Bumsted, J. M (2003). Canada's diverse peoples: a reference sourcebook. Library of Congress (ABC-CLIO). ISBN 1-57607-672-5.
- Magocsi, Paul R (1999). Encyclopedia of Canada's peoples. Society of Ontario, University of Toronto Press. ISBN 0-8020-2938-8.
External links
| Wikimedia Commons has media related to Ethnic groups in Canada. |
- Canada Year Book 2010 – Statistics Canada