Crime in Canada
| Canada | |
|---|---|
| Crime rates* (2016) | |
| Violent Criminal Code violations | |
| Homicide | 1.68 |
| Attempted murder | 2.14 |
| Sexual assault | 57.91 |
| Assault | 607.17 |
| Robbery | 60.09 |
| Criminal harassment | 51.88 |
| Uttering threats | 166.59 |
| Total violent crime violations | 1051.62 |
| Property crime violations | |
| Breaking and entering | 438.51 |
| Theft of motor vehicle | 216.91 |
| Theft over $5,000 | 42.48 |
| Theft under $5,000 | 1365.91 |
| Mischief | 717.44 |
| Total property crime violations | 3206.84 |
|
Notes *Number of reported crimes per 100,000 population. Census population: 35,151,728[1] Source: Crimes, by type of violation, and by province and territory (Quebec, Ontario) | |
Under the Canadian constitution, the power to establish criminal law and rules of investigation is vested in the federal Parliament. The provinces share responsibility for law enforcement (although provincial policing in many jurisdictions is contracted to the federal Royal Canadian Mounted Police), and while the power to prosecute criminal offences is assigned to the federal government, responsibility for prosecutions is delegated to the provinces for most types of criminal offences. Laws and sentencing guidelines are uniform throughout the country, but provinces vary in their level of enforcement.
Crime since the 1980s
Canada's growing multi-ethnic society in the 1980s introduced new organized crime groups that competed with the Mafia, marking a growth in crimes such as drug trafficking, gambling, loansharking, migrant smuggling, cigarette smuggling, liquor smuggling and prostitution. The Rizzuto-Caruana-Cuntrera Italian Mafia families lost ground in cocaine and heroin smuggling to Iranian and Chinese gangs, Colombian cartels and outlaw biker gangs starting in the mid-1970s. Chinese gangs smuggled heroin through airports in the 1970s and shifted toward cargo containers entering Vancouver around 1985. By 2001, the RCMP estimated up to 15 metric tons of cocaine reaching Canada annually.
Illegal immigrants from Asia to the US frequently enter through Canada and lower criminal penalties tended to favor drug smuggling. In particular, Canada did not criminalize the possession of precursor chemicals for drugs like methamphetamine. After the 1970s, synthetic drugs overtook liquor as the main item smuggled into the US and by the 1990s Canada supplied large amounts of high-grade marijuana, ecstasy and methamphetamine. Quebec mobsters, relocated to Florida, maintained two large pill making operations in Quebec from 1981 to 1986, shipping 13.5 million methaqualone tablets to the US. By the early 2000s, Canada was a net exporter of marijuana to US, although comprised only one-fifth the amount coming from Mexico. A pound valued at $2000 in Vancouver would sell for as much as $6000 in California.
Gerald Matticks, a major leader in the Irish West End Gang in Quebec was suspected by police as the smuggler behind two large hashish shipments captured in 2000, but an investigation of the Quebec Hells Angels uncovered his name in documents. Spreadsheets indicated that the Hells Angels owed $7 million to Matticks for cocaine and hashish, leading to his arrest and conviction.
Legalized gambling shrank the illegal gambling market in Canada after the 1970s. However, a 1996 report found that illegal gambling in Ontario was a $10 billion industry and in 1999 the Illegal Gaming Enforcement Unit was created by the province, bringing 941 gambling charges against 623 people. Video lottery machines are often used illegally by the Italian mafia, Chinese and Russian gangs, as well as the Hells Angels. As many as 25,000 machines were believed to be distributed in Southern Ontario in 1996.
Tobacco smuggling grew rapidly after the Canadian government increased the excise tax on cigarettes 140 percent. By 1993, there were as many as 100 million contraband cartons circulating in the country. However, the government did not impose penalties on cigarettes for export and many exported cigarettes were brought back into the country. A joint sting operation netted Larry Miller, who had earned $687 million between 1992 and 1996, enough to afford a Learjet to go between Las Vegas and Massena, New York, where cigarettes were smuggled through the Akwasasne reservation—which because of its cross-border nature, lacked border security. The Mohawk Warrior Society, famous for the 1990 Oka standoff had launched into tobacco and migrant smuggling beginning around 1988. Due to smuggling, the government lowered cigarette taxes in 1994. However, high liquor duties—at 80 percent of the price, rather than 40 in the US—led to significant liquor smuggling.
Smuggling demands drove corruption among baggage handlers at Toronto Pearson airport, prompting an audit of 131,000 airport workers after 4500 were found to have ties to bikers gangs and organized crime, in 2004.
After 1983, migrant smuggling increased rapidly. Cheng Chui Ping, a Chinese grandmother from Fujian province orchestrated a major "Snakehead" smuggler gang, transporting thousands of people in the 1990s. Between 1994 and 2003, 15,000 Chinese people entered Canada illegally. In March, 2000 the RCMP infiltrated a large prostitution ring that had smuggled in 280 Korean women to work as forced laborers in massage parlors. The federal government in 1998 opted to exempt exotic dancers from restrictions on working in Canada, helping to drive prostitution. [2]
Statistics Canada data
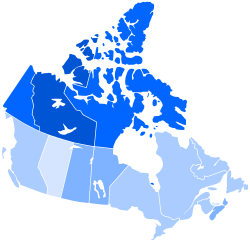
The province with the lowest crime rate in 2006 for the third straight year was Ontario with 5,689 per 100,000, followed by Quebec with 5,909 per 100,000. The province with the highest crime rate for the 9th straight year was Saskatchewan with 13,711 per 100,000. Regina is the city with the highest crime rate followed by its provincial counterpart Saskatoon. Quebec City, Trois-Rivières, and Saguenay have the lowest crime rates of any city and are all located in Quebec.[3] Winnipeg has had the highest violent crime rate since 2009 and still held it in 2012. For years native Canadian women have been victims of sexual assault and murder disproportionately often and there have been complaints that the police paid insufficient attention to the problem.[4] The three northern territories have higher per capita crime rates than any province. As evidenced by the crime map above right, Saskatchewan has a higher crime rate than the other Canadian provinces, but lower than the territories.
The number of murders dropped to 594 in 2007, 12 fewer than the previous year. One-third of the 2007 murders were stabbings and another third were by firearm. In 2007, there were 190 stabbings and 188 shootings. Handguns were used in two-thirds of all firearm murders. Seventy-four youths were accused of murder, down 11 from the previous year. About eighty-four percent of murders were done by someone known to the victim. Male victims of homicide were most likely to be killed by an acquaintance, someone known to them through a criminal relationship, or a stranger. Female victims of homicide were most frequently killed by a current or former intimate partner, or another family member. The province with the highest crime rate was Manitoba while the lowest crime rates occurred in Prince Edward Island and Newfoundland and Labrador.
Police reported criminal violence is thought to be an undercount of actual violence rates. Thus, approximately every five years, Statistics Canada conducts a survey of victimization in Canada. The last General Social Survey conducted was in 2004, where 24,000 people were contacted by telephone: 106 reported incidents of violence per 1,000 polled, which is slightly lower than in 1999 when it was 111 per 1,000 polled.[5]
Crime by region
Murder capitals since 1981
Winnipeg has been the "Murder Capital" of Canada 20 times since homicide rates have been available in 1981, far exceeding any other provincial city.
| Canada's Murder Capital List[6][7] | ||||
|---|---|---|---|---|
| City not including YT, NT or NU | Number of Times the "Murder Capital" | |||
| Winnipeg | 20 | |||
| Ottawa | 8 | |||
| Montreal | 3 | |||
| Edmonton | 2 | |||
| Vancouver | 2 | |||
| Calgary | 1 | |||
Violent crime severity index by CMA
| CMAs in Canada – Violent Crime Severity Index, by year[8][9][10][11][12][13][14][15] | ||||||||
|---|---|---|---|---|---|---|---|---|
| City | 2016 | 2015 | 2014 | 2013 | 2012 | 2011 | 2010 | 2009 |
| Abbotsford–Mission | 82.3 | 90.4 | 81.1 | 70.7 | 79.7 | 72.4 | 89.8 | 118.8 |
| Barrie | 46.3 | 43.8 | 42.3 | 38.6 | 46.1 | 49.2 | 50.1 | 53.9 |
| Brantford | 88.4 | 70.0 | 73.5 | 73.9 | 67.6 | 84.5 | 92.5 | 91.5 |
| Calgary | 61.3 | 72.1 | 63.0 | 62.0 | 61.2 | 72.1 | 82.1 | 84.8 |
| Edmonton | 102.5 | 103.9 | 93.3 | 89.7 | 95.8 | 105.9 | 106 | 118.7 |
| Gatineau | 63.8 | 55.9 | 57.5 | 65.1 | 71.4 | 68.1 | 59.7 | 74.5 |
| Greater Sudbury | 61.4 | 63.9 | 62.9 | 66.3 | 75.4 | 78.7 | 85 | 98.1 |
| Guelph | 49.1 | 47.3 | 44.1 | 42.5 | 53.8 | 48.2 | 44.5 | 49.2 |
| Halifax | 77.3 | 79.0 | 73.6 | 84.8 | 92.4 | 111.7 | 105.6 | 120.0 |
| Hamilton | 66.0 | 54.6 | 55.0 | 59.9 | 62.5 | 75.8 | 80.9 | 84.3 |
| Kelowna | 62.7 | 69.8 | 60.4 | 67.1 | 81.8 | 86.0 | 95.9 | 104.3 |
| Kingston | 38.5 | 54.5 | 44.3 | 48.6 | 53.7 | 48.1 | 54.5 | 71.9 |
| Kitchener–Cambridge–Waterloo | 60.1 | 54.5 | 51.1 | 57.0 | 60.9 | 69.5 | 69.8 | 65.1 |
| London | 59.4 | 56.7 | 49.0 | 56.9 | 64.1 | 70.5 | 74.3 | 69.9 |
| Moncton | 79.3 | 75.6 | 74.5 | 66.5 | 73.4 | 68.2 | 72.4 | 79.4 |
| Montréal | 73.1 | 76.1 | 72.5 | 79.5 | 87.8 | 97.7 | 98.3 | 102.7 |
| Ottawa | 62.1 | 53.7 | 49.6 | 56.1 | 58.2 | 63.9 | 67.5 | 78.1 |
| Peterborough | 68.9 | 56.9 | 51.7 | 57.7 | 66.2 | 60.2 | 65.8 | 59.5 |
| Québec | 51.5 | 43.1 | 47.5 | 48.3 | 50.8 | 48.6 | 51.3 | 50.9 |
| Regina | 124.1 | 107.9 | 103.8 | 105.8 | 110.1 | 123.5 | 151.2 | 155.6 |
| Saguenay | 67.7 | 61.3 | 58.2 | 57.2 | 79.4 | 55.2 | 59.2 | 72.8 |
| Saint John | 63.8 | 65.7 | 61.6 | 59.5 | 68.0 | 91.3 | 96.4 | 100.3 |
| Saskatoon | 114.0 | 113.5 | 122.6 | 109.9 | 126.4 | 134.5 | 155.7 | 154.7 |
| Sherbrooke | 55.6 | 44.1 | 51.6 | 45.3 | 49.7 | 49.3 | N/A | 54.2 |
| St. Catharines–Niagara | 37.6 | 42.2 | 40.9 | 49.3 | 54.1 | 48.0 | 56.9 | 63.5 |
| St. John's | 88.9 | 79.6 | 69.5 | 79.5 | 77.3 | 74.7 | 90.1 | 69.3 |
| Thunder Bay | 125.6 | 119.2 | 138.5 | 110.9 | 118.8 | 128.7 | 138.5 | 136.1 |
| Toronto | 70.4 | 64.6 | 63.5 | 68.2 | 78.4 | 84.7 | 88.4 | 94.5 |
| Trois-Rivières | 46.2 | 59.9 | 57.3 | 51.4 | 46.4 | 46.2 | 44.4 | 56.0 |
| Vancouver | 72.8 | 85.0 | 78.2 | 83.6 | 92.6 | 98.3 | 108.2 | 117.8 |
| Victoria | 56.8 | 69.1 | 58.4 | 54.4 | 63.7 | 70.9 | 81.3 | 81.0 |
| Windsor | 58.1 | 67.7 | 57.0 | 61.9 | 66.4 | 59.8 | 65.1 | 74.6 |
| Winnipeg | 149.6 | 122.1 | 116.1 | 119.9 | 145.4 | 173.8 | 163.9 | 187.0 |
| Canada | 75.3 | 74.5 | 70.2 | 73.7 | 81.4 | 85.3 | 88.9 | 93.7 |
Crime statistics by province and territory
Crime statistics vary considerably through different parts of Canada. In general, the eastern provinces have the lowest violent crime rates while the western provinces have higher rates and the territories higher still. Of the provinces, Manitoba and Saskatchewan have the highest violent crime rates. The chart below also shows that Saskatchewan has the highest provincial assault rate, and that Manitoba has the highest provincial sexual assault rate, robbery rate and homicide rate of any Canadian province. In many instances the crime rates in the Yukon, North West Territories and Nunavut are the highest in the country and can be up to ten times the national average.
2016 crime statistics for the provinces and territories are given below, as reported by Statistics Canada.[16]
| Crime Rates (per 100,000 residents) by Canadian Provinces & Territories[16] | |||||||||||||||||
|---|---|---|---|---|---|---|---|---|---|---|---|---|---|---|---|---|---|
| Province/Territory | Canada | NL | PE | NS | NB | QC | ON | MB | SK | AB | BC | YT | NT | NU | |||
| Total of all violations | 5904.54 | 6478.06 | 4949.24 | 5540.17 | 5291.89 | 4067.02 | 4031.72 | 9446.88 | 13305.3 | 8801.19 | 8674.51 | 24319.85 | 43457.24 | 35790.95 | |||
| Violent Criminal Code violations (total) | 1051.62 | 1327.42 | 785.74 | 1153.45 | 1176.56 | 950.41 | 789.81 | 1938.05 | 2027.58 | 1243.53 | 1139.34 | 4147.55 | 7836.92 | 8152.2 | |||
| Homicide | 1.68 | 1.32 | 0 | 1.37 | 1.45 | 0.8 | 1.47 | 3.19 | 4.69 | 2.73 | 1.83 | 10.67 | 6.75 | 2.7 | |||
| Attempted murder | 2.14 | 1.32 | 0 | 2.74 | 0.92 | 2.29 | 1.86 | 3.26 | 5.74 | 1.25 | 2.4 | 2.67 | 0 | 24.27 | |||
| Sexual assault (not including against children) | 57.91 | 58.85 | 47.09 | 65.93 | 48.63 | 49.19 | 53.39 | 108.57 | 103.94 | 63.45 | 50.17 | 200.05 | 310.33 | 418 | |||
| Sexual violations against children | 19.06 | 23.39 | 22.2 | 22.12 | 22.99 | 23.11 | 13.92 | 36.34 | 32.42 | 17.61 | 15.59 | 58.68 | 85.45 | 277.76 | |||
| Assault (not including against a peace officer) | 574.05 | 693.61 | 399.6 | 561.56 | 623.16 | 483.88 | 421.06 | 1210.5 | 1289.38 | 721.63 | 589.2 | 2627.23 | 5313.81 | 5361.1 | |||
| Assaults against a peace officer | 27.47 | 25.47 | 6.73 | 34.54 | 30.79 | 30.42 | 18.69 | 62.13 | 49.89 | 30.9 | 26.05 | 85.35 | 139.42 | 204.95 | |||
| Discharge firearm with intent | 2.98 | 3.58 | 0.67 | 1.37 | 1.98 | 1.27 | 3.4 | 5.23 | 6.87 | 4.56 | 1.85 | 0 | 15.74 | 35.06 | |||
| Robbery | 60.05 | 42.07 | 12.11 | 28.44 | 29.86 | 44.45 | 59.01 | 156.21 | 85.87 | 71.41 | 62.17 | 58.68 | 69.71 | 26.97 | |||
| Forcible confinement or kidnapping | 10.43 | 6.98 | 2.69 | 10.64 | 4.89 | 16.69 | 7.16 | 10.92 | 13.3 | 12.51 | 7.01 | 21.34 | 47.22 | 59.33 | |||
| Extortion | 8.28 | 7.36 | 2.69 | 6.64 | 4.23 | 13.7 | 5.7 | 3.34 | 5.21 | 6.47 | 11.32 | 5.33 | 13.49 | 5.39 | |||
| Criminal harassment | 51.88 | 67.53 | 52.47 | 45.81 | 69.37 | 61.9 | 54.98 | 16.77 | 48.58 | 46.04 | 34.87 | 117.36 | 175.4 | 188.77 | |||
| Uttering threats | 166.59 | 329.73 | 151.36 | 242.65 | 257.01 | 180.2 | 104.06 | 246.26 | 266.72 | 179.38 | 200.31 | 701.48 | 1216.58 | 1092.17 | |||
| Indecent/Harassing communications | 41.96 | 45.08 | 78.04 | 102.79 | 59.33 | 8.56 | 21.81 | 44.38 | 68.31 | 58.29 | 115.1 | 181.37 | 353.05 | 374.84 | |||
| Other violent violations | 27.14 | 21.13 | 10.09 | 26.85 | 21.95 | 33.95 | 23.3 | 30.95 | 46.66 | 27.3 | 21.47 | 77.34 | 89.97 | 80.89 | |||
| Property crime violations (total) | 3206.84 | 3375.41 | 2916.94 | 2843.18 | 2696.16 | 1854.28 | 2286.89 | 5093.28 | 6553.36 | 5205.65 | 5001.44 | 9225.97 | 20661.58 | 15171.78 | |||
| Breaking and entering | 438.51 | 509.69 | 255.64 | 307.21 | 429.98 | 371.75 | 285.55 | 727.7 | 886.9 | 658.12 | 628.02 | 672.14 | 1014.19 | 1766.36 | |||
| Theft of motor vehicle | 216.91 | 92.81 | 59.87 | 96.05 | 124.34 | 143.24 | 123.17 | 313.1 | 492.16 | 536.13 | 294.76 | 469.43 | 526.21 | 323.61 | |||
| Theft over $5000 (non-motor vehicle) | 42.48 | 43.76 | 22.87 | 24.75 | 30.13 | 35.55 | 32.46 | 34.82 | 54.93 | 76.3 | 58.82 | 72.02 | 40.48 | 29.66 | |||
| Theft under $5000 (non-motor vehicle) | 1365.91 | 1004.1 | 1276.83 | 1221.06 | 1057.64 | 705.84 | 1108.64 | 1437.72 | 1882.97 | 2112.83 | 2578.37 | 2440.52 | 1931.68 | 725.42 | |||
| Fraud | 299.05 | 269.37 | 390.85 | 296.68 | 235.6 | 181.01 | 292.48 | 268.79 | 564.04 | 428.2 | 364.13 | 472.1 | 301.33 | 210.34 | |||
| Identity theft and identity fraud | 46.92 | 11.51 | 21.53 | 15.8 | 24.45 | 58.42 | 34.78 | 26.94 | 51.71 | 63.27 | 67.66 | 13.34 | 11.25 | 5.4 | |||
| Mischief | 717.44 | 1407.58 | 836.2 | 771.35 | 718.44 | 314.94 | 372.62 | 2157.98 | 2402.59 | 1112.89 | 913.18 | 4979.73 | 16697.02 | 11970.77 | |||
| Other property crime violations | 79.62 | 36.59 | 53.15 | 110.28 | 75.58 | 43.53 | 37.19 | 126.23 | 218.06 | 217.91 | 96.5 | 106.69 | 139.42 | 140.22 | |||
| Other Criminal Code violations (total) | 965.39 | 1221.59 | 619.58 | 882.25 | 823.62 | 442.21 | 531.65 | 1775.32 | 3164.78 | 1610.56 | 1597.37 | 9169.96 | 12089.32 | 11088.94 | |||
| Child pornography (including making and distributing) | 17.21 | 16.41 | 16.14 | 21.49 | 14.27 | 9.7 | 10.63 | 16.31 | 14.78 | 8.63 | 58 | 18.67 | 20.24 | 8.09 | |||
| Disturb the peace | 268.84 | 438.38 | 264.38 | 158.4 | 189.88 | 6.41 | 39.65 | 671.71 | 551.44 | 437.16 | 901.29 | 6244 | 8632.98 | 8146.81 | |||
| Administration of justice violations | 560.17 | 617.4 | 232.76 | 553.13 | 457.07 | 362.98 | 407.83 | 903.86 | 2294.91 | 980.56 | 432.32 | 2544.54 | 2797.45 | 2491.77 | |||
| Other Criminal Code violations (all other violations) | 119.17 | 149.4 | 106.3 | 149.23 | 162.4 | 63.12 | 73.54 | 183.44 | 303.65 | 184.21 | 205.76 | 362.75 | 638.65} | 442.27 | |||
| Criminal Code traffic violations (total) | 341.53 | 325.2 | 397.58 | 326.07 | 300.09 | 480.02 | 201.4 | 324.7 | 811.12 | 407.11 | 330.18 | 1165.58 | 1738.29 | 790.14 | |||
| Impaired driving | 194.31 | 259.56 | 328.29 | 263.4 | 221.46 | 180.46 | 105.59 | 257.26 | 554.22 | 286.65 | 240.99 | 976.21 | 1490.93 | 644.52 | |||
| Other Criminal Code traffic violations | 147.22 | 65.64 | 69.29 | 62.67 | 78.63 | 299.56 | 95.81 | 67.44 | 256.9 | 120.46 | 89.19 | 189.37 | 247.36 | 145.62 | |||
| Federal Statute violations (total) | 339.16 | 228.44 | 229.4 | 335.23 | 295.46 | 340.1 | 221.97 | 315.52 | 748.46 | 334.34 | 606.17 | 610.8 | 1131.13 | 587.89 | |||
| Drug violations (total) | 262.96 | 185.24 | 187.69 | 287.62 | 221.6 | 293.93 | 179.63 | 206.35 | 300.36 | 275.63 | 452.63 | 450.76 | 859.03 | 544.74 | |||
Police
In 2005, there were 61,050 police officers in Canada which equates to one police officer per 528.6 persons, but with significant regional variations.[18] Newfoundland and Labrador and Prince Edward Island have the fewest police per capita with 664.9 and 648.4 persons per police officer, respectively. Conversely, the highest ratio of police to population is found in Canada's northern territories; Nunavut has 247.9 persons per police officer, the Northwest Territories has 248.5 persons per officer and the Yukon has 258.2 persons for each police officer.[19]
That is a substantially lower rate than most developed countries with only Japan and Sweden having so few police officers. The United States has one officer per 411.5 persons, and Germany 344.8.
Canada's national police force is the Royal Canadian Mounted Police (RCMP) which is the main police force in Canada's north, and in rural areas except in Quebec, Ontario, and Newfoundland. Those three provinces have their own provincial police forces, although the RCMP still operate throughout rural Newfoundland and also provide specific federal policing services in Ontario and Quebec. Many cities and districts have their own municipal police forces, while others have contracts with the provincial police or RCMP to police their communities.
Report rates of crimes
A publication posted on Statistics Canada reported that in 2009, only a small portion of crimes that happen are reported to the police (31% of all crimes), and this figure has been lowering from 1999 (37%) and 2004 (34%).[20] Only 54% of break and enters, 43% of robberies, and 34% of assaults are reported to the police.[21] The most common reason for not reporting a crime was the victim thought it was not important enough (68%). Other common reasons include; they think the police cannot do anything about it (59%), or they dealt with it another way (42%). Multiple reasons are given so the percentages do not sum to 100%.
| Unreported Crime in Canada (2009)[21] | ||||||||||||
|---|---|---|---|---|---|---|---|---|---|---|---|---|
| Reason for not reporting crime | % of people gave this reason | |||||||||||
| Not important enough | 68% | |||||||||||
| Police could not do anything about it | 59% | |||||||||||
| Dealt with another way | 42% | |||||||||||
| Incident was a personal matter | 36% | |||||||||||
| Didn't want to get the police involved | 35% | |||||||||||
| Police wouldn't help | 22% | |||||||||||
| Insurance wouldn't cover it | 15% | |||||||||||
| No confidence in criminal justice system | 14% | |||||||||||
| No items taken/recovered | 14% | |||||||||||
| Police would be biased | 9% | |||||||||||
| Fear of revenge by the offender | 7% | |||||||||||
| Fear of publicity/news coverage | 5% | |||||||||||
Punishment
Canada abolished the death penalty for murder in 1976,[22] instituting a mandatory sentence of life imprisonment for murder.
In 2001, Canada had about 32,000 people in prison or about 0.13% of the total population. Globally, the United States was the country with the highest percentage of inmate population (about 0.7% of the total population). The European average is 0.2% of the total population, with France and Germany having lower rates than Canada, but with the United Kingdom, Spain and most of Eastern Europe having higher ones.
Comparisons
Comparing crime rates between countries is difficult due to the differences in jurisprudence, reporting and crime classifications. National crime statistics are in reality statistics of only selected crime types. Data are collected through various surveying methods that have previously ranged between 15% and 100% coverage of the data. A 2001 Statistics Canada study concluded that comparisons with the U.S. on homicide rates were the most reliable. Comparison of rates for six lesser incident crimes was considered possible but subject to more difficulty of interpretation. For example, types of assaults receive different classifications and laws in Canada and the U.S., making comparisons more difficult than homicides. At the time, the U.S. crime of aggravated assault could be compared to the sum of three Canadian crimes (aggravated assault, assault with a weapon, and attempted murder). This comparison had a predicted bias that would inflate the Canadian numbers by only 0.1%. The study also concluded that directly comparing the two countries' reported total crime rate (i.e. total selected crimes) was "inappropriate" since the totals include the problem data sets as well as the usable sets.[23] For reasons like these, homicides have been favored in international studies looking for predictors of crime rates (predictors like economic inequality).
| Crime Comparison Between Selected Countries (Reported crimes per 100 000 population) | ||||||||||||
|---|---|---|---|---|---|---|---|---|---|---|---|---|
| Country | Homicide | Robbery | Sexual Assault | Statistics Year | ||||||||
| Canada | 1.6 | 79.4 | 62.9 | 2012[24] | ||||||||
| Australia | 1.3 | 63.3 | 80.1 | 2011[25][26] | ||||||||
| England and Wales | 1.0 | 119.3 | 78.2 | 2012[27][28][29] | ||||||||
| Ireland | 1.0 | 61.1 | 39.7 | 2011[30][31] | ||||||||
| New Zealand | 0.9 | 47.1 | 76.5 | 2012[32] | ||||||||
| Northern Ireland | 1.5 | 72.6 | 88.9 | 2010/2011[33][34] | ||||||||
| Scotland | 1.7 | 34.9 | 85.1 | 2012/2013[35][36] | ||||||||
| South Africa | 30.1 | 297.5 | 2012[37][38] | |||||||||
| United States of America | 4.5 | 102.2 | 110 | 2014[39][40] | ||||||||
United States
Much study has been done of the comparative experience and policies of Canada with its southern neighbour the United States, and this is a topic of intense discussion within Canada.
Historically, the violent crime rate in Canada is far lower than that of the U.S. and this continues to be the case. For example, in 2000 the United States' rate for robberies was 65 percent higher, its rate for aggravated assault was more than double, and its murder rate was triple that of Canada. However, the rate of some property crime types is lower in the U.S. than in Canada. For example, in 2006, the rates of vehicle theft were 22% higher in Canada than in the U.S.[41]
Furthermore, in recent years, the gap in violent crime rates between the United States and Canada has narrowed due to a precipitous drop in the violent crime rate in the U.S. For example, while the aggravated assault rate declined for most of the 1990s in the U.S. and was 324 per 100,000 in 2000, the aggravated assault rate in Canada remained relatively steady throughout and was 143 per 100,000 in 2000. In other areas, the U.S. had a faster decline. For instance, whereas the murder rate in Canada declined by 36% between 1991 and 2004, the U.S. murder rate declined by 44%. [42]
The homicide rate in Canada peaked in 1975 at 3.03 per 100,000 and has dropped since then; it reached lower peaks in 1985 (2.72) and 1991 (2.69). It reached a post-1970 low of 1.73 in 2003. The average murder rate between 1970 and 1976 was 2.52, between 1977 and 1983 it was 2.67, between 1984 and 1990 it was 2.41, between 1991 and 1997 it was 2.23 and between 1998 and 2004 it was 1.82.[43] The attempted homicide rate has fallen at a faster rate than the homicide rate.[44]
By comparison, the homicide rate in the U.S. reached 10.1 per 100,000 in 1974, peaked in 1980 at 10.7 and reached a lower peak in 1991 (10.5). The average murder rate between 1970 and 1976 was 9.4, between 1977 and 1983 it was 9.6, between 1984 and 1990 it was 9, between 1991 and 1997 it was 9.2 and between 1998 and 2004 it was 6.3. In 2004, the murder rate in the U.S. dipped below 6 per 100,000, for the first time since 1966, and as of 2010 stood at 4.8 per 100,000 [42]
In more recent years, the U.S. as a country still typically has higher violent crimes rates. In 2012, the homicide rate in the U.S. was 4.7 per 100,000 residents,[45] Canada's was 3 times lower at 1.6.[24] However the chances of being murdered at random are extremely low in both countries. In Canada, only 15% of murders are committed by strangers,[46] in the U.S. this number is very similar at 14%,[47] meaning in 50 years your chance of being murdered at random is 0.000128% in Canada,[48] in the U.S. it is 0.000329% (of course these numbers would vary by neighborhoods within each country). Certain methods of homicide are used more frequently in each country; in Canada (0.59),[49] stabbing homicides occur 51.3% more often than in the U.S. (0.39),[50] however firearm homicides occur 440% more in the U.S. (2.7) than in Canada (0.5). In the U.S., you are 3 times more likely to die being shot (17.4%) than being stabbed (5.3%).[51]
Beyond homicides, the U.S. (112.9) has a higher robbery rate - 42.2% higher than Canada (79.4). Other violent crimes such as physical assaults or sexual assaults are not very comparable between the countries because of different definitions of the crimes. The disparity in property crime is not as large, however it still exists. The burglary/break-in rate in the U.S. (670.2) is 33.1% higher than in Canada (503.7), the theft rate in the U.S. (1959.3) is 33.4% higher than in Canada (1468.4), and the auto-theft rate in the U.S. (229.7) is slightly higher than the rate in Canada (223.5).
See also
References
- ↑ Statistics Canada (February 8, 2017). "Population size and growth in Canada: Key results from the 2016 Census". Archived from the original on February 10, 2017. Retrieved February 8, 2017.
- ↑ Schneider, Stephen (2009). Iced: The Story of Organized Crime in Canada. Springer. p. 343-370.
- ↑ "Statistics Canada Daily". 2006-07-20. Archived from the original on 2008-10-15. Retrieved 2016-12-07.
- ↑ "Red River Women". BBC News. Retrieved 20 August 2017.
- ↑ Brazeau, Robyn; Brzozowski, Jodi-Anne. "Violent victimization in Canada" (PDF). Statcan.ca. p. 1. Archived (PDF) from the original on 2012-03-17. Retrieved 2017-08-20.
- ↑ "Homicide Rates in Canada: Statistics & Trends". MasterMaq.ca Blog. 10 August 2011. Retrieved 20 August 2017.
- ↑ "Homicide capital of Canada". Winnipegfreepress.com. Retrieved 20 August 2017.
- ↑ "Table 4 Police-reported crime severity indexes, by census metropolitan area, 2009". Statcan.gc.ca. Retrieved 20 August 2017.
- ↑ "Police-reported crime statistics: Table 3 Police-reported crime severity indexes, by census metropolitan area, 2010". Statcan.gc.ca. Retrieved 20 August 2017.
- ↑ "Table 3 Police-reported crime severity indexes, by census metropolitan area, 2011". Statcan.gc.ca. Retrieved 20 August 2017.
- ↑ Canada, Government of Canada, Statistics. "Description for chart 9 Police-reported Violent Crime Severity Index, by census metropolitan area, 2012". Statcan.gc.ca. Retrieved 20 August 2017.
- ↑ Canada, Government of Canada, Statistics. "Table 3 Police-reported Crime Severity Indexes, by census metropolitan area, 2013". Statcan.gc.ca. Retrieved 20 August 2017.
- ↑ Canada, Government of Canada, Statistics. "Table 3 Police-reported Crime Severity Indexes, by census metropolitan area, 2014". Statcan.gc.ca. Retrieved 18 November 2017.
- ↑ Canada, Government of Canada, Statistics. "Table 3 Police-reported Crime Severity Indexes, by census metropolitan area, 2015". Statcan.gc.ca. Retrieved 18 November 2017.
- ↑ Canada, Government of Canada, Statistics. "Table 3 Police-reported Crime Severity Indexes, by census metropolitan area, 2016". Statcan.gc.ca. Retrieved 18 November 2017.
- 1 2 "Table 35-10-0177-01 Incident-based crime statistics, by detailed violations". Statcan.gc.ca. Retrieved June 17, 2018.
- ↑ "Police officers by level of policing, by province and territory, 2012" (PDF). Statistics Canada. Retrieved 2014-03-03.
- ↑ "Police personnel". Statistics Canada. Archived from the original on September 26, 2006. Retrieved 2006-10-09.
- ↑ "Police officers, by province and territory". Statistics Canada. Archived from the original on 2006-09-09. Retrieved 2006-10-09.
- ↑ "Table 10 Self-reported victimizations reported to police, 1999, 2004 and 2009". Statcan.gc.ca. Retrieved 20 August 2017.
- 1 2 "Criminal victimization in Canada, 2009". Statcan.gc.ca. Retrieved 20 August 2017.
- ↑ "Executions in Canada from 1860 to abolition". Capitalpunishmentuk.org. Retrieved 14 May 2015. .
- ↑ Feasibility Study on Crime Comparisons Between Canada and the United States Maire Gannon, Canadian Centre for Justice Statistics, Statistics Canada, Cat. no. 85F0035XIE. Retrieved June 28, 2009.
- 1 2 Canada, Government of Canada, Statistics. "Crimes, by type of violation, and by province and territory (Newfoundland and Labrador, Prince Edward Island, Nova Scotia, New Brunswick)". Statcan.gc.ca. Retrieved 20 August 2017.
- ↑
- ↑ "2011 Census QuickStats : Australia". Censusdata.abs.gov.au. Retrieved 20 August 2017.
- ↑ "Crime in England and Wales, Year Ending December 2012" (PDF). Ons.gov.uk. Retrieved 2017-08-21.
- ↑ "Crime Statistics". Ons.gov.uk. Retrieved 20 August 2017.
- ↑ "Population Estimates for England and Wales". Ons.gov.uk. Retrieved 20 August 2017.
- ↑ "Garda Recorded Crime Statistics : 2007-2011" (PDF). Cso.ie. Retrieved 2017-08-21.
- ↑ "Irish population in 2011 at highest in 150 years". Finfacts.ie. Retrieved 20 August 2017.
- ↑ "New Zealand Crime Statistics 2012" (PDF). Police.govt.nz. Retrieved 2017-08-21.
- ↑ "Wayback Machine" (PDF). 10 December 2013. Archived from the original (PDF) on 10 December 2013. Retrieved 20 August 2017.
- ↑ "Publications". Nisra.gov.uk. Retrieved 20 August 2017.
- ↑ "RECORDED CRIME IN SCOTLAND, 2012-13" (PDF). Scotland.gov.uk. 18 June 2013. Retrieved 2017-08-21.
- ↑ "Scotland Population (2017) - World Population Review". Worldpopulationreview.com. Retrieved 20 August 2017.
- ↑ "Crime Stats SA - Crime Stats Simplified". Crimestatssa.com. Retrieved 20 August 2017.
- ↑ "SA population at 51.8 million - Census". News24.com. Retrieved 20 August 2017.
- ↑ Crime in the United States 2014 By Volume and Rate per 100,000 Inhabitants, 1995–2014. FBI.
- ↑ Criminal Victimization, 2014 - cv14.pdf. US Bureau of Justice Statistics.
- ↑ Christopher Effgen (2001-09-11). "United States Crime Rates 1960 - 2008". Disastercenter.com. Retrieved 2010-06-30.
- 1 2 "Bureau of Justice Statistics Key Facts at a Glance Homicide Rate Trends". 24 October 2006. Archived from the original on 24 October 2006. Retrieved 20 August 2017.
- ↑ "85-002-XIE2006006.indd" (PDF). Statcan.ca. Retrieved 20 August 2017.
- ↑ "Wayback Machine" (PDF). 11 April 2008. Archived from the original (PDF) on 11 April 2008. Retrieved 21 August 2017.
- ↑ Crime in the United States 2012. By Volume and Rate per 100,000 Inhabitants, 1993–2012. FBI.
- ↑ "Homicide in Canada, 2011". Statcan.gc.ca. Retrieved 20 August 2017.
- ↑ Expanded Homicide Data Table 10 (FBI). Note that I did not include gang homicides as "stranger killings" as there is some affiliation between rival gangs, it's not necessarily random like being killed in an attempted robbery. Retrieved May 2014
- ↑ 1.6*50=80, meaning 80 people of every 100,000 are murdered in 50 years. 80/100,000*0.16=0.000128%. The same formula is used for the U.S. rate
- ↑ "Homicides, by most common type of method, Canada, 1961 to 2011". Statcan.gc.ca. Retrieved May 5, 2014.
- ↑ "Expanded Homicide Data Table 8: Murder Victims by Weapon, 2008–2012" (XLS). Fbi.gov. Retrieved May 5, 2014.
- ↑ "Are stab wounds as dangerous as gun shot wounds?". 16 November 2014. Archived from the original on 16 November 2014. Retrieved 21 August 2017.
Further reading
- Auger, Michel; Edwards, Peter (2004), The encyclopedia of Canadian organized crime: from Captain Kidd to Mom Boucher, Marks & Spencer ISBN 0-7710-3044-4
- André Cédilot; André Noël (2011). Mafia Inc.: The Long, Bloody Reign of Canada's Sicilian Clan. Random House Digital, Inc. ISBN 978-0-307-36042-7.
- Beare, Margaret E (2007), Money laundering in Canada: chasing dirty and dangerous dollars, University of Toronto Press, ISBN 978-0-8020-9143-7
- Doob, Anthony N (2004), Responding to youth crime in Canada, University of Toronto Press, ISBN 0-8020-8856-2
- Kyle Grayson (12 April 2008). Chasing dragons: security, identity, and illicit drugs in Canada. University of Toronto Press. ISBN 978-0-8020-9479-7.
- Schneider, Stephen (2009), Iced: The Story of Organized Crime in Canada, Mississauga, Ont. : Wiley, ISBN 978-0-470-83500-5
External links
- Correctional Service Canada (commonly called Corrections Canada) administers federal prisons and parole boards.
- Crime comparisons between Canada and the United States
- Black markets in Canada
Crime in the Americas | ||
|---|---|---|
| ||
| Sovereign states |
| .svg.png) |
| ||
| History |
| ||||
|---|---|---|---|---|---|
| Provinces and territories |
| ||||
| Government | |||||
| Politics | |||||
| Geography |
| ||||
| Economy | |||||
| Society | |||||
| Demographics |
| ||||
| Culture | |||||
| Symbols | |||||
| Article overviews | |||||
| Research | |||||
| |||||