Demographics of El Salvador
| Demographics of El Salvador | |
|---|---|
| Population | 6,408,111 |
| Male population | 3,026,110 |
| Female population | 3,351,248 |
| Population growth | 1.68% |
| Birth rate | 25.72/1,000 |
| Death rate | 5.53/1,000 |
| Infant mortality rate | 22.19/1,000 |
| Life expectancy | 73.44 years[1] |
This article is about the demographic features of the population of El Salvador, including population density, ethnicity, education level, health of the populace, economic status, religious affiliations and other aspects of the population.
El Salvador's population numbers 6.1 million. Ethnically, 78% of Salvadorans are mixed (mixed Indigenous Native American and European Spanish origin). Another 12% is of pure European descent, 10% are of pure indigenous descent, 0.16% are Black and others are 0.64%.[2]
Population
.jpg)

.jpg)
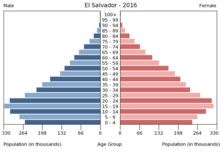
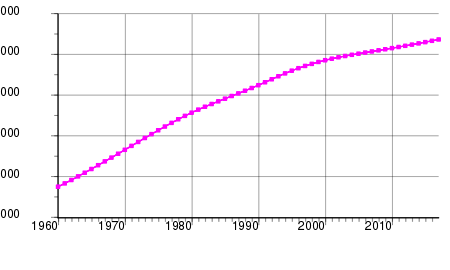
El Salvador's population was 6,344,722 in 2016,[3] compared to 2,200,000 in 1950. In 2010 the percentage of the population below the age of 15 was 32.1%, 61% were between 15 and 65 years of age, while 6.9% were 65 years or older.[4]
| Total population (x 1000) |
Proportion aged 0–14 (%) |
Proportion aged 15–64 (%) |
Proportion aged 65+ (%) | |
|---|---|---|---|---|
| 1950 | 2 200 | 42.7 | 53.3 | 4.0 |
| 1955 | 2 433 | 43.6 | 52.6 | 3.8 |
| 1960 | 2 773 | 45.1 | 51.1 | 3.7 |
| 1965 | 3 244 | 46.3 | 50.1 | 3.7 |
| 1970 | 3 736 | 46.4 | 49.9 | 3.6 |
| 1975 | 4 232 | 45.8 | 50.5 | 3.7 |
| 1980 | 4 661 | 45.2 | 50.9 | 3.9 |
| 1985 | 5 004 | 44.1 | 51.8 | 4.2 |
| 1990 | 5 344 | 41.7 | 53.7 | 4.6 |
| 1995 | 5 748 | 39.6 | 55.5 | 4.9 |
| 2000 | 5 959 | 38.3 | 56.2 | 5.5 |
| 2005 | 6 073 | 35.7 | 58.1 | 6.2 |
| 2010 | 6 218 | 32.1 | 61.0 | 6.9 |
Emigration
The migration rate accelerated during the period of 1979 to 1981, this marked the beginning of the civil unrest and the spread of political killings.[5] The total impact of civil wars, dictatorships and socioeconomics drove over a million Salvadorans (both as immigrants and refugees) into the United States; Guatemala is the second country that hosts more Salvadorans behind the United States, approximately 110,000 Salvadorans according to the national census of 2010.[6] in addition small Salvadoran communities sprung up in Canada, Australia, Belize, Panama, Costa Rica, Italy, Taiwan and Sweden since the migration trend began in the early 1970s.[7] The 2010 U.S. Census counted 1,648,968 Salvadorans in the United States, up from 655,165 in 2000.[8]
Ethnic groups
Out of the 6,408,111 people in El Salvador, 78% are Mestizo, 12% are of full European descent, 10% Indigenous, 0.8% Black, and 0.64% other.
Mestizo Salvadorans

.jpg)
78% of the population are mestizo, having mixed indigenous and European ancestry.[1] In the mestizo population, Salvadorans who are racially European, especially Mediterranean, as well as Afro-Salvadoran, and the indigenous people in El Salvador who do not speak indigenous languages or have and indigenous culture, all identify themselves as being culturally mestizo.[9]
Indigenous Salvadorans
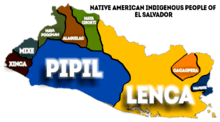
According to the Salvadoran Government, about 10% of the population are of full or partial indigenous origin. The largest most dominant Native American groups in El Salvador are the Lenca people, Maya peoples: (Poqomam people/Chorti people) and Pipil people followed by small enclaves of Cacaopera people, Xinca people, Alaguilac people, Mixe people, Mangue language people, as well as an Olmec past. (Pipil, located in the west and central part of the country, and Lenca, found east of the Lempa River). There are small populations of Cacaopera people in the Morazán Department and a few Ch'orti' people live in the department of Ahuachapán, near the border of Guatemala.
The number of indigenous people in El Salvador have been criticized by indigenous organizations and academics as too small and accuse the government of denying the existence of indigenous Salvadorans in the country.[10] According to the National Salvadoran Indigenous Coordination Council (CCNIS) and CONCULTURA (National Council for Art and Culture at the Ministry of Education ), approximately 600,000 or 10 per cent of Salvadorian peoples are indigenous.[11] Nonetheless, very few Amerindians have retained their customs and traditions, having over time assimilated into the dominant Mestizo/Spanish culture. The low numbers of indigenous people may be partly explained by historically high rates of old-world diseases, absorption into the mestizo population, as well as mass murder during the 1932 Salvadoran peasant uprising (or La Matanza) which saw (estimates of) up to 30,000 peasants killed in a short period of time. Many authors note that since La Matanza the indigenous in El Salvador have been very reluctant to describe themselves as such (in census declarations for example) or to wear indigenous dress or be seen to be taking part in any cultural activities or customs that might be understood as indigenous.[12] Departments and cities in the country with notable indigenous populations include Sonsonate (especially Izalco, Nahuizalco, and Santo Domingo), Cacaopera, and Panchimalco, in the department of San Salvador.[11]
White Salvadorans
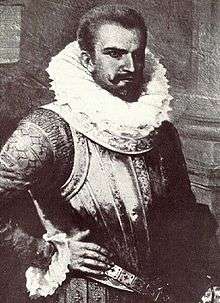
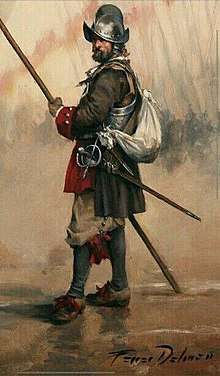
Some 12% of Salvadorans are white. This population is mostly made up of ethnically Spanish people, while there are also Salvadorans of French, German, Swiss, English, Irish, and Italian descent. In northern departments like the Chalatenango Department, it is well known that residents in the area are of pure Spanish descent;[13] settling in the region that is now Chalatenango in the late 18th century.[14] The governor of San Salvador, Francisco Luis Héctor de Carondelet, ordered families from northern Spain (Galicia and Asturias) to settle the area to compensate for the lack of indigenous people to work the land; it is not uncommon to see people with blond hair, fair skin, and blue or green eyes in municipalities like Dulce Nombre de María, La Palma, and El Pital.
Arab Salvadorans
There is a significant Arab population (of about 100,000);[15] mostly from Palestine (especially from the area of Bethlehem), but also from Lebanon. Salvadorans of Palestinian descent numbered around 70,000 individuals, while Salvadorans of Lebanese descent is around 25,000.[16] There is also a small community of Jews who came to El Salvador from France, Germany, Morocco, Tunisia, and Turkey.
Pardo Salvadoran
Pardo is the term that was used in colonial El Salvador to describe a tri-racial Afro-Mestizo person of Indigenous, European, and African descent. Afro-Salvadorans are the descendants of the African population that were enslaved and shipped to El Salvador to work in mines in specific regions of El Salvador. They have mixed into and were naturally bred out by the general Mestizo population, which is a combination of a Mestizo majority and the minority of Pardo people, both of whom are racially mixed populations. Thus, there remains no significant extremes of African physiognomy among Salvadorans like there is in the other countries of Central America. A total of only 10,000 African slaves were brought to El Salvador over the span of 75 years, starting around 1548, about 25 years after El Salvador's colonization. El Salvador is the only country in Central America that does not have English Antillean (West Indian) or Garifuna populations of the Caribbean, but instead had older colonial African slaves that came straight from Africa. This is the reason why El Salvador is the only country in Central America not to have a caribbeanized culture, and instead preserved its classical Central America culture.
The World Factbook demographic statistics
The following demographic statistics are from The World Factbook, unless otherwise indicated.[17]
Nationality
- Noun: Salvadoran(s)
- Adjective: Salvadoran
Population
- 6,161,125[18]
Languages
Literacy
- Total population: 88%
- Male: 90.4%
- Female: 86% (2015 est.)
Ethnic groups
- Mestizo 86.3%
- White 12.7%
- Amerindian 0.2% (includes Lenca, Kakawira, Nahua-Pipil)
- Black 0.1%
- Other 0.6%
Religions
- Roman Catholic 57.1%
- Protestant 21.2%
- Jehovah's Witnesses 1.9%
- Mormon 0.7%
- Other religions 2.3%
- None 16.8%
Vital statistics
UN estimates
The Population Department of the United Nations prepared the following estimates.[4]
| Period | Live births per year |
Deaths per year |
Natural change per year |
CBR* | CDR* | NC* | TFR* | IMR* | Life expectancy total |
Life expectancy males |
Life expectancy females |
|---|---|---|---|---|---|---|---|---|---|---|---|
| 1950-1955 | 108 000 | 48 000 | 61 000 | 46.7 | 20.6 | 26.1 | 6.30 | 147 | 45.1 | 43.4 | 46.8 |
| 1955-1960 | 125 000 | 46 000 | 78 000 | 47.8 | 17.8 | 30.0 | 6.60 | 132 | 49.3 | 47.2 | 51.5 |
| 1960-1965 | 144 000 | 47 000 | 97 000 | 47.7 | 15.5 | 32.3 | 6.76 | 119 | 53.0 | 50.5 | 55.7 |
| 1965-1970 | 156 000 | 47 000 | 109 000 | 44.8 | 13.5 | 31.3 | 6.43 | 109 | 55.6 | 52.6 | 58.9 |
| 1970-1975 | 168 000 | 49 000 | 119 000 | 42.1 | 12.3 | 29.8 | 5.95 | 100 | 57.0 | 53.2 | 61.2 |
| 1975-1980 | 177 000 | 52 000 | 124 000 | 39.7 | 11.8 | 27.9 | 5.46 | 91 | 57.0 | 51.9 | 62.7 |
| 1980-1985 | 174 000 | 55 000 | 119 000 | 36.1 | 11.4 | 24.7 | 4.80 | 77 | 56.9 | 50.6 | 64.2 |
| 1985-1990 | 171 000 | 44 000 | 126 000 | 33.0 | 8.6 | 24.4 | 4.20 | 56 | 63.1 | 57.4 | 69.1 |
| 1990-1995 | 169 000 | 37 000 | 132 000 | 30.5 | 6.8 | 23.8 | 3.73 | 38 | 68.0 | 63.3 | 72.9 |
| 1995-2000 | 161 000 | 38 000 | 123 000 | 27.5 | 6.6 | 20.9 | 3.30 | 27 | 69.2 | 64.4 | 73.9 |
| 2000-2005 | 133 000 | 75 000 | 94 000 | 22.0 | 6.4 | 15.6 | 2.60 | 23 | 70.2 | 65.4 | 74.9 |
| 2005-2010 | 127 000 | 90 000 | 87 000 | 20.7 | 6.5 | 14.2 | 2.35 | 21 | 71.3 | 66.5 | 75.9 |
| * CBR = crude birth rate (per 1000); CDR = crude death rate (per 1000); NC = natural change (per 1000); IMR = infant mortality rate per 1000 births; TFR = total fertility rate (number of children per woman) | |||||||||||
Registered data
| Average population (x 1000) | Live births | Deaths | Natural change | Crude birth rate (per 1000) | Crude death rate (per 1000) | Natural change (per 1000) | TFR | |
|---|---|---|---|---|---|---|---|---|
| 1940 | 1 633 | 74 637 | 45.7 | |||||
| 1941 | 1 654 | 72 376 | 43.8 | |||||
| 1942 | 1 675 | 71 414 | 42.6 | |||||
| 1943 | 1 697 | 71 554 | 42.2 | |||||
| 1944 | 1 719 | 72 590 | 42.2 | |||||
| 1945 | 1 742 | 74 660 | 42.9 | |||||
| 1946 | 1 764 | 72 042 | 30 996 | 41 046 | 40.8 | 17.6 | 23.2 | |
| 1947 | 1 788 | 84 330 | 30 719 | 53 611 | 47.2 | 17.2 | 30.0 | |
| 1948 | 1 811 | 80 770 | 30 527 | 50 243 | 44.6 | 16.9 | 27.7 | |
| 1949 | 1 835 | 84 839 | 28 339 | 56 500 | 46.2 | 15.4 | 30.8 | |
| 1950 | 2 200 | 90 557 | 27 454 | 63 103 | 41.2 | 12.5 | 28.7 | |
| 1951 | 2 237 | 93 634 | 29 030 | 64 604 | 41.8 | 13.0 | 28.9 | |
| 1952 | 2 280 | 96 802 | 32 423 | 64 379 | 42.5 | 14.2 | 28.2 | |
| 1953 | 2 327 | 98 474 | 30 280 | 68 194 | 42.3 | 13.0 | 29.3 | |
| 1954 | 2 378 | 102 009 | 31 810 | 70 199 | 42.9 | 13.4 | 29.5 | |
| 1955 | 2 433 | 105 040 | 31 151 | 73 889 | 43.2 | 12.8 | 30.4 | |
| 1956 | 2 491 | 106 539 | 28 127 | 78 412 | 42.8 | 11.3 | 31.5 | |
| 1957 | 2 553 | 114 929 | 32 893 | 82 036 | 45.0 | 12.9 | 32.1 | |
| 1958 | 2 621 | 115 154 | 32 831 | 82 323 | 43.9 | 12.5 | 31.4 | |
| 1959 | 2 694 | 115 622 | 30 038 | 85 584 | 42.9 | 11.1 | 31.8 | |
| 1960 | 2 773 | 121 403 | 28 768 | 92 635 | 43.8 | 10.4 | 33.4 | |
| 1961 | 2 859 | 124 871 | 28 471 | 96 400 | 43.7 | 10.0 | 33.7 | |
| 1962 | 2 951 | 127 154 | 30 342 | 96 812 | 43.1 | 10.3 | 32.8 | |
| 1963 | 3 047 | 133 395 | 29 614 | 103 781 | 43.8 | 9.7 | 34.1 | |
| 1964 | 3 145 | 133 072 | 29 496 | 103 576 | 42.3 | 9.4 | 32.9 | |
| 1965 | 3 244 | 137 430 | 30 906 | 106 524 | 42.4 | 9.5 | 32.8 | |
| 1966 | 3 342 | 137 950 | 30 368 | 107 582 | 41.3 | 9.1 | 32.2 | |
| 1967 | 3 440 | 139 955 | 28 957 | 110 998 | 40.7 | 8.4 | 32.2 | |
| 1968 | 3 537 | 140 986 | 29 863 | 111 123 | 39.8 | 8.4 | 31.4 | |
| 1969 | 3 636 | 142 699 | 33 655 | 109 044 | 39.2 | 9.2 | 29.9 | |
| 1970 | 3 736 | 141 471 | 35 094 | 106 377 | 37.8 | 9.4 | 28.4 | |
| 1971 | 3 836 | 154 309 | 28 752 | 125 557 | 40.2 | 7.5 | 32.7 | |
| 1972 | 3 938 | 153 464 | 32 383 | 121 081 | 38.9 | 8.2 | 30.7 | |
| 1973 | 4 038 | 155 632 | 31 865 | 123 767 | 38.5 | 7.9 | 30.6 | |
| 1974 | 4 137 | 158 524 | 30 494 | 128 030 | 38.3 | 7.4 | 30.9 | |
| 1975 | 4 232 | 159 731 | 31 601 | 128 130 | 37.7 | 7.5 | 30.3 | |
| 1976 | 4 325 | 165 822 | 30 826 | 134 996 | 38.3 | 7.1 | 31.2 | |
| 1977 | 4 414 | 177 531 | 33 009 | 144 522 | 40.2 | 7.5 | 32.7 | |
| 1978 | 4 500 | 172 897 | 30 086 | 142 811 | 38.4 | 6.7 | 31.7 | |
| 1979 | 4 582 | 174 183 | 32 936 | 141 247 | 38.0 | 7.2 | 30.8 | |
| 1980 | 4 661 | 169 930 | 38 967 | 130 963 | 36.4 | 8.4 | 28.1 | |
| 1981 | 4 734 | 163 305 | 37 468 | 125 837 | 34.5 | 7.9 | 26.6 | |
| 1982 | 4 805 | 156 796 | 33 284 | 123 512 | 32.6 | 6.9 | 25.7 | |
| 1983 | 4 872 | 144 193 | 32 697 | 111 496 | 29.6 | 6.7 | 22.9 | |
| 1984 | 4 938 | 142 202 | 28 854 | 113 348 | 28.8 | 5.8 | 23.0 | |
| 1985 | 5 004 | 139 514 | 27 225 | 112 289 | 27.9 | 5.4 | 22.5 | |
| 1986 | 5 069 | 145 126 | 25 731 | 119 395 | 28.7 | 5.1 | 23.6 | |
| 1987 | 5 134 | 148 355 | 27 581 | 120 774 | 28.9 | 5.4 | 23.6 | |
| 1988 | 5 200 | 149 299 | 27 774 | 121 525 | 28.8 | 5.4 | 23.4 | |
| 1989 | 5 269 | 151 859 | 27 768 | 124 091 | 28.9 | 5.3 | 23.6 | |
| 1990 | 5 344 | 148 360 | 28 195 | 120 165 | 27.8 | 5.3 | 22.5 | |
| 1991 | 5 425 | 151 210 | 27 066 | 124 144 | 27.9 | 5.0 | 22.9 | |
| 1992 | 5 511 | 154 014 | 27 869 | 126 145 | 27.9 | 5.1 | 22.9 | |
| 1993 | 5 597 | 168 000 | 38 000 | 130 000 | 30.0 | 6.8 | 23.2 | |
| 1994 | 5 678 | 160 772 | 29 407 | 131 365 | 28.3 | 5.2 | 23.1 | |
| 1995 | 5 748 | 159 336 | 29 130 | 130 206 | 27.7 | 5.1 | 22.7 | |
| 1996 | 5 807 | 163 007 | 28 904 | 134 103 | 28.1 | 5.0 | 23.1 | |
| 1997 | 5 855 | 164 143 | 29 118 | 135 025 | 28.0 | 5.0 | 23.1 | |
| 1998 | 5 895 | 158 350 | 29 919 | 128 431 | 26.9 | 5.1 | 21.8 | |
| 1999 | 5 929 | 153 636 | 28 056 | 125 580 | 25.9 | 4.7 | 21.2 | |
| 2000 | 5 959 | 150 176 | 28 154 | 122 022 | 25.2 | 4.7 | 20.5 | |
| 2001 | 5 985 | 138 354 | 29 959 | 108 395 | 23.1 | 5.0 | 18.1 | |
| 2002 | 6 008 | 129 363 | 27 458 | 101 905 | 21.5 | 4.6 | 17.0 | |
| 2003 | 6 029 | 124 476 | 29 377 | 95 099 | 20.6 | 4.9 | 15.8 | |
| 2004 | 6 050 | 119 710 | 30 058 | 89 652 | 19.8 | 5.0 | 14.8 | |
| 2005 | 6 073 | 112 769 | 30 933 | 81 836 | 18.6 | 5.1 | 13.5 | |
| 2006 | 6 097 | 107 111 | 31 453 | 75 658 | 17.6 | 5.2 | 12.4 | |
| 2007 | 6 123 | 106 471 | 31 349 | 75 122 | 17.4 | 5.1 | 12.3 | |
| 2008 | 6 152 | 111 278 | 31 594 | 79 684 | 18.1 | 5.1 | 13.0 | |
| 2009 | 6 183 | 107 880 | 32 872 | 75 008 | 17.5 | 5.3 | 12.2 | |
| 2010 | 6 218 | 104 939 | 32 586 | 72 353 | 17.0 | 5.3 | 11.7 | |
| 2011 | 6 256 | 109 384 | 33 211 | 76 173 | 17.6 | 5.3 | 12.3 | |
| 2012 | 110 843 | 32 148 | 78 695 | 17.7 | 5.1 | 12.6 | 2.3 | |
| 2013 | 109 617 | 34 212 | 75 405 | 17.4 | 5.4 | 12.0 | 2.2 | |
| 2014 | 108 903 | 37 461 | 71 442 | 17.2 | 5.9 | 11.3 | ||
| 2015 | 109 617 | 17.0 |
Structure of the population
Structure of the population (12.05.2007) (Census):
| Age group | Male | Female | Total | % |
|---|---|---|---|---|
| Total | 2 719 371 | 3 024 742 | 5 744 113 | 100 |
| 0-4 | 283 272 | 272 621 | 555 893 | 9,68 |
| 5-9 | 349 150 | 335 577 | 684 727 | 11,92 |
| 10-14 | 359 523 | 346 824 | 706 347 | 12,30 |
| 15-19 | 298 384 | 302 181 | 600 565 | 10,46 |
| 20-24 | 228 001 | 258 541 | 486 542 | 8,47 |
| 25-29 | 206 963 | 250 927 | 457 890 | 7,97 |
| 30-34 | 178 400 | 223 849 | 402 249 | 7,00 |
| 35-39 | 156 514 | 196 633 | 353 147 | 6,15 |
| 40-44 | 132 218 | 171 413 | 303 631 | 5,29 |
| 45-49 | 109 957 | 142 165 | 252 122 | 4,39 |
| 50-54 | 95 275 | 120 459 | 215 734 | 3,76 |
| 55-59 | 81 718 | 101 357 | 183 075 | 3,19 |
| 60-64 | 68 207 | 83 657 | 151 864 | 2,64 |
| 65-69 | 55 781 | 69 376 | 125 157 | 2,18 |
| 70-74 | 43 449 | 54 008 | 97 457 | 1,70 |
| 75-79 | 33 658 | 42 326 | 75 984 | 1,32 |
| 80-84 | 20 401 | 26 469 | 46 870 | 0,82 |
| 85+ | 18 500 | 26 359 | 44 859 | 0,78 |
| Age group | Male | Female | Total | Percent |
|---|---|---|---|---|
| 0-14 | 991 945 | 955 022 | 1 946 967 | 33,89 |
| 15-64 | 1 555 637 | 1 851 182 | 3 406 819 | 59,31 |
| 65+ | 171 789 | 218 538 | 390 327 | 6,80 |
Structure of the population (01.07.2011) (Estimates based on the 2007 Population Census):
| Age group | Male | Female | Total | % |
|---|---|---|---|---|
| Total | 2 925 284 | 3 290 858 | 6 216 143 | 100 |
| 0-4 | 309 786 | 296 430 | 606 216 | 9,75 |
| 5-9 | 308 052 | 294 483 | 602 535 | 9,69 |
| 10-14 | 362 232 | 348 111 | 710 343 | 11,43 |
| 15-19 | 352 598 | 350 791 | 703 389 | 11,32 |
| 20-24 | 276 109 | 305 559 | 581 668 | 9,36 |
| 25-29 | 209 615 | 261 340 | 470 955 | 7,58 |
| 30-34 | 180 198 | 235 412 | 415 609 | 6,69 |
| 35-39 | 168 638 | 219 197 | 387 835 | 6,24 |
| 40-44 | 149 955 | 194 952 | 344 907 | 5,55 |
| 45-49 | 127 846 | 167 719 | 295 565 | 4,75 |
| 50-54 | 108 714 | 140 978 | 249 692 | 4,02 |
| 55-59 | 93 682 | 119 911 | 213 593 | 3,44 |
| 60-64 | 78 899 | 100 625 | 179 525 | 2,89 |
| 65-69 | 65 846 | 82 450 | 148 295 | 2,39 |
| 70-74 | 52 993 | 66 934 | 119 928 | 1,93 |
| 75-79 | 38 678 | 49 603 | 88 281 | 1,42 |
| 80+ | 41 443 | 56 363 | 97 806 | 1,57 |
| Age group | Male | Female | Total | Percent |
|---|---|---|---|---|
| 0-14 | 980 070 | 939 024 | 1 919 094 | 30,87 |
| 15-64 | 1 746 254 | 2 096 484 | 3 842 738 | 61,82 |
| 65+ | 198 960 | 255 350 | 454 310 | 7,31 |
Gallery
 Salvadoran boy during the civil war, one of many Salvadoran children refugees
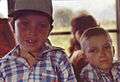 Salvadoran boys during the civil war
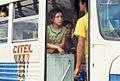 Salvadoran girl during the civil war
 Salvadoran girl during the civil war
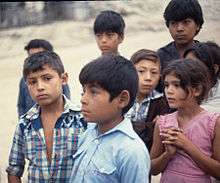 Salvadoran boys and girls during the civil war
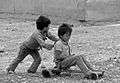 Salvadoran boys during the civil war
 Salvadoran boys during the civil war
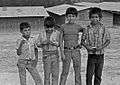 Salvadoran boys during the civil war
_28%2C_helps_Salvadoran.jpg) Salvadoran men building class bench for children
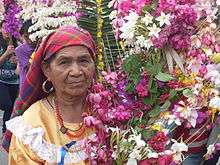
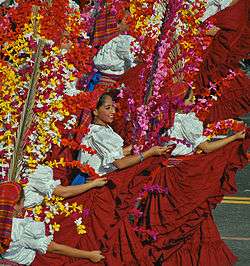
Salvadoran men building class bench for children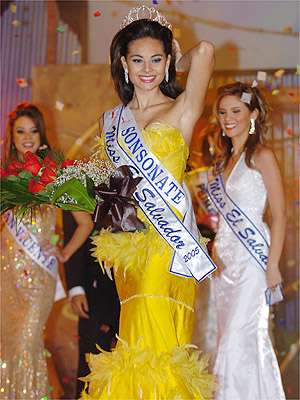 Salvadoran women, beauty queen Irma Dimas
See also
References
- 1 2 "El Salvador". The World Factbook. Central Intelligence Agency.
- ↑ "The World Factbook — Central Intelligence Agency". Cia.gov. Retrieved 4 October 2017.
- ↑ "World Population Prospects: The 2017 Revision". ESA.UN.org (custom data acquired via website). United Nations Department of Economic and Social Affairs, Population Division. Retrieved 10 September 2017.
- 1 2 "Population Division of the Department of Economic and Social Affairs of the United Nations Secretariat, World Population Prospects: The 2012 Revision". Esa.un.org. Retrieved 4 October 2017.
- ↑ Jones, Richard C. (April 1989). "Causes of Salvadoran Migration to the United States". Geographical Review. 79 (2): 183. doi:10.2307/215525.
- ↑ User, Super. "Institución". Ine.gob.gt. Retrieved 4 October 2017.
- ↑ "Mapa de las Migraciones Salvadoreñas". PNUD El Salvador. Retrieved 26 May 2015.
- ↑ "Archived copy". Archived from the original on 2013-09-11. Retrieved 2011-04-25.
- ↑ EL SALVADOR Visa Application - Tourist Visas, Business Visas, Expedited Visas - El Salvador Page Archived 2010-12-01 at the Wayback Machine.
- ↑ Ayala, Edgardo. "Native People of El Salvador Finally Gain Recognition". Ipsnews.net. Retrieved 20 January 2016.
- 1 2 "El Salvador - Indigenous peoples". Minority rights groups international. Retrieved 20 January 2016.
- ↑ "Jose Napoleon Duarte,Hernandez Martinez,Ungo,Matanza,Central American Common Market,CACM,urban middle class,Christian Democratic Party,powerful families,death squads,Organization of American States,PRUD,International Court Of Justice,urban center,rapid population growth". Countriesquest.com. Retrieved 4 October 2017.
- ↑ Guzman, John (2011). Reflections Behind The Retina. Xlibris Corporation. p. 192.
|access-date=requires|url=(help) - ↑ "Carondelet". NCH Historias Multimedia. Retrieved 27 May 2015.
- ↑ Zielger, Matthew. "El Salvador: Central American Palestine of the West?". The Daily Star. Retrieved 27 May 2015.
- ↑ "Lebanese Diaspora – Worldwide Geographical Distribution". Retrieved 27 May 2015.
- ↑ "Central America and Caribbean :: BARBADOS". CIA The World Factbook.
- ↑ "El Salvador Population (2017, 2018) - Worldometers". Worldometers.info. Retrieved 4 October 2017.
- 1 2 "United Nations Statistics Division - Demographic and Social Statistics". Unstats.un.org. Retrieved 4 October 2017.
| Indigenous | |
|---|---|
| Non-Indigenous | |
Portal | |
| History |  | ||||
|---|---|---|---|---|---|
| Geography | |||||
| Politics | |||||
| Economy | |||||
| Society |
| ||||