Demographics of Northwest Territories
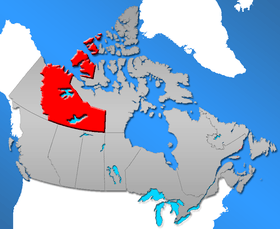
The Northwest Territories is a territory of Canada. It has an area of 1,171,918 square kilometres and a population of 41,464 as of July 1, 2006.
Population of Northwest Territories since 1871
| Year | Population | five-year % change |
ten-year % change |
Rank among provinces and territories |
|---|---|---|---|---|
| 1871 | 48,000 | n/a | n/a | 6 |
| 1881 | 56,446 | n/a | 17.6 | 7 |
| 1891 | 98,967 | n/a | 75.3 | 7 |
| 1901 | 20,129* | n/a | -79.7 | 11 |
| 1911 | 6,507** | n/a | -67.7 | 11 |
| 1921 | 8,143 | n/a | 25.1 | 10 |
| 1931 | 9,316 | n/a | 14.4 | 10 |
| 1941 | 12,028 | n/a | 29.1 | 10 |
| 1951 | 16,004 | n/a | 33.1 | 11 |
| 1956 | 19,313 | 20.7 | n/a | 11 |
| 1961 | 22,998 | 19.1 | 43.7 | 11 |
| 1966 | 28,738 | 25.0 | 48.8 | 11 |
| 1971 | 34,805 | 21.1 | 51.3 | 11 |
| 1976 | 42,610 | 22.4 | 48.3 | 11 |
| 1981 | 45,740 | 7.3 | 31.4 | 11 |
| 1986 | 52,235 | 14.2 | 22.6 | 11 |
| 1991 | 57,649 | 10.3 | 26.0 | 11 |
| 1996 | 64,402 | 11.7 | 23.2 | 11 |
| 2001 | 37,360*** | -42.0 | -35.2 | 11 |
| 2006 | 41,464 | 11.0 | -35.6 | 11 |
| 2011 | 41,462 | 0.0 | 10.9 | 11 |
*Note: Yukon Territory was ceded from Northwest Territories in 1898.
**Note: Alberta and Saskatchewan were created from parts of Northwest Territories in 1905.
***Note: Data through 1996 includes Nunavut. 2001 data does not include Nunavut.
Source: Statistics Canada [1][2][3]
Ten largest population centres
| Municipality | 2011 | 2006 | 2001 | 1996 |
|---|---|---|---|---|
| Yellowknife | 19,234 | 18,700 | 16,541 | 17,275 |
| Hay River | 3,606 | 3,648 | 3,510 | 3,611 |
| Inuvik | 3,463 | 3,484 | 2,894 | 3,296 |
| Fort Smith | 2,093 | 2,364 | 2,185 | 2,441 |
| Behchoko | 1,926 | 1,894 | 1,552 | 1,662 |
| Fort Simpson | 1,238 | 1,216 | 1,163 | 1,257 |
| Tuktoyaktuk | 854 | 870 | 930 | 943 |
| Fort McPherson | 792 | 776 | 761 | 878 |
| Fort Providence | 734 | 727 | 753 | 748 |
| Norman Wells | 727 | 761 | 666 | 798 |
Languages
French was made an official language in 1877 by the appointed government, after lengthy and bitter debate resulting from a speech from the throne in 1888 by Lt. Governor Joseph Royal. The members voted on more than one occasion to nullify and make English the only language used in the assembly. After some conflict with Ottawa and a decisive vote on January 19, 1892, the issue was put to rest as an English-only territory.
In the early 1980s, the government of Northwest Territories was again under pressure by the federal government to reintroduce French as an official language. Some native members walked out of the assembly, protesting that they would not be permitted to speak their own language. The executive council appointed a special committee of MLAs to study the matter. They decided that if French was to be an official language, then so must the other languages in the territories.
The Northwest Territories's Official Languages Act recognizes the following eleven official languages, which is more than any other political division in Canada:[4]
- Chipewyan
- Cree
- English
- French
- Gwich’in
- Inuinnaqtun
- Inuktitut
- Inuvialuktun
- North Slavey
- South Slavey
- Tłįchǫ
NWT residents have a right to use any of the above languages in a territorial court and in debates and proceedings of the legislature. However, laws are legally binding only in their French and English versions, and the government only publishes laws and other documents in the territory's other official languages when the legislature asks it to. Furthermore, access to services in any language is limited to institutions and circumstances where there is significant demand for that language or where it is reasonable to expect it given the nature of the services requested. In reality, this means that English language services are universally available and there is no guarantee that other languages, including French, will be used by any particular government service except for the courts.
The 2006 Canadian census showed a population of 41,464.
Of the 40,680 singular responses to the census question concerning 'mother tongue' the most commonly reported languages were:
| 1. | English | 31,545 | 77.54% |
| 2. | Athapaskan languages | 4,710 | 11.58% |
| Dogrib | 1,950 | 4.79% | |
| South Slavey | 1,285 | 3.16% | |
| North Slavey | 835 | 2.05% | |
| Chipewyan | 390 | 0.96% | |
| Gwich'in | 190 | 0.47% | |
| Dene | 50 | 0.12% | |
| 3. | French | 975 | 2.40% |
| 4. | Inuktitut | 695 | 1.71% |
| 5. | Malayo-Polynesian languages | 530 | 1.30% |
| Tagalog | 505 | 1.24% | |
| 6. | Vietnamese | 305 | 0.75% |
| 7. | Chinese | 260 | 0.64% |
| Cantonese | 120 | 0.29% | |
| 8. | Algonquian languages | 250 | 0.61% |
| Cree | 190 | 0.47% | |
| Ojibway | 35 | 0.09% | |
| 9. | German | 190 | 0.47% |
| 10= | Arabic | 105 | 0.26% |
| 10= | Creole | 105 | 0.26% |
| 12. | Dutch | 95 | 0.23% |
| 13. | Spanish | 90 | 0.22% |
| 14. | Niger-Congo languages | 80 | 0.20% |
| Bantu languages | 55 | 0.14% | |
| 15. | Yugoslavian languages | 60 | 0.15% |
| 16= | Innuinaqtun | 55 | 0.14% |
| 16= | Italian | 55 | 0.14% |
There were also about 40 single-language responses for Ukrainian; 35 for the Scandinavian languages, Slovak and Urdu; and 30 for Hungarian, the Iranian languages and Polish. In addition, there were also 320 responses of both English and a 'non-official language'; 15 of both French and a 'non-official language; 45 of both English and French, and about 400 people who either did not respond to the question, or reported multiple non-official languages, or else gave some other unenumerated response. The Northwest Territories' official languages are shown in bold. Figures shown are for the number of single language responses and the percentage of total single-language responses.)[5]
Migration
Immigration
The 2006 Canadian census counted a total of 2,815 immigrants living in the Northwest Territories.
The most commonly reported origins for these immigrants were:
[6]
| 1. | Philippines | 555 |
| 2. | United Kingdom | 345 |
| 3. | Vietnam | 245 |
| 4. | United States | 235 |
| 5. | Germany | 130 |
| 6= | China | 100 |
| 6= | Ghana | 100 |
| 8= | Hong Kong | 65 |
| 8= | Netherlands | 65 |
| 10= | former Yugoslavia | 45 |
| 10= | Italy | 45 |
| 12= | Australia | 40 |
| 12= | France | 40 |
| 12= | South Africa | 40 |
There were also about thirty-five immigrants from Pakistan; and about thirty each from India, Lebanon, Nigeria and Slovakia.
Internal migration
A total of 12,100 people moved to the Northwest Territories from other parts of Canada between 1996 and 2006 while 15,955 people moved in the opposite direction. These movements resulted in a net influx of 825 from Newfoundland and Labrador, 295 from Nunavut, 235 from Quebec and 195 from Nova Scotia; and a net outmigration of 3,955 to Alberta, 705 to British Columbia, 260 to Manitoba, 245 to Ontario and 230 to the Yukon. (All inter-provincial movements and official minority movements of more than 100 persons are given.)[7][8]
Visible minorities and Aboriginals
| Visible minority and Aboriginal population (Canada 2006 Census) | |||
|---|---|---|---|
| Population group | Population | % of total population | |
| European | 18,160 | 44.2% | |
| Visible minority group Source:[9] | South Asian | 210 | 0.5% |
| Chinese | 315 | 0.8% | |
| Black | 375 | 0.9% | |
| Filipino | 695 | 1.7% | |
| Latin American | 85 | 0.2% | |
| Arab | 85 | 0.2% | |
| Southeast Asian | 355 | 0.9% | |
| West Asian | 40 | 0.1% | |
| Korean | 15 | 0% | |
| Japanese | 15 | 0% | |
| Visible minority, n.i.e. | 30 | 0.1% | |
| Multiple visible minority | 40 | 0.1% | |
| Total visible minority population | 2,265 | 5.5% | |
| Aboriginal group Source:[10] | First Nations | 12,640 | 30.8% |
| Métis | 3,585 | 8.7% | |
| Inuit | 4,165 | 10.1% | |
| Aboriginal, n.i.e. | 145 | 0.4% | |
| Multiple Aboriginal identity | 105 | 0.3% | |
| Total Aboriginal population | 20,635 | 50.3% | |
| Total population | 41,060 | 100% | |
See also
References
- ↑ Population urban and rural, by province and territory (Northwest Territories). Statistics Canada, 2005.
- ↑ Canada's population Archived November 4, 2008, at the Wayback Machine.. Statistics Canada. Last accessed September 28, 2006.
- ↑ "Population and dwelling counts, for Canada, provinces and territories, 2011 and 2006 censuses". Statistics Canada. 2012-04-11. Retrieved 2012-04-28.
- ↑ Northwest Territories Official Languages Act, 1988 Archived March 24, 2009, at the Wayback Machine. (as amended 1988, 1991-1992, 2003)
- ↑ Detailed Mother Tongue (186), Knowledge of Official Languages (5), Age Groups (17A) and Sex (3) (2006 Census)
- ↑ Immigrant Status and Period of Immigration (8) and Place of Birth (261) (2006 Census)
- ↑ Province or Territory of Residence 5 Years Ago (14), Mother Tongue (8), Age Groups (16) and Sex (3) (2006 Census) Archived February 11, 2009, at the Wayback Machine.
- ↑ Province or Territory of Residence 5 Years Ago (14), Mother Tongue (8), Age Groups (16) and Sex (3) (2001 census)
- ↑ Territories&SearchType=Begins&SearchPR=01&B1=All&Custom=, Community Profiles from the 2006 Census, Statistics Canada - Province/Territory
- ↑ Territories&SearchType=Begins&SearchPR=01&B1=All&Custom=, Aboriginal Population Profile from the 2006 Census, Statistics Canada - Province/Territory
| Provinces | |
|---|---|
| Territories | |
| |
| Ethnic ancestry |
| ||||||||||||||||||||||||||||||||||||||||||||||||||
|---|---|---|---|---|---|---|---|---|---|---|---|---|---|---|---|---|---|---|---|---|---|---|---|---|---|---|---|---|---|---|---|---|---|---|---|---|---|---|---|---|---|---|---|---|---|---|---|---|---|---|---|
| Demographics | |||||||||||||||||||||||||||||||||||||||||||||||||||
| Culture & society | |||||||||||||||||||||||||||||||||||||||||||||||||||
| List of Canadians |
| ||||||||||||||||||||||||||||||||||||||||||||||||||
| |||||||||||||||||||||||||||||||||||||||||||||||||||