Demographics of Antigua and Barbuda
| Census population and average annual growth rate | ||
|---|---|---|
| Year | Pop. | ±% p.a. |
| 1871 | 35,157 | — |
| 1881 | 34,964 | −0.06% |
| 1891 | 36,819 | +0.52% |
| 1911 | 32,269 | −0.66% |
| 1921 | 29,767 | −0.80% |
| 1946 | 41,757 | +1.36% |
| 1960 | 54,060 | +1.86% |
| 1970 | 64,794 | +1.83% |
| 1991 | 60,840 | −0.30% |
| 2001 | 76,886 | +2.37% |
| 2011 | 86,295 | +1.16% |
| Source:[1] | ||
This article is about the demographic features of the population of Antigua and Barbuda, including population density, ethnicity, religious affiliations and other aspects of the population.
Population
According to the 2011 census the estimated resident population of Antigua and Barbuda was 86,295.[2] The estimated population of 2016 is 100,963 (the 2017 revision of the World Population Prospects[3]).
Vital statistics
| Average population | Live births | Deaths | Natural change | Crude birth rate (per 1000) | Crude death rate (per 1000) | Natural change (per 1000) | Infant mortality rate[6] | TFR | |
|---|---|---|---|---|---|---|---|---|---|
| 1950 | ~46 000 | 1 654 | 535 | 1 119 | 35.7 | 11.6 | 24.2 | ||
| 1951 | ~48 000 | 1 676 | 605 | 1 071 | 34.7 | 12.5 | 22.2 | ||
| 1952 | ~50 000 | 1 612 | 526 | 1 086 | 32.3 | 10.5 | 21.8 | ||
| 1953 | ~51 000 | 1 687 | 599 | 1 088 | 33.0 | 11.7 | 21.3 | ||
| 1954 | ~52 000 | 1 660 | 532 | 1 128 | 31.9 | 10.2 | 21.7 | ||
| 1955 | ~53 000 | 1 880 | 516 | 1 364 | 35.7 | 9.8 | 25.9 | ||
| 1956 | ~53 000 | 1 917 | 497 | 1 420 | 36.1 | 9.4 | 26.8 | ||
| 1957 | ~53 000 | 1 764 | 512 | 1 252 | 33.0 | 9.6 | 23.4 | ||
| 1958 | ~54 000 | 1 818 | 551 | 1 267 | 33.8 | 10.3 | 23.6 | ||
| 1959 | ~54 000 | 1 831 | 517 | 1 314 | 33.8 | 9.5 | 24.3 | ||
| 1960 | ~55 000 | 1 878 | 538 | 1 340 | 34.3 | 9.8 | 24.5 | ||
| 1961 | ~55 000 | 1 768 | 503 | 1 265 | 31.9 | 9.1 | 22.8 | ||
| 1962 | ~56 000 | 1 787 | 405 | 1 382 | 31.7 | 7.2 | 24.5 | ||
| 1963 | ~57 000 | 1 833 | 574 | 1 259 | 32.0 | 10.0 | 21.9 | ||
| 1964 | ~59 000 | 1 886 | 500 | 1 386 | 32.2 | 8.5 | 23.7 | ||
| 1965 | ~60 000 | 1 742 | 484 | 1 258 | 29.2 | 8.1 | 21.1 | ||
| 1966 | ~61 000 | 1 745 | 492 | 1 253 | 28.7 | 8.1 | 20.6 | ||
| 1967 | ~62 000 | 1 794 | 440 | 1 354 | 28.9 | 7.1 | 21.8 | ||
| 1968 | ~63 000 | 1 811 | 513 | 1 298 | 28.7 | 8.1 | 20.5 | ||
| 1969 | ~64 000 | 1 527 | 410 | 1 117 | 23.7 | 6.4 | 17.4 | ||
| 1970 | ~65 000 | 1 540 | 411 | 1 129 | 23.6 | 6.3 | 17.3 | ||
| 1971 | ~66 000 | 1 700 | 414 | 1 286 | 25.6 | 6.2 | 19.4 | ||
| 1972 | ~67 000 | 1 573 | 455 | 1 118 | 23.4 | 6.8 | 16.6 | ||
| 1973 | ~68 000 | 1 257 | 377 | 880 | 18.5 | 5.5 | 12.9 | ||
| 1974 | ~69 000 | 1 274 | 496 | 778 | 18.6 | 7.2 | 11.3 | ||
| 1975 | ~69 000 | 1 336 | 463 | 873 | 19.3 | 6.7 | 12.6 | ||
| 1976 | ~70 000 | 1 522 | 491 | 1 031 | 21.8 | 7.0 | 14.8 | ||
| 1977 | ~70 000 | 1 429 | 489 | 940 | 20.3 | 7.0 | 13.4 | ||
| 1978 | ~71 000 | 1 342 | 402 | 940 | 19.0 | 5.7 | 13.3 | ||
| 1979 | ~71 000 | 1 397 | 469 | 928 | 19.8 | 6.6 | 13.2 | ||
| 1980 | ~70 000 | 1 238 | 387 | 851 | 17.6 | 5.5 | 12.1 | ||
| 1981 | ~70 000 | 1 177 | 377 | 800 | 16.9 | 5.4 | 11.5 | ||
| 1982 | ~69 000 | 1 152 | 394 | 758 | 16.7 | 5.7 | 11.0 | ||
| 1983 | ~68 000 | 1 174 | 404 | 770 | 17.3 | 5.9 | 11.3 | ||
| 1984 | ~67 000 | 1 126 | 386 | 740 | 16.8 | 5.8 | 11.1 | ||
| 1985 | ~66 000 | 1 190 | 405 | 785 | 18.1 | 6.2 | 11.9 | ||
| 1986 | ~65 000 | 1 130 | 383 | 747 | 17.5 | 5.9 | 11.6 | ||
| 1987 | ~63 000 | 1 104 | 417 | 687 | 17.4 | 6.6 | 10.8 | ||
| 1988 | ~63 000 | 1 107 | 389 | 718 | 17.7 | 6.2 | 11.5 | ||
| 1989 | ~62 000 | 1 137 | 415 | 722 | 18.3 | 6.7 | 11.7 | ||
| 1990 | ~62 000 | 1 288 | 433 | 855 | 20.8 | 7.0 | 13.8 | ||
| 1991 | ~62 000 | 1 178 | 438 | 740 | 18.9 | 7.0 | 11.9 | ||
| 1992 | ~63 000 | 1 256 | 442 | 814 | 19.8 | 7.0 | 12.8 | ||
| 1993 | ~65 000 | 1 228 | 455 | 773 | 18.9 | 7.0 | 11.9 | ||
| 1994 | ~67 000 | 1 271 | 451 | 820 | 19.1 | 6.8 | 12.3 | ||
| 1995 | ~68 000 | 1 347 | 434 | 913 | 19.7 | 6.3 | 13.4 | ||
| 1996 | ~70 000 | 1 400 | 429 | 971 | 19.9 | 6.1 | 13.8 | ||
| 1997 | ~72 000 | 1 448 | 468 | 980 | 20.0 | 6.5 | 13.6 | ||
| 1998 | ~74 000 | 1 366 | 456 | 910 | 18.4 | 6.1 | 12.3 | ||
| 1999 | ~76 000 | 1 329 | 509 | 820 | 17.5 | 6.7 | 10.8 | ||
| 2000 | ~78 000 | 1 528 | 447 | 1 081 | 19.7 | 5.8 | 13.9 | ||
| 2001 | ~79 000 | 1 366 | 457 | 909 | 17.3 | 5.8 | 11.5 | ||
| 2002 | ~80 000 | 1 201 | 434 | 767 | 15.0 | 5.4 | 9.6 | ||
| 2003 | ~81 000 | 1 242 | 437 | 805 | 15.4 | 5.4 | 10.0 | ||
| 2004 | ~82 000 | 1 272 | 527 | 745 | 15.6 | 6.4 | 9.1 | 15.6 | |
| 2005 | 82 786 | 1 243 | 497 | 746 | 15.0 | 6.0 | 9.0 | 13.1 | 1.6 |
| 2006 | 84 330 | 1 207 | 465 | 742 | 14.3 | 5.8 | 8.5 | 10.9 | 1.6 |
| 2007 | 85 901 | 1 295 | 471 | 824 | 15.1 | 5.5 | 9.6 | 21.7 | 1.7 |
| 2008 | 87 506 | 1 452 | 543 | 909 | 16.6 | 6.2 | 10.4 | 17.4 | 1.8 |
| 2009 | 89 138 | 1 418 | 523 | 895 | 15.9 | 5.7 | 10.2 | 11.4 | 1.8 |
| 2010 | 90 801 | 1 255 | 504 | 751 | 13.8 | 5.6 | 8.2 | 10.5 | 1.5 |
| 2011 | 1 257 | 478 | 779 | 22.6 | |||||
| 2012 | 1 187 | 510 | 677 | 15.3 |
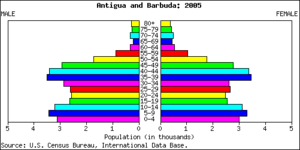
Structure of the population
[7] Structure of the population (27.05.2011) (Census) :
| Age Group | Male | Female | Total | % |
|---|---|---|---|---|
| Total | 40 986 | 44 581 | 85 567 | 100 |
| 0-4 | 3 361 | 3 262 | 6 623 | 7,74 |
| 5-9 | 3 272 | 3 188 | 6 460 | 7,55 |
| 10-14 | 3 690 | 3 638 | 7 329 | 8,57 |
| 15-19 | 3 554 | 3 519 | 7 073 | 8,27 |
| 20-24 | 3 206 | 3 418 | 6 624 | 7,74 |
| 25-29 | 3 135 | 3 512 | 6 647 | 7,77 |
| 30-34 | 3 101 | 3 516 | 6 617 | 7,73 |
| 35-39 | 3 049 | 3 699 | 6 748 | 7,89 |
| 40-44 | 3 124 | 3 588 | 6 712 | 7,84 |
| 45-49 | 2 893 | 3 348 | 6 241 | 7,29 |
| 50-54 | 2 416 | 2 694 | 5 110 | 5,97 |
| 55-59 | 1 763 | 1 957 | 3 721 | 4,35 |
| 60-64 | 1 398 | 1 569 | 2 968 | 3,47 |
| 65-69 | 1 066 | 1 172 | 2 238 | 2,62 |
| 70-74 | 690 | 810 | 1 500 | 1,75 |
| 75-79 | 527 | 654 | 1 181 | 1,38 |
| 80-84 | 331 | 520 | 850 | 0,99 |
| 85-89 | 214 | 298 | 512 | 0,60 |
| 90-94 | 72 | 122 | 193 | 0,23 |
| 95+ | 27 | 57 | 84 | 0,10 |
| unknown | 96 | 40 | 136 | 0,16 |
| Age group | Male | Female | Total | Percent |
|---|---|---|---|---|
| 0-14 | 10 323 | 10 088 | 20 411 | 23,85 |
| 15-64 | 27 736 | 30 860 | 58 596 | 68,48 |
| 65+ | 2 927 | 3 633 | 6 560 | 7,67 |
Ethnic groups
The population of Antigua and Barbuda, is predominantly black (91.0%) or mixed (4.4%).[1] 1.9% of the population is white and 0.7% East Indian. There is also a small Amerindian population: 177 in 1991 and 214 in 2001 (0.3% of the total population). The remaining 1.6% of the population includes people from the Middle East (0.6%) and Chinese (0.2%).
The 2001 census disclosed that 19,425, or 30 per cent of the total population of Antigua and Barbuda, reported their place of birth as a foreign country.[1] Over 15,000 of these persons were from other Caribbean states, representing 80 of the total foreign born. The main countries of origin were Guyana, Dominica and Jamaica. Approximately 4,500 or 23 per cent of all foreign born came from Guyana, 3,300 or 17 per cent came from Dominica and 2,800 or 14 per cent came from Jamaica. The largest single group from a country outside the region came from the United States. Of the total of 1,715 persons, nine per cent of the foreign born, came from the United States while three per cent and one per cent came from the United Kingdom and Canada, respectively. Many of these are the children of Antiguans and Barbudans who had emigrated to these countries, mainly during the 1980s, and subsequently returned.
The World Factbook demographic statistics
The following demographic statistics are from The World Factbook, unless otherwise indicated [8]
Population
- 92,436
Nationality
- Noun: Antiguan(s), Barbudan(s)
- Adjective: Antiguan, Barbudan
Languages
- English (official)
- Antiguan creole
Ethnic groups
Religions
- Protestant 68.3%
- Anglican 17.6%
- Seventh-day Adventist 12.4%
- Pentecostal 12.2%
- Moravian 8.3%
- Methodist 5.6%
- Wesleyan Holiness 4.5%
- Church of God 4.1%
- Baptist 3.6%
- Roman Catholic 8.2%
- Other 12.2%
- Unspecified 5.5%
- None 5.9%
References
- 1 2 3 "2000 ROUND OF POPULATION AND HOUSING CENSUS DATA ANALYSIS SUB-PROJECT" (PDF). Caricomstats.org. Retrieved 30 August 2017.
- ↑ "Archived copy". Archived from the original on 2013-12-30. Retrieved 2014-11-25.
- ↑ "World Population Prospects: The 2017 Revision". ESA.UN.org (custom data acquired via website). United Nations Department of Economic and Social Affairs, Population Division. Retrieved 10 September 2017.
- ↑ "United Nations Demographic Yearbooks". Unstats.un.org. Retrieved 30 August 2017.
- ↑ "DEMOGRAPHIC PROFILE: ANTIGUA AND BARBUDA" (PDF). Caricomstats.org. Retrieved 30 August 2017.
- ↑ "DEMOGRAPHIC PROFILE: ANTIGUA AND BARBUDA" (PDF). Caricomstats.org. Retrieved 30 August 2017.
- ↑ "United Nations Statistics Division - Demographic and Social Statistics". Unstats.un.org. Retrieved 30 August 2017.
- ↑ "Central America and Caribbean :: ANTIGUA AND BARBUDA". CIA The World Factbook.