Garfield County, Montana
| Garfield County, Montana | |
|---|---|
 Garfield County Courthouse in Jordan | |
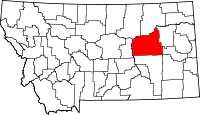 Location in the U.S. state of Montana | |
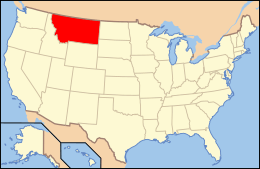 Montana's location in the U.S. | |
| Founded | February 7, 1919[1] |
| Seat | Jordan |
| Largest town | Jordan |
| Area | |
| • Total | 4,847 sq mi (12,554 km2) |
| • Land | 4,675 sq mi (12,108 km2) |
| • Water | 172 sq mi (445 km2), 3.6% |
| Population (est.) | |
| • (2016) | 1,310 |
| • Density | 0.3/sq mi (0.1/km2) |
| Congressional district | At-large |
| Time zone | Mountain: UTC−7/−6 |
| Website |
www |
Garfield County is a county located in the U.S. state of Montana. As of the 2010 census, the population was 1,206.[2] Its county seat is Jordan.[3]
Garfield County is noteworthy as the site of the discovery and excavation of four of the world's dozen or so major specimens (as of 1994) of Tyrannosaurus rex within the county. A cast of the skull of one of these dinosaurs is on display at the Garfield County Museum.[4]
Geography
According to the U.S. Census Bureau, the county has a total area of 4,847 square miles (12,550 km2), of which 4,675 square miles (12,110 km2) is land and 172 square miles (450 km2) (3.6%) is water.[5] Its average population density of 0.1058 inhabitants/km² (0.274/sq mi) is the third-lowest of any county outside of Alaska (behind Loving County, Texas and Esmeralda County, Nevada).
Major highways
Adjacent counties
- Phillips County, Montana - northwest
- Valley County, Montana - north
- McCone County, Montana - east
- Prairie County, Montana - east
- Custer County, Montana - southeast
- Rosebud County, Montana - south
- Petroleum County, Montana - west
National protected area
Demographics
| Historical population | |||
|---|---|---|---|
| Census | Pop. | %± | |
| 1920 | 5,368 | — | |
| 1930 | 4,252 | −20.8% | |
| 1940 | 2,641 | −37.9% | |
| 1950 | 2,172 | −17.8% | |
| 1960 | 1,981 | −8.8% | |
| 1970 | 1,796 | −9.3% | |
| 1980 | 1,656 | −7.8% | |
| 1990 | 1,589 | −4.0% | |
| 2000 | 1,279 | −19.5% | |
| 2010 | 1,206 | −5.7% | |
| Est. 2016 | 1,310 | [6] | 8.6% |
| U.S. Decennial Census[7] 2010-2015[2] | |||
2000 census
As of the census[8] of 2000, there were 1,279 people, 532 households, and 366 families residing in the county. The population density was <1/km² (<1/sq mi). There were 961 housing units at an average density of <1/km² (<1/sq mi). The racial makeup of the county was 99.14% White, 0.08% Black or African American, 0.39% Native American, 0.08% Asian, 0.08% Pacific Islander, and 0.23% from two or more races. 0.39% of the population were Hispanic or Latino of any race. 25.9% were of German, 15.4% English, 14.4% American, 8.1% Scottish, 8.1% Irish, 6.7% Norwegian and 5.5% Scots-Irish ancestry.
There were 532 households out of which 28.80% had children under the age of 18 living with them, 60.30% were married couples living together, 4.50% had a female householder with no husband present, and 31.20% were non-families. 28.20% of all households were made up of individuals and 13.50% had someone living alone who was 65 years of age or older. The average household size was 2.38 and the average family size was 2.93.
In the county, the population was spread out with 24.50% under the age of 18, 7.10% from 18 to 24, 23.30% from 25 to 44, 25.80% from 45 to 64, and 19.30% who were 65 years of age or older. The median age was 42 years. For every 100 females there were 106.60 males. For every 100 females age 18 and over, there were 103.40 males.
The median income for a household in the county was $25,917, and the median income for a family was $31,111. Males had a median income of $20,474 versus $14,531 for females. The per capita income for the county was $13,930. About 16.70% of families and 21.50% of the population were below the poverty line, including 27.90% of those under age 18 and 17.40% of those age 65 or over.
2010 census
As of the 2010 United States Census, there were 1,206 people, 532 households, and 347 families residing in the county.[9] The population density was 0.3 inhabitants per square mile (0.12/km2). There were 844 housing units at an average density of 0.2 per square mile (0.077/km2).[10] The racial makeup of the county was 98.6% white, 0.4% American Indian, 0.2% black or African American, 0.1% Asian, 0.2% from other races, and 0.5% from two or more races. Those of Hispanic or Latino origin made up 0.2% of the population.[9] In terms of ancestry, 33.3% were German, 16.9% were Irish, 15.0% were Norwegian, 13.3% were English, 10.5% were American, 8.1% were Swedish, and 7.4% were Scottish.[11]
Of the 532 households, 22.6% had children under the age of 18 living with them, 57.0% were married couples living together, 5.1% had a female householder with no husband present, 34.8% were non-families, and 30.3% of all households were made up of individuals. The average household size was 2.27 and the average family size was 2.86. The median age was 46.4 years.[9]
The median income for a household in the county was $42,955 and the median income for a family was $54,375. Males had a median income of $37,813 versus $19,286 for females. The per capita income for the county was $22,424. About 8.1% of families and 10.7% of the population were below the poverty line, including 16.1% of those under age 18 and 8.9% of those age 65 or over.[12]
Politics
Like all of the High Plains outside of Native American counties, Garfield is an overwhelmingly, even almost unanimously Republican county. It was the most Republican county in Montana in the 2012 and 2016 United States presidential elections.
The last Democratic Presidential candidate to carry the county was Franklin D. Roosevelt in 1940,[13] and in the last seven Presidential elections no Democratic candidate has managed to receive more than 15.1 percent.[14] The last Democrat to pass so much as thirty percent was Lyndon Johnson during his 1964 landslide win over Barry Goldwater, and even then Goldwater won the county by double digits and it was his second-best county in the Treasure State behind Powder River.
In the 2000 presidential election Republican George W. Bush won 89% of the vote to Democrat Al Gore's 7%. In the 2004 presidential election, Garfield County gave 92.08% of its votes to President George W. Bush, with John Kerry receiving 6.21% of the vote. In the 2008 presidential election, Senator John McCain received 87.2% with Senator Barack Obama receiving 9.1%. In the 2012 presidential election, Governor Mitt Romney received 90.2% of the vote with president Barack Obama receiving only 6.4% of the vote. In the 2016 presidential election, Donald Trump received 91.20% of the vote while Hillary Clinton got 4.75% of the vote.[15]
Garfield County is also Republican at a local level. Democratic governor Brian Schweitzer has never received more than 28 percent of the county's vote and no Democratic gubernatorial candidate has carried the county in decades.[16] As part of the 15th district of the Montana Senate it is represented by Republican Jim Peterson and as part of the 30th district of the Montana House of Representatives it is represented by Republican Dave Kasten.[17]
| Year | Republican | Democratic | Third parties |
|---|---|---|---|
| 2016 | 91.0% 653 | 4.7% 34 | 4.3% 31 |
| 2012 | 88.7% 622 | 9.4% 66 | 1.9% 13 |
| 2008 | 82.3% 598 | 15.1% 110 | 2.6% 19 |
| 2004 | 90.1% 590 | 7.9% 52 | 2.0% 13 |
| 2000 | 87.5% 651 | 8.2% 61 | 4.3% 32 |
| 1996 | 75.3% 562 | 14.3% 107 | 10.3% 77 |
| 1992 | 49.2% 403 | 15.3% 125 | 35.5% 291 |
| 1988 | 74.2% 631 | 23.0% 196 | 2.8% 24 |
| 1984 | 84.5% 770 | 14.7% 134 | 0.8% 7 |
| 1980 | 78.0% 760 | 17.4% 169 | 4.6% 45 |
| 1976 | 67.8% 625 | 29.6% 273 | 2.6% 24 |
| 1972 | 77.8% 695 | 19.4% 173 | 2.8% 25 |
| 1968 | 64.2% 542 | 22.5% 190 | 13.3% 112 |
| 1964 | 56.8% 509 | 42.9% 384 | 0.3% 3 |
| 1960 | 58.5% 515 | 41.3% 363 | 0.2% 2 |
| 1956 | 56.8% 558 | 43.2% 424 | |
| 1952 | 72.7% 723 | 27.1% 269 | 0.2% 2 |
| 1948 | 51.5% 501 | 46.4% 451 | 2.2% 21 |
| 1944 | 53.5% 553 | 46.3% 478 | 0.2% 2 |
| 1940 | 49.2% 625 | 50.7% 644 | 0.2% 2 |
| 1936 | 34.8% 548 | 62.8% 991 | 2.4% 38 |
| 1932 | 38.0% 678 | 58.5% 1,044 | 3.5% 63 |
| 1928 | 69.7% 1,176 | 29.6% 499 | 0.8% 13 |
| 1924 | 50.6% 876 | 20.5% 355 | 29.0% 502 |
| 1920 | 68.2% 1,226 | 26.9% 484 | 4.9% 88 |
Communities
Town
- Jordan (county seat)
Unincorporated communities
See also
References
- ↑ http://genealogytrails.com/mon/countytimeline.html
- 1 2 "State & County QuickFacts". United States Census Bureau. Archived from the original on July 10, 2011. Retrieved September 15, 2013.
- ↑ "Find a County". National Association of Counties. Archived from the original on 2011-05-31. Retrieved 2011-06-07.
- ↑ David Quammen, "Local Bird Makes Good" (1995), collected in The Boilerplate Rhino (2000), ISBN 0-684-83728-5
- ↑ "2010 Census Gazetteer Files". United States Census Bureau. August 22, 2012. Archived from the original on December 5, 2014. Retrieved November 28, 2014.
- ↑ "Population and Housing Unit Estimates". Retrieved June 9, 2017.
- ↑ "U.S. Decennial Census". Census.gov. Archived from the original on May 12, 2015. Retrieved September 15, 2013.
- ↑ "American FactFinder". United States Census Bureau. Archived from the original on 2013-09-11. Retrieved 2008-01-31.
- 1 2 3 "DP-1 Profile of General Population and Housing Characteristics: 2010 Demographic Profile Data". United States Census Bureau. Retrieved 2016-01-10.
- ↑ "Population, Housing Units, Area, and Density: 2010 - County". United States Census Bureau. Retrieved 2016-01-10.
- ↑ "DP02 SELECTED SOCIAL CHARACTERISTICS IN THE UNITED STATES – 2006-2010 American Community Survey 5-Year Estimates". United States Census Bureau. Retrieved 2016-01-10.
- ↑ "DP03 SELECTED ECONOMIC CHARACTERISTICS – 2006-2010 American Community Survey 5-Year Estimates". United States Census Bureau. Retrieved 2016-01-10.
- ↑ Geographie Electorale
- ↑ The New York Times electoral map (Zoom in on Montana)
- ↑ "Montana Secretary of State". mtelectionresults.gov. Retrieved 2018-04-02.
- ↑ David Leip US Election Atlas
- ↑ Montana legislative site
- ↑ Leip, David. "Dave Leip's Atlas of U.S. Presidential Elections". uselectionatlas.org. Retrieved 2018-04-02.
External links
Places adjacent to Garfield County, Montana | ||||||||||
|---|---|---|---|---|---|---|---|---|---|---|
| ||||||||||
Municipalities and communities of Garfield County, Montana, United States | ||
|---|---|---|
| Town | | |
| Unincorporated communities | ||