United States presidential election in Alabama, 1968
|
|
|
All 10 Alabama electoral votes to the Electoral College |
|---|
|
|
 County results
|
Humphrey
40-50%
50-60%
60-70%
|
Wallace
40-50%
50-60%
60-70%
70-80%
80-90%
90-100%
|
|
|
The United States presidential election in Alabama, 1968 was held on November 5, 1968.
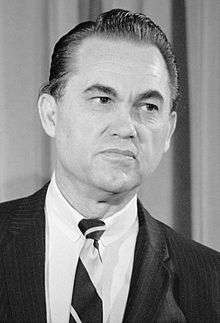
Southern segregationist candidate George Wallace, the former Governor of Alabama running as a third party candidate with his American Independent Party, won his home state in a high margin. Wallace received the official Democratic Party ballot line in Alabama, while national Democratic Party nominee Hubert H. Humphrey was forced to run on a fusion ticket of "Alabama Independent Democrat" and the
National Democratic party ballot line.[1]
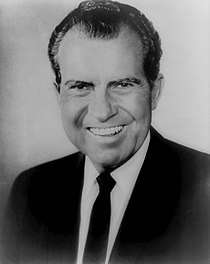
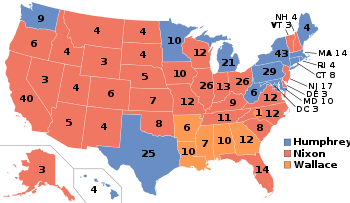
Wallace won 65.86% to Democrat Hubert Humphrey's 18.72 percent, a 47.13 percent margin. Republican Richard Nixon, while narrowly winning the election nationally, finished a distant third in Alabama with only 13.99 percent. Wallace's 65.88% of the popular vote would make Alabama his best performing state in the 1968 election.[2]
Wallace won 64 of the state's 67 counties. As African-Americans in the South were slowly gaining the right to vote as a result of federal civil rights legislation passed in 1964 and 1965, Wallace's weakest region was Alabama"s Black Belt, where he won most counties with narrow majorities or pluralities. He lost three counties in this region, Sumter County, Greene County, and Macon County, all with large black populations, to pro-civil rights candidate Hubert Humphrey. In black-majority Macon County, pro-civil rights Democrat Hubert Humphrey won a commanding landslide, taking 69.7% of the vote to Wallace's 25.4%, reflecting the deep divide between the state's white and black voter populations. As of the 2016 presidential election, this is the last election in which Mobile County, Shelby County, Baldwin County, Lee County, and Houston County were not carried by the Republican candidate and the last election in which Wilcox County, Lowndes County, and Bullock County were not carried by the Democratic candidate.
Results
Results by county
| County |
Wallace# |
Wallace% |
Nixon# |
Nixon% |
Humphrey# |
Humphrey% |
Others# |
Others% |
Total votes cast |
| Autauga |
5,523 |
71.03% |
606 |
7.79% |
1,553 |
19.97% |
94 |
1.21% |
7,776 |
| Baldwin |
14,167 |
76.98% |
2,154 |
11.70% |
1,821 |
9.89% |
262 |
1.42% |
18,404 |
| Barbour |
5,491 |
69.10% |
386 |
4.86% |
1,898 |
23.89% |
171 |
2.15% |
7,946 |
| Bibb |
3,746 |
80.16% |
263 |
5.63% |
652 |
13.95% |
12 |
0.26% |
4,673 |
| Blount |
6,536 |
71.93% |
2,013 |
22.15% |
331 |
3.64% |
206 |
2.27% |
9,086 |
| Bullock |
2,161 |
49.71% |
190 |
4.37% |
1,964 |
45.18% |
32 |
0.74% |
4,347 |
| Butler |
5,601 |
76.09% |
500 |
6.79% |
1,240 |
16.85% |
20 |
0.27% |
7,361 |
| Calhoun |
19,211 |
71.75% |
3,061 |
11.43% |
4,146 |
15.48% |
357 |
1.33% |
26,775 |
| Chambers |
7,885 |
74.14% |
1,082 |
10.17% |
1,358 |
12.77% |
311 |
2.92% |
10,636 |
| Cherokee |
4,773 |
83.96% |
343 |
6.03% |
462 |
8.13% |
107 |
1.88% |
5,685 |
| Chilton |
6,611 |
74.26% |
1,602 |
18.00% |
566 |
6.36% |
123 |
1.38% |
8,902 |
| Choctaw |
4,250 |
69.75% |
176 |
2.89% |
1,641 |
26.93% |
26 |
0.43% |
6,093 |
| Clarke |
6,168 |
71.50% |
488 |
5.66% |
1,717 |
19.90% |
253 |
2.93% |
8,626 |
| Clay |
4,048 |
80.25% |
706 |
14.00% |
256 |
5.08% |
34 |
0.67% |
5,044 |
| Cleburne |
3,314 |
82.95% |
485 |
12.14% |
160 |
4.01% |
36 |
0.90% |
3,995 |
| Coffee |
8,885 |
82.53% |
682 |
6.33% |
1,071 |
9.95% |
128 |
1.19% |
10,766 |
| Colbert |
11,341 |
72.60% |
1,727 |
11.06% |
2,291 |
14.67% |
262 |
1.68% |
15,621 |
| Conecuh |
3,828 |
71.60% |
186 |
3.48% |
1,151 |
21.53% |
181 |
3.39% |
5,346 |
| Coosa |
2,830 |
74.26% |
330 |
8.66% |
623 |
16.35% |
28 |
0.73% |
3,811 |
| Covington |
11,419 |
86.98% |
831 |
6.33% |
791 |
6.03% |
87 |
0.66% |
13,128 |
| Crenshaw |
4,513 |
82.35% |
209 |
3.81% |
726 |
13.25% |
32 |
0.58% |
5,480 |
| Cullman |
11,063 |
64.08% |
4,964 |
28.75% |
1,115 |
6.46% |
123 |
0.71% |
17,265 |
| Dale |
8,109 |
83.55% |
607 |
6.25% |
862 |
8.88% |
127 |
1.31% |
9,705 |
| Dallas |
8,798 |
52.89% |
1,246 |
7.49% |
6,516 |
39.17% |
76 |
0.46% |
16,636 |
| DeKalb |
8,144 |
54.81% |
5,314 |
35.76% |
1,274 |
8.57% |
127 |
0.85% |
14,859 |
| Elmore |
9,038 |
76.52% |
801 |
6.78% |
1,745 |
14.77% |
228 |
1.93% |
11,812 |
| Escambia |
8,474 |
78.72% |
680 |
6.32% |
1,492 |
13.86% |
119 |
1.11% |
10,765 |
| Etowah |
21,416 |
68.67% |
4,351 |
13.95% |
4,613 |
14.79% |
806 |
2.58% |
31,186 |
| Fayette |
4,683 |
75.07% |
827 |
13.26% |
676 |
10.84% |
52 |
0.83% |
6,238 |
| Franklin |
5,909 |
64.96% |
2,524 |
27.75% |
588 |
6.46% |
75 |
0.82% |
9,096 |
| Geneva |
7,871 |
91.73% |
284 |
3.31% |
380 |
4.43% |
46 |
0.54% |
8,581 |
| Greene |
1,555 |
39.18% |
180 |
4.54% |
2,229 |
56.16% |
5 |
0.13% |
3,969 |
| Hale |
2,934 |
55.78% |
266 |
5.06% |
2,003 |
38.08% |
57 |
1.08% |
5,260 |
| Henry |
4,233 |
79.99% |
84 |
1.59% |
955 |
18.05% |
20 |
0.38% |
5,292 |
| Houston |
13,872 |
83.89% |
974 |
5.89% |
1,488 |
9.00% |
202 |
1.22% |
16,536 |
| Jackson |
8,504 |
77.96% |
1,191 |
10.92% |
1,022 |
9.37% |
191 |
1.75% |
10,908 |
| Jefferson |
106,233 |
51.81% |
39,752 |
19.39% |
55,845 |
27.24% |
3,203 |
1.56% |
205,033 |
| Lamar |
5,229 |
88.25% |
364 |
6.14% |
302 |
5.10% |
30 |
0.51% |
5,925 |
| Lauderdale |
13,467 |
71.32% |
2,952 |
15.63% |
2,166 |
11.47% |
298 |
1.58% |
18,883 |
| Lawrence |
6,253 |
83.05% |
580 |
7.70% |
650 |
8.63% |
46 |
0.61% |
7,529 |
| Lee |
7,721 |
58.78% |
2,366 |
18.01% |
2,803 |
21.34% |
246 |
1.87% |
13,136 |
| Limestone |
8,430 |
81.25% |
870 |
8.39% |
889 |
8.57% |
186 |
1.79% |
10,375 |
| Lowndes |
1,822 |
55.84% |
234 |
7.17% |
1,127 |
34.54% |
80 |
2.45% |
3,263 |
| Macon |
1,619 |
25.37% |
257 |
4.03% |
4,450 |
69.74% |
55 |
0.86% |
6,381 |
| Madison |
29,823 |
57.40% |
13,213 |
25.43% |
8,004 |
15.41% |
913 |
1.76% |
51,953 |
| Marengo |
5,185 |
56.64% |
457 |
4.99% |
3,479 |
38.01% |
33 |
0.36% |
9,154 |
| Marion |
6,415 |
76.34% |
1,492 |
17.76% |
365 |
4.34% |
131 |
1.56% |
8,403 |
| Marshall |
12,742 |
76.39% |
2,725 |
16.34% |
955 |
5.73% |
258 |
1.55% |
16,680 |
| Mobile |
61,673 |
67.08% |
10,509 |
11.43% |
18,615 |
20.25% |
1,139 |
1.24% |
91,936 |
| Monroe |
5,217 |
71.23% |
375 |
5.12% |
1,673 |
22.84% |
59 |
0.81% |
7,324 |
| Montgomery |
27,202 |
58.47% |
6,746 |
14.50% |
12,088 |
25.98% |
489 |
1.05% |
46,525 |
| Morgan |
16,841 |
75.60% |
3,043 |
13.66% |
1,878 |
8.43% |
515 |
2.31% |
22,277 |
| Perry |
2,768 |
49.85% |
308 |
5.55% |
2,457 |
44.25% |
20 |
0.36% |
5,553 |
| Pickens |
4,549 |
71.89% |
321 |
5.07% |
1,434 |
22.66% |
24 |
0.38% |
6,328 |
| Pike |
6,038 |
72.39% |
658 |
7.89% |
1,565 |
18.76% |
80 |
0.96% |
8,341 |
| Randolph |
5,103 |
75.00% |
839 |
12.33% |
666 |
9.79% |
196 |
2.88% |
6,804 |
| Russell |
7,584 |
67.44% |
704 |
6.26% |
2,707 |
24.07% |
250 |
2.22% |
11,245 |
| St. Clair |
7,050 |
72.70% |
1,635 |
16.86% |
869 |
8.96% |
143 |
1.47% |
9,697 |
| Shelby |
7,736 |
71.83% |
1,706 |
15.84% |
1,105 |
10.26% |
223 |
2.07% |
10,770 |
| Sumter |
2,158 |
44.89% |
303 |
6.30% |
2,336 |
48.60% |
10 |
0.21% |
4,807 |
| Talladega |
13,505 |
72.00% |
1,935 |
10.32% |
3,099 |
16.52% |
217 |
1.16% |
18,756 |
| Tallapoosa |
9,043 |
76.50% |
1,205 |
10.19% |
1,331 |
11.26% |
242 |
2.05% |
11,821 |
| Tuscaloosa |
18,611 |
65.60% |
3,822 |
13.47% |
5,556 |
19.58% |
382 |
1.35% |
28,371 |
| Walker |
14,416 |
74.37% |
2,628 |
13.56% |
1,971 |
10.17% |
370 |
1.91% |
19,385 |
| Washington |
4,545 |
79.98% |
200 |
3.52% |
902 |
15.87% |
36 |
0.63% |
5,683 |
| Wilcox |
2,511 |
56.62% |
237 |
5.34% |
1,658 |
37.38% |
29 |
0.65% |
4,435 |
| Winston |
3,032 |
54.86% |
2,174 |
39.33% |
258 |
4.67% |
63 |
1.14% |
5,527 |
| Totals | 691,425 | 65.86% | 146,923 | 13.99% | 196,579 | 18.72% | 14,982 | 1.43% | 1,049,909 |
Notes
- ↑ Although he was born in California and he served as a U.S. Senator from California, in 1968 Richard Nixon's official state of residence was New York, because he moved there to practice law after his defeat in the 1962 California gubernatorial election. During his first term as president, Nixon re-established his residency in California. Consequently, most reliable reference books list Nixon's home state as New York in the 1968 election and his home state as California in the 1972 (and 1960) election.
See also
|
|---|
| Candidates | | |
|---|
General
articles | |
|---|
Local
results | |
|---|
Other 1968
elections | |
|---|
|
|---|
|
- See also
- Presidential elections
- Senate elections
- House elections
- Gubernatorial elections
|