New London County, Connecticut
| New London County, Connecticut | |
|---|---|
| County of Connecticut | |
| County of New London | |
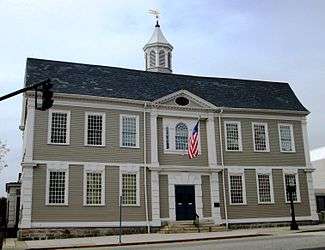 Former New London County Courthouse | |
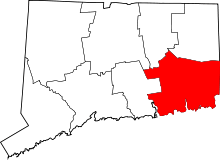 Location in the U.S. state of Connecticut | |
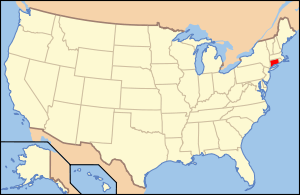 Connecticut's location in the U.S. | |
| Founded | 1646 by John Winthrop, Jr. |
| Seat |
none (since 1960) New London (before 1960) |
| Largest city | Norwich |
| Area | |
| • Total | 772 sq mi (1,999 km2) |
| • Land | 665 sq mi (1,722 km2) |
| • Water | 107 sq mi (277 km2), 13.8% |
| Population (est.) | |
| • (2017) | 269,033 |
| • Density | 412/sq mi (159/km2) |
| Congressional district | 2nd |
| Time zone | Eastern: UTC−5/−4 |
New London County is a county located in the southeastern corner of the U.S. state of Connecticut. The population was 274,055 as of the 2010 census.[1]
New London County comprises the Norwich-New London, CT Metropolitan Statistical Area, which is also included in the Hartford-West Hartford, CT Combined Statistical Area.
There is no county government and no county seat, as is the case with all eight of Connecticut's counties. In Connecticut, towns are responsible for all local government activities, including fire and rescue, snow removal, and schools. In a few cases, neighboring Towns will share certain resources (e.g., water, gas, etc.). New London County is merely a group of towns on a map; it has no governmental authority.
New London County contains reservations of four of the five state-recognized Indian tribes, although the Paugassett were historically located further west.
History
Southeastern New England was dominated by the Pequot people at the time of English colonization. They spoke the Mohegan-Pequot language and were one of the Algonquian-speaking tribes in the coastal areas. After years of conflict, the Colonists and their Indian allies defeated the Pequots in the Pequot War of 1637, ending their dominance. Two descendant Pequot tribes are recognized by the state today, as are three other tribes, all descended from Algonquian peoples.
New London County was one of four original counties in Connecticut that were established on May 10, 1666 by an act of the Connecticut General Court, which states:
- This Court orders that from the Paukatuck River wth
- Norridge to ye west bounds of Homonoscet Plantation[2] shalbe
- for future one County, wch County is called the County of
- N: London. And it is ordered that the County Court shalbe
- held at N. London the first Wednesday in June and the third
- Thursday in Septemb[e]r yearly.[3]
As established in 1666, New London County consisted of the towns of Stonington, Norwich, New London, and Saybrook. The "Homonoscet Plantation" was settled in March 1663, at first as Kenilworth; but it was incorporated as the town of Killingworth in 1667.[4] Several new towns were incorporated and added to New London over the next few decades: Preston in 1687, Colchester in 1699, and Lebanon in 1700. The settlements along the Quinebaug Valley were placed in New London County in 1697 (later incorporated as Plainfield in 1699). By 1717, more towns were established in northeastern Connecticut and added to New London County, between the Quinebaug Valley and the Rhode Island border.
Windham County was constituted from Hartford and New London counties on 12 May 1726, consisting of towns in northeastern Connecticut. New London County lost the towns of Voluntown, Pomfret, Killingly, Canterbury, Plainfield, and Lebanon to the newly formed county. In 1785, Middlesex County was constituted, consisting of towns along the lower Connecticut River Valley, taking away the towns of Killingworth and Saybrook from New London County. Several additional boundary adjustments took place in the 19th century: the establishment of the town of Marlborough in 1803, the transfer of the town of Lebanon from Windham County in 1824, and the transfer of the town of Voluntown from Windham County in 1881.[5]
Geography
According to the U.S. Census Bureau, the county has a total area of 772 square miles (2,000 km2), of which 665 square miles (1,720 km2) is land and 107 square miles (280 km2) (13.8%) is water.[6]
The terrain of the county is mostly level, becoming more elevated only in its northern extreme. The highest point in the county is Gates Hill in the Town of Lebanon at approximately 660 feet (201 m) above sea level, and the lowest point is sea level.
Adjacent counties
- Windham County (north)
- Kent County, Rhode Island (northeast)
- Washington County, Rhode Island (east)
- Middlesex County (west)
- Tolland County (northwest)
- Hartford County (northwest)
- Suffolk County, New York (south)
Government and municipal services
As of 1960, counties in Connecticut do not have any associated county government structure. All municipal services are provided by the towns. Regional councils of governments were established throughout the state in 1989 in order to address regional issues concerning infrastructure, land use, and economic development. Most of the towns of New London County are part of the Southeastern Connecticut Council of Governments, the exceptions being the towns of Lyme, Old Lyme, and Lebanon. Lyme and Old Lyme are part of the Connecticut River Estuary Regional Planning Agency, while Lebanon is part of the Windham Regional Council of Governments.
Judicial
The geographic area of the county is coterminous with the New London judicial district, with the superior courts located in the cities of New London and Norwich.
Law enforcement
Law enforcement within the geographic area of the county is provided by the respective town police departments. Prior to 2000, a County Sheriff's Department existed for the purpose of executing judicial warrants, prisoner transport, and court security. These responsibilities have now been taken over by the Connecticut State Marshal System.
Fire protection
Fire protection in the county is provided by the towns. Several towns also have fire districts that provide services to a section of the town.
Water service
Water service to 12 of the 21 towns of New London County is provided by a regional non-profit public corporation known as the Southeastern Water Authority. The Southeastern Water Authority supplies water to participating towns within New London County and is one of only two such county-wide public water service providers in the state. Seven towns receive water service from one or more private corporations. The city of Norwich and most of the town of Groton provide for their own water service.
Garbage disposal
Several towns in New London County have organized the Southeastern Connecticut Regional Resources Recovery Authority. The participating towns are East Lyme, Griswold, Groton, Ledyard, Montville, New London, North Stonington, Norwich, Preston, Sprague, Stonington, and Waterford.
Education
Education in the county area is usually provided by the individual town governments. The less populated towns of Lyme and Old Lyme have joined together to form a single, regional school district (Region 18).
Politics
| Year | GOP | DEM | Others |
|---|---|---|---|
| 2016 | 43.8% 54,058 | 50.4% 62,278 | 5.8% 7,192 |
| 2012 | 40.1% 46,119 | 58.3% 67,144 | 1.6% 1,839 |
| 2008 | 38.8% 48,491 | 59.9% 74,776 | 1.3% 1,607 |
| 2004 | 42.2% 49,931 | 55.8% 66,062 | 2.0% 2,367 |
| 2000 | 37.7% 41,168 | 55.4% 60,449 | 6.9% 7,530 |
| 1996 | 32.1% 33,039 | 52.7% 54,377 | 15.2% 15,679 |
| 1992 | 29.4% 34,567 | 42.3% 49,808 | 28.4% 33,392 |
| 1988 | 51.2% 52,681 | 47.5% 48,882 | 1.3% 1,288 |
| 1984 | 61.6% 63,121 | 37.9% 38,857 | 0.5% 509 |
| 1980 | 48.0% 47,217 | 37.2% 36,628 | 14.8% 14,603 |
| 1976 | 50.4% 47,231 | 49.0% 45,908 | 0.6% 581 |
| 1972 | 63.4% 58,516 | 35.7% 32,935 | 0.9% 850 |
| 1968 | 44.4% 37,116 | 49.7% 41,507 | 5.9% 4,951 |
| 1964 | 30.9% 24,391 | 69.1% 54,551 | 0.1% 49 |
| 1960 | 48.4% 38,070 | 51.6% 40,625 | 0.0% 1 |
| 1956 | 61.4% 43,453 | 38.6% 27,317 | 0.0% 0 |
| 1952 | 54.8% 38,148 | 45.0% 31,374 | 0.2% 148 |
| 1948 | 47.4% 27,416 | 50.9% 29,425 | 1.7% 973 |
| 1944 | 44.9% 24,153 | 54.5% 29,304 | 0.5% 285 |
| 1940 | 45.2% 23,389 | 54.6% 28,286 | 0.2% 98 |
| 1936 | 44.8% 21,367 | 52.4% 24,999 | 2.8% 1,337 |
| 1932 | 49.1% 19,721 | 48.8% 19,576 | 2.1% 858 |
| 1928 | 56.3% 21,378 | 42.9% 16,299 | 0.8% 292 |
| 1924 | 62.3% 18,205 | 29.5% 8,615 | 8.2% 2,381 |
| 1920 | 63.3% 17,422 | 33.5% 9,209 | 3.2% 889 |
| 1916 | 48.5% 8,283 | 48.7% 8,322 | 2.8% 469 |
| 1912 | 35.1% 5,543 | 44.0% 6,942 | 20.9% 3,292 |
| 1908 | 58.7% 9,941 | 38.7% 6,549 | 2.6% 446 |
| 1904 | 58.2% 10,385 | 39.8% 7,093 | 2.0% 357 |
| 1900 | 57.4% 9,582 | 40.9% 6,824 | 1.7% 290 |
| 1896 | 66.9% 8,395 | 26.7% 3,352 | 6.4% 806 |
| 1892 | 49.3% 6,186 | 47.1% 5,902 | 3.6% 455 |
| 1888 | 49.2% 6,080 | 46.9% 5,790 | 3.9% 484 |
| 1884 | 46.1% 5,442 | 50.0% 5,912 | 3.9% 464 |
Demographics
| Historical population | |||
|---|---|---|---|
| Census | Pop. | %± | |
| 1790 | 32,918 | — | |
| 1800 | 34,888 | 6.0% | |
| 1810 | 34,707 | −0.5% | |
| 1820 | 35,943 | 3.6% | |
| 1830 | 42,201 | 17.4% | |
| 1840 | 44,463 | 5.4% | |
| 1850 | 51,821 | 16.5% | |
| 1860 | 61,731 | 19.1% | |
| 1870 | 66,570 | 7.8% | |
| 1880 | 73,152 | 9.9% | |
| 1890 | 76,634 | 4.8% | |
| 1900 | 82,758 | 8.0% | |
| 1910 | 91,253 | 10.3% | |
| 1920 | 104,611 | 14.6% | |
| 1930 | 118,966 | 13.7% | |
| 1940 | 125,224 | 5.3% | |
| 1950 | 144,821 | 15.6% | |
| 1960 | 185,745 | 28.3% | |
| 1970 | 230,654 | 24.2% | |
| 1980 | 238,409 | 3.4% | |
| 1990 | 254,957 | 6.9% | |
| 2000 | 259,088 | 1.6% | |
| 2010 | 274,055 | 5.8% | |
| Est. 2017 | 269,033 | [8] | −1.8% |
| U.S. Decennial Census[9] 1790-1960[10] 1900-1990[11] 1990-2000[12] 2010-2016[1] | |||
2000 census
As of the census[13] of 2000, there were 259,088 people, 99,835 households, and 67,188 families residing in the county. The population density was 389 people per square mile (150/km²). There were 110,674 housing units at an average density of 166 per square mile (64/km²). The racial makeup of the county was 87.00% White, 5.29% Black or African American, 0.96% Native American, 1.96% Asian, 0.06% Pacific Islander, 2.05% from other races, and 2.68% from two or more races. 5.11% of the population were Hispanic or Latino of any race. 13.8% were of Irish, 12.7% Italian, 10.8% English, 7.9% German, 7.1% Polish and 6.4% French ancestry according to their self-identification in the Census 2000. 90.1% spoke English, 4.5% Spanish and 1.1% French as their first language.
There were 99,835 households out of which 32.40% had children under the age of 18 living with them, 52.50% were married couples living together, 11.00% had a female householder with no husband present, and 32.70% were non-families. 26.40% of all households were made up of individuals and 9.50% had someone living alone who was 65 years of age or older. The average household size was 2.48 and the average family size was 3.00.
In the county, the population was spread out with 24.40% under the age of 18, 8.60% from 18 to 24, 31.20% from 25 to 44, 22.80% from 45 to 64, and 13.00% who were 65 years of age or older. The median age was 37 years. For every 100 females there were 97.90 males. For every 100 females age 18 and over, there were 96.50 males.
The median income for a household in the county was $50,646, and the median income for a family was $59,857. Males had a median income of $41,292 versus $30,525 for females. The per capita income for the county was $24,678. About 4.50% of families and 6.40% of the population were below the poverty line, including 7.80% of those under age 18 and 6.60% of those age 65 or over.
2010 census
As of the 2010 United States Census, there were 274,055 people, 107,057 households, and 69,862 families residing in the county.[14] The population density was 412.2 inhabitants per square mile (159.2/km2). There were 120,994 housing units at an average density of 182.0 per square mile (70.3/km2).[15] The racial makeup of the county was 82.2% white, 5.8% black or African American, 4.2% Asian, 0.9% American Indian, 0.1% Pacific islander, 3.2% from other races, and 3.7% from two or more races. Those of Hispanic or Latino origin made up 8.5% of the population.[14] In terms of ancestry, 18.9% were Irish, 15.2% were Italian, 14.8% were English, 11.6% were German, 9.6% were Polish, and 3.7% were American.[16]
Of the 107,057 households, 31.3% had children under the age of 18 living with them, 48.7% were married couples living together, 11.8% had a female householder with no husband present, 34.7% were non-families, and 27.6% of all households were made up of individuals. The average household size was 2.44 and the average family size was 2.98. The median age was 40.4 years.[14]
The median income for a household in the county was $65,419 and the median income for a family was $80,425. Males had a median income of $54,352 versus $41,721 for females. The per capita income for the county was $32,888. About 5.0% of families and 7.2% of the population were below the poverty line, including 9.7% of those under age 18 and 5.6% of those age 65 or over.[17]
Demographic breakdown by town
Income
Data is from the 2010 United States Census and the 2006-2010 American Community Survey 5-Year Estimates.[18][19]
| Rank | Town | Per capita income |
Median household income |
Median family income |
Population | Number of households | |
|---|---|---|---|---|---|---|---|
| 1 | Lyme | Town | $64,506 | $88,500 | $98,500 | 2,406 | 1,033 |
| 2 | Stonington | Borough | $64,224 | $74,583 | $96,667 | 929 | 531 |
| 3 | Old Lyme | Town | $52,037 | $92,024 | $107,174 | 7,603 | 3,172 |
| 4 | Stonington | Town | $42,184 | $72,445 | $86,029 | 18,545 | 8,115 |
| 5 | Salem | Town | $41,414 | $95,000 | $106,875 | 4,151 | 1,525 |
| 6 | North Stonington | Town | $39,588 | $88,869 | $96,125 | 5,297 | 2,052 |
| 7 | Bozrah | Town | $38,339 | $75,000 | $99,625 | 2,627 | 1,007 |
| 8 | Waterford | Town | $37,690 | $69,810 | $91,893 | 19,517 | 8,005 |
| 9 | Ledyard | Town | $37,663 | $85,321 | $97,152 | 15,051 | 5,634 |
| 10 | East Lyme | Town | $37,019 | $79,815 | $102,864 | 19,159 | 7,192 |
| 11 | Colchester | Town | $35,479 | $92,431 | $101,860 | 16,068 | 5,915 |
| 12 | Lebanon | Town | $34,608 | $72,431 | $80,566 | 7,308 | 2,644 |
| 13 | Lisbon | Town | $33,685 | $77,872 | $86,469 | 4,338 | 1,659 |
| 14 | Preston | Town | $32,956 | $77,377 | $86,435 | 4,726 | 1,869 |
| 15 | Voluntown | Town | $32,760 | $73,980 | $76,197 | 2,603 | 1,002 |
| 16 | Franklin | Town | $31,518 | $74,226 | $87,237 | 1,922 | 729 |
| 17 | Sprague | Town | $31,226 | $68,241 | $78,438 | 2,984 | 1,135 |
| 18 | Groton | Town | $31,110 | $56,904 | $67,465 | 40,115 | 15,809 |
| 19 | Griswold | Town | $29,421 | $59,295 | $75,870 | 11,951 | 4,646 |
| 20 | Groton | City | $28,872 | $49,464 | $52,366 | 10,389 | 4,182 |
| 21 | Montville | Town | $28,492 | $65,349 | $80,156 | 19,571 | 6,942 |
| 22 | Norwich | City | $26,702 | $52,186 | $62,616 | 40,493 | 16,599 |
| 23 | Jewett City | Borough | $23,876 | $39,334 | $55,781 | 3,487 | 1,466 |
| 24 | New London | City | $21,110 | $43,551 | $49,811 | 27,620 | 10,373 |
Race
Data is from the 2007-2011 American Community Survey 5-Year Estimates, ACS Demographic and Housing Estimates, "Race alone or in combination with one or more other races."[20]
| Rank | Town | Population | White | Black | Asian | American Indian |
Other | Hispanic | |
|---|---|---|---|---|---|---|---|---|---|
| 1 | Groton | Town | 40,190 | 83.9% | 9.1% | 6.1% | 2.4% | 4.8% | 9.4% |
| 2 | Norwich | City | 40,085 | 79.4% | 14.5% | 8.3% | 2.2% | 5.6% | 10.0% |
| 3 | New London | City | 27,550 | 64.5% | 20.4% | 5.0% | 2.5% | 13.5% | 27.7% |
| 4 | Montville | Town | 19,505 | 82.8% | 6.2% | 7.1% | 4.0% | 3.8% | 6.8% |
| 5 | Waterford | Town | 19,451 | 92.9% | 3.7% | 3.5% | 0.4% | 1.7% | 4.1% |
| 6 | East Lyme | Town | 19,080 | 85.9% | 5.8% | 5.5% | 1.1% | 4.1% | 6.7% |
| 7 | Stonington | Town | 18,482 | 96.0% | 2.2% | 2.2% | 0.7% | 1.3% | 2.7% |
| 8 | Colchester | Town | 15,929 | 97.3% | 3.3% | 0.6% | 0.8% | 0.3% | 3.8% |
| 9 | Ledyard | Town | 15,016 | 91.7% | 2.3% | 5.2% | 4.4% | 0.9% | 4.0% |
| 10 | Griswold | Town | 11,837 | 94.6% | 2.3% | 3.3% | 0.7% | 0.9% | 5.2% |
| 11 | Groton | City | 10,305 | 78.8% | 14.9% | 6.3% | 2.5% | 5.2% | 11.0% |
| 12 | Old Lyme | Town | 7,583 | 99.1% | 0.5% | 0.8% | 1.5% | 0.3% | 1.5% |
| 13 | Lebanon | Town | 7,268 | 98.5% | 1.1% | 2.3% | 2.1% | 0.6% | 3.9% |
| 14 | North Stonington | Town | 5,272 | 96.6% | 1.9% | 1.1% | 0.9% | 0.5% | 3.5% |
| 15 | Preston | Town | 4,729 | 89.8% | 1.6% | 8.5% | 3.3% | 1.0% | 2.5% |
| 16 | Lisbon | Town | 4,322 | 96.8% | 2.3% | 1.9% | 3.6% | 0.0% | 0.2% |
| 17 | Salem | Town | 4,118 | 94.3% | 1.0% | 6.7% | 1.8% | 0.5% | 4.8% |
| 18 | Jewett City | Borough | 3,445 | 86.8% | 6.6% | 8.4% | 0.5% | 1.2% | 8.2% |
| 19 | Sprague | Town | 2,983 | 90.5% | 0.6% | 6.1% | 0.0% | 2.7% | 2.7% |
| 20 | Bozrah | Town | 2,603 | 94.7% | 2.9% | 1.6% | 1.5% | 1.0% | 2.7% |
| 21 | Voluntown | Town | 2,603 | 98.4% | 2.6% | 1.2% | 5.1% | 0.2% | 1.1% |
| 22 | Lyme | Town | 2,327 | 97.6% | 0.0% | 0.3% | 0.0% | 2.8% | 1.5% |
| 23 | Franklin | Town | 1,958 | 98.8% | 0.1% | 0.2% | 3.9% | 0.2% | 2.1% |
| 24 | Stonington | Borough | 1,069 | 98.4% | 0.8% | 0.7% | 0.0% | 0.1% | 3.2% |
Communities
Cities
Towns
Villages are named localities within towns, but have no separate corporate existence from the towns they are in.
- Bozrah
- Colchester
- East Lyme
- Franklin
- Griswold
- Groton
- Lebanon
- Ledyard
- Lisbon
- Lyme
- Montville
- Chesterfield
- Mohegan
- Oakdale
- Oxoboxo River
- Uncasville
- North Stonington
- Old Lyme
- Preston
- Salem
- Sprague
- Stonington
- Voluntown
- Waterford
See also
References
- 1 2 "State & County QuickFacts". United States Census Bureau. Archived from the original on July 15, 2011. Retrieved June 11, 2014.
- ↑ The Hammonasset River still bears this Indian place name.
- ↑ "CCR: Volume 02, Page 39". Archived from the original on 2007-04-28. Retrieved 2008-06-17.
- ↑ Frances Manwaring Caulkins, History of New London, Connecticut: From the first survey of the coast in 1612, to 1852 (New Haven) 1852, p. 249: "New London County extended from Pawkatuck River to the west bounds of Hammonasset Plantation (Killingworth), including all the eastern parts of the colony".
- ↑ Newberry Library -- Connecticut Atlas of Historical County Boundaries Archived 2013-11-10 at the Wayback Machine.
- ↑ "US Gazetteer files: 2010, 2000, and 1990". United States Census Bureau. 2011-02-12. Retrieved 2011-04-23.
- ↑ Leip, David. "Dave Leip's Atlas of U.S. Presidential Elections". uselectionatlas.org. Retrieved May 26, 2017.
- ↑ "Population and Housing Unit Estimates". Retrieved Apr 8, 2018.
- ↑ "U.S. Decennial Census". United States Census Bureau. Archived from the original on May 12, 2015. Retrieved June 11, 2014.
- ↑ "Historical Census Browser". University of Virginia Library. Retrieved June 11, 2014.
- ↑ "Population of Counties by Decennial Census: 1900 to 1990". United States Census Bureau. Retrieved June 11, 2014.
- ↑ "Census 2000 PHC-T-4. Ranking Tables for Counties: 1990 and 2000" (PDF). United States Census Bureau. Retrieved June 11, 2014.
- ↑ "American FactFinder". United States Census Bureau. Archived from the original on 2013-09-11. Retrieved 2011-05-14.
- 1 2 3 "DP-1 Profile of General Population and Housing Characteristics: 2010 Demographic Profile Data". United States Census Bureau. Retrieved 2016-01-12.
- ↑ "Population, Housing Units, Area, and Density: 2010 - County". United States Census Bureau. Retrieved 2016-01-12.
- ↑ "DP02 SELECTED SOCIAL CHARACTERISTICS IN THE UNITED STATES – 2006-2010 American Community Survey 5-Year Estimates". United States Census Bureau. Retrieved 2016-01-12.
- ↑ "DP03 SELECTED ECONOMIC CHARACTERISTICS – 2006-2010 American Community Survey 5-Year Estimates". United States Census Bureau. Retrieved 2016-01-12.
- ↑ "SELECTED ECONOMIC CHARACTERISTICS 2006-2010 American Community Survey 5-Year Estimates". U.S. Census Bureau. Retrieved 2012-11-25.
- ↑ "Profile of General Population and Housing Characteristics: 2010 Demographic Profile Data". U.S. Census Bureau. Archived from the original on 2014-03-05. Retrieved 2012-11-25.
- ↑ "ACS DEMOGRAPHIC AND HOUSING ESTIMATES 2007-2011 American Community Survey 5-Year Estimates". U.S. Census Bureau. Retrieved 2013-01-08.
External links
Places adjacent to New London County, Connecticut | ||||||||||
|---|---|---|---|---|---|---|---|---|---|---|
| ||||||||||
Municipalities and communities of New London County, Connecticut, United States | ||
|---|---|---|
| Cities | | |
| Towns | ||
| Boroughs | ||
| CDPs | ||
| Other communities | ||
| Indian reservations | ||
| Footnotes | ‡This populated place also has portions in an adjacent county or counties | |