Demographics of Europe
Figures for the population of Europe vary according to the particular definition of Europe's boundaries. According to the United Nations, the population within the standard physical geographical boundaries comprised 737 million in 2010.[1] In 2010 the population was 711 million, defining Europe's boundaries as the continental divides of the Caucasus and Ural mountains and the Bosporous, and including the European parts of the countries of Russia and of Turkey.
.svg.png)
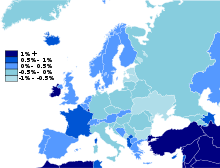
Europe's population growth is comparatively low, and its median age comparatively high, in relation to the world's other continents, especially compared to Asia, Africa and Latin America. Most of Europe is in a mode of sub-replacement fertility, which means that each new(-born) generation is becoming less populous than the older.[2] Nonetheless most European countries still have growing populations due to immigration, population momentum and increases in life expectancy. Some current and past factors in European demography have included emigration, ethnic relations, economic immigration, a declining birth rate and an ageing population.
History
Estimates for historical population sizes of Europe (including Central Asia, listed under "former USSR") based on Maddison (2007),[3] in millions, with estimated percentage of world population:
| AD 1 | 1000 | 1500 | 1600 | 1700 | 1820 | 1913 | 2000 |
|---|---|---|---|---|---|---|---|
| 34 (15%) | 40 (15%) | 78 (18%) | 112 (20%) | 127 (21%) | 224 (21%) | 498 (28%) | 742 (13%) |
Population of Western and Eastern Europe and former USSR, 0–1998 (in thousands)
Source: Maddison and others. (University of Groningen).[4]
| Year | 0 | 1000 | 1500 | 1600 | 1700 | 1820 | 1870 | 1913 | 1950 | 1973 | 1998[4] |
|---|---|---|---|---|---|---|---|---|---|---|---|
| Austria | 500 | 700 | 2000 | 2500 | 2500 | 3369 | 4520 | 6767 | 6935 | 7586 | 8078 |
| Belgium | 300 | 400 | 1400 | 1600 | 2000 | 3424 | 5096 | 7666 | 8640 | 9738 | 10197 |
| Denmark | 180 | 360 | 600 | 650 | 700 | 1155 | 1888 | 2983 | 4269 | 5022 | 5303 |
| Finland | 20 | 40 | 300 | 400 | 400 | 1169 | 1754 | 3027 | 4009 | 4666 | 5153 |
| France | 5000 | 6500 | 15000 | 18500 | 21471 | 31246 | 38440 | 41463 | 41836 | 52118 | 58805 |
| Germany | 3000 | 3500 | 12000 | 16000 | 15000 | 24905 | 39231 | 65058 | 68371 | 78956 | 82029 |
| Italy | 7000 | 5000 | 10500 | 13100 | 13300 | 20176 | 27888 | 37248 | 47105 | 54751 | 57592 |
| Netherlands | 200 | 300 | 950 | 1500 | 1900 | 2355 | 3615 | 6164 | 10114 | 13438 | 15700 |
| Norway | 100 | 200 | 300 | 400 | 500 | 970 | 1735 | 2447 | 3265 | 3961 | 4432 |
| Sweden | 200 | 400 | 550 | 760 | 1260 | 2585 | 4164 | 5621 | 7015 | 8137 | 8851 |
| Switzerland | 300 | 300 | 650 | 1000 | 1200 | 1829 | 2664 | 3864 | 4694 | 6441 | 7130 |
| United Kingdom | 800 | 2000 | 3942 | 6170 | 8565 | 21226 | 31393 | 45649 | 50363 | 56223 | 59237 |
| Portugal | 500 | 600 | 1000 | 1100 | 2000 | 3297 | 4353 | 6004 | 8512 | 8634 | 9968 |
| Spain | 4500 | 4000 | 6800 | 8240 | 8770 | 12203 | 16201 | 20263 | 27868 | 34810 | 39371 |
| Greece | 2000 | 1000 | 1000 | 1500 | 1500 | 2312 | |||||
| 13 Small Countries | 100 | 113 | 276 | 358 | 394 | 657 | |||||
| Total Western Europe | 24700 | 25413 | 57268 | 73778 | 81460 | 132888 | 187532 | 261007 | 305060 | 358390 | 388399 |
| Albania | 200 | 200 | 200 | 200 | 300 | 437 | |||||
| Bulgaria | 500 | 800 | 800 | 1250 | 1250 | 2187 | |||||
| Czechoslovakia | 1000 | 1250 | 3000 | 4500 | 4500 | 7190 | |||||
| Hungary | 300 | 500 | 1250 | 1250 | 1500 | 4571 | |||||
| Poland | 450 | 1200 | 4000 | 5000 | 6000 | 10426 | |||||
| Romania | 800 | 800 | 2000 | 2000 | 2500 | 6389 | |||||
| Yugoslavia | 1500 | 1750 | 2250 | 2750 | 2750 | 5215 | |||||
| Eastern Europe | 4750 | 6500 | 13500 | 16950 | 18800 | 36415 | 52182 | 79604 | 87289 | 110490 | 121006 |
| Former USSR | 3900 | 7100 | 16950 | 20700 | 26550 | 54765 | 88672 | 156192 | 180050 | 249748 | 290866 |
| World | 230820 | 268273 | 437818 | 555828 | 603410 | 1041092 | 1270014 | 1791020 | 2524531 | 3913482 | 5907680 |
Shares of world population, Western Europe, Eastern Europe and former USSR, 0–1998 (% of world total)
Source: Maddison and others. (University of Groningen).[4]
| Year[4] | 0 | 1000 | 1500 | 1600 | 1700 | 1820 | 1870 | 1913 | 1950 | 1973 | 1998 | 2018 |
|---|---|---|---|---|---|---|---|---|---|---|---|---|
| Austria | 0.2 | 0.3 | 0.5 | 0.4 | 0.4 | 0.3 | 0.4 | 0.4 | 0.3 | 0.2 | 0.1 | |
| Belgium | 0.1 | 0.1 | 0.3 | 0.3 | 0.3 | 0.3 | 0.4 | 0.4 | 0.3 | 0.2 | 0.2 | |
| Denmark | 0.1 | 0.1 | 0.1 | 0.1 | 0.1 | 0.1 | 0.1 | 0.2 | 0.2 | 0.1 | 0.1 | |
| Finland | 0.0 | 0.0 | 0.1 | 0.1 | 0.1 | 0.1 | 0.1 | 0.2 | 0.2 | 0.1 | 0.1 | |
| France | 2.2 | 2.4 | 3.4 | 3.3 | 3.6 | 3.0 | 3.0 | 2.3 | 1.7 | 1.3 | 1.0 | |
| Germany | 1.3 | 1.3 | 2.7 | 2.9 | 2.5 | 2.4 | 3.1 | 3.6 | 2.7 | 2.0 | 1.4 | |
| Italy | 3.0 | 1.9 | 2.4 | 2.4 | 2.2 | 1.9 | 2.2 | 2.1 | 1.9 | 1.4 | 1.0 | |
| Netherlands | 0.1 | 0.1 | 0.2 | 0.3 | 0.3 | 0.2 | 0.3 | 0.3 | 0.4 | 0.3 | 0.3 | |
| Norway | 0.0 | 0.1 | 0.1 | 0.1 | 0.1 | 0.1 | 0.1 | 0.1 | 0.1 | 0.1 | 0.1 | |
| Sweden | 0.1 | 0.1 | 0.1 | 0.1 | 0.2 | 0.2 | 0.3 | 0.3 | 0.3 | 0.2 | 0.1 | |
| Switzerland | 0.1 | 0.1 | 0.1 | 0.2 | 0.2 | 0.2 | 0.2 | 0.2 | 0.2 | 0.2 | 0.1 | |
| United Kingdom | 0.3 | 0.7 | 0.9 | 1.1 | 1.4 | 2.0 | 2.5 | 2.5 | 2.0 | 1.4 | 1.0 | |
| Portugal | 0.2 | 0.2 | 0.2 | 0.2 | 0.3 | 0.3 | 0.3 | 0.3 | 0.3 | 0.2 | 0.2 | |
| Spain | 1.9 | 1.5 | 1.6 | 1.5 | 1.5 | 1.2 | 1.3 | 1.1 | 1.1 | 0.9 | 0.7 | |
| Other | 0.9 | 0.4 | 0.3 | 0.3 | 0.3 | 0.3 | 0.4 | 0.4 | 0.5 | 0.4 | 0.3 | |
| Total Western Europe | 10.7 | 9.5 | 13.1 | 13.3 | 13.5 | 12.8 | 14.8 | 14.6 | 12.1 | 9.2 | 6.6 | |
| Eastern Europe | 2.1 | 2.4 | 3.1 | 3.0 | 3.1 | 3.5 | 4.1 | 4.4 | 3.5 | 2.8 | 2.0 | |
| Former USSR | 1.7 | 2.6 | 3.9 | 3.7 | 4.4 | 5.3 | 7.0 | 8.7 | 7.1 | 6.4 | 4.9 | |
| Sum | 14.5 | 14.5 | 20.1 | 20.0 | 21.0 | 21.6 | 25.9 | 27.7 | 22.7 | 18.4 | 13.5 | 9.8[5] |
| World | 100.0 | 100.0 | 100.0 | 100.0 | 100.0 | 100.0 | 100.0 | 100.0 | 100.0 | 100.0 | 100.0 | 100.0 |
- Note: These numbers do not include the population of its colonies. Only population within Europe.
Total population
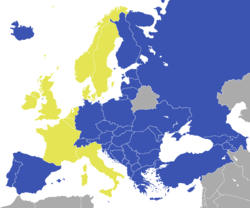
330,000,000 people lived in Europe in 1916.[6] In 1950 there were 549,000,000.[1] The population of Europe in 2015 was estimated to be 741 million according to the United Nations,[1] which was slightly less than 11% of the world population. The precise figure depends on the exact definition of the geographic extent of Europe. The population of the European Union (EU) was 509 million as of 2015.[7] Non-EU countries situated in Europe in their entirety[8] account for another 94 million. Five transcontinental countries[9] have a total of 247 million people, of which about half reside in Europe proper.
As it stands now, around 10% of the world's people live in Europe. If demographic trends keep their pace, its share may fall to around 7% in 2050, but still amounting to 716 million people in absolute numbers, according to the United Nations estimate.[1] (The decline in the percentage is partly due to high fertility rates in other parts of the world.) The sub-replacement fertility and high life expectancy in most European states mean a declining and aging population as it is not offset by the current immigration level. This situation is expected to be a challenge for their economies, political and social institutions. Countries on the edges of Europe, except for southern Europe, have generally stronger growth than Central European counterparts. Albania and Ireland have strong growth, hitting over 1% annually.
Vital statistics
| Average population | Live births | Deaths | Natural change | Crude birth rate (per 1000) | Crude death rate (per 1000) | Natural change (per 1000) | Total fertility rate | |
|---|---|---|---|---|---|---|---|---|
| 1950 | 552,650,637 | 12,279,631 | 6,077,294 | 6,202,337 | 22.2 | 11.0 | 11.2 | |
| 1951 | 558,223,197 | 12,169,682 | 6,325,019 | 5,844,663 | 21.8 | 11.3 | 10.5 | |
| 1952 | 563,493,475 | 12,177,623 | 6,001,839 | 6,175,784 | 21.6 | 10.7 | 11.0 | |
| 1953 | 569,038,338 | 11,941,894 | 6,019,718 | 5,922,176 | 21.0 | 10.6 | 10.4 | |
| 1954 | 574,789,670 | 12,324,941 | 5,898,046 | 6,426,895 | 21.4 | 10.3 | 11.2 | |
| 1955 | 580,851,705 | 12,212,326 | 5,799,677 | 6,412,649 | 21.0 | 10.0 | 11.0 | |
| 1956 | 586,901,634 | 12,146,266 | 5,829,471 | 6,316,795 | 20.7 | 9.9 | 10.8 | |
| 1957 | 592,961,193 | 12,266,984 | 5,933,392 | 6,333,592 | 20.7 | 10.0 | 10.7 | |
| 1958 | 599,136,267 | 12,252,182 | 5,600,008 | 6,652,174 | 20.4 | 9.3 | 11.1 | |
| 1959 | 605,348,897 | 12,265,796 | 5,761,645 | 6,504,151 | 20.3 | 9.5 | 10.7 | |
| 1960 | 611,080,345 | 12,250,496 | 5,714,998 | 6,535,498 | 20.0 | 9.4 | 10.7 | |
| 1961 | 617,765,543 | 12,128,282 | 5,686,453 | 6,441,829 | 19.6 | 9.2 | 10.4 | |
| 1962 | 624,539,799 | 11,878,305 | 6,011,184 | 5,867,121 | 19.0 | 9.6 | 9.4 | |
| 1963 | 631,178,748 | 11,815,819 | 5,990,339 | 5,825,480 | 18.7 | 9.5 | 9.2 | |
| 1964 | 636,849,204 | 11,635,983 | 5,802,060 | 5,833,923 | 18.3 | 9.1 | 9.2 | |
| 1965 | 642,428,289 | 11,263,795 | 6,035,103 | 5,228,692 | 17.5 | 9.4 | 8.1 | |
| 1966 | 647,361,672 | 11,159,800 | 6,028,414 | 5,131,386 | 17.2 | 9.3 | 7.9 | |
| 1967 | 651,746,129 | 11,143,819 | 6,178,007 | 4,965,812 | 17.1 | 9.5 | 7.6 | |
| 1968 | 656,477,459 | 10,974,458 | 6,386,235 | 4,588,223 | 16.7 | 9.7 | 7.0 | |
| 1969 | 660,989,825 | 10,837,646 | 6,633,586 | 4,204,060 | 16.4 | 10.0 | 6.4 | |
| 1970 | 664,048,777 | 10,710,341 | 6,579,972 | 4,130,369 | 16.1 | 9.9 | 6.2 | |
| 1971 | 668,951,352 | 10,813,587 | 6,644,557 | 4,169,030 | 16.2 | 9.9 | 6.2 | |
| 1972 | 673,335,593 | 10,640,832 | 6,691,455 | 3,949,377 | 15.8 | 9.9 | 5.9 | |
| 1973 | 677,566,692 | 10,404,644 | 6,806,797 | 3,597,847 | 15.4 | 10.0 | 5.3 | |
| 1974 | 681,644,899 | 10,539,214 | 6,787,766 | 3,751,448 | 15.5 | 10.0 | 5.5 | |
| 1975 | 685,723,151 | 10,386,253 | 7,034,405 | 3,351,848 | 15.1 | 10.3 | 4.9 | |
| 1976 | 688,988,353 | 10,380,332 | 7,108,368 | 3,271,964 | 15.1 | 10.3 | 4.7 | |
| 1977 | 692,598,706 | 10,273,774 | 7,071,683 | 3,202,091 | 14.8 | 10.2 | 4.6 | |
| 1978 | 695,805,436 | 10,240,284 | 7,207,328 | 3,032,956 | 14.7 | 10.4 | 4.4 | |
| 1979 | 699,351,916 | 10,250,780 | 7,294,794 | 2,955,986 | 14.7 | 10.4 | 4.2 | |
| 1980 | 702,641,860 | 10,299,362 | 7,452,692 | 2,846,670 | 14.7 | 10.6 | 4.1 | |
| 1981 | 705,680,147 | 10,173,633 | 7,419,189 | 2,754,444 | 14.4 | 10.5 | 3.9 | |
| 1982 | 708,358,982 | 10,217,922 | 7,352,220 | 2,865,702 | 14.4 | 10.4 | 4.0 | |
| 1983 | 711,003,288 | 10,281,966 | 7,568,702 | 2,713,264 | 14.5 | 10.6 | 3.8 | |
| 1984 | 713,601,049 | 10,180,601 | 7,613,126 | 2,567,475 | 14.3 | 10.7 | 3.6 | |
| 1985 | 716,205,711 | 10,074,137 | 7,730,412 | 2,343,725 | 14.1 | 10.8 | 3.3 | |
| 1986 | 719,150,440 | 10,207,884 | 7,481,632 | 2,726,252 | 14.2 | 10.4 | 3.8 | |
| 1987 | 722,244,373 | 10,148,938 | 7,469,132 | 2,679,806 | 14.1 | 10.3 | 3.7 | |
| 1988 | 725,546,176 | 10,017,572 | 7,560,826 | 2,456,746 | 13.8 | 10.4 | 3.4 | |
| 1989 | 728,372,277 | 9,638,871 | 7,585,513 | 2,053,358 | 13.2 | 10.4 | 2.8 | |
| 1990 | 730,830,065 | 9,422,327 | 7,745,752 | 1,676,575 | 12.9 | 10.6 | 2.3 | |
| 1991 | 733,009,781 | 9,023,724 | 7,873,774 | 1,149,950 | 12.3 | 10.7 | 1.6 | |
| 1992 | 730,096,476 | 8,545,246 | 7,936,689 | 608,557 | 11.7 | 10.9 | 0.8 | |
| 1993 | 731,078,271 | 8,080,313 | 8,416,692 | -336,379 | 11.1 | 11.5 | -0.5 | |
| 1994 | 731,823,499 | 7,917,773 | 8,518,141 | -600,368 | 10.8 | 11.6 | -0.8 | |
| 1995 | 732,194,921 | 7,706,917 | 8,514,506 | -807,589 | 10.5 | 11.6 | -1.1 | |
| 1996 | 735,716,936 | 7,645,955 | 8,403,761 | -757,806 | 10.4 | 11.4 | -1.0 | |
| 1997 | 735,626,680 | 7,532,303 | 8,270,485 | -738,182 | 10.2 | 11.2 | -1.0 | |
| 1998 | 735,357,189 | 7,448,190 | 8,211,210 | -763,020 | 10.1 | 11.2 | -1.0 | |
| 1999 | 735,220,223 | 7,306,598 | 8,399,803 | -1,093,205 | 9.9 | 11.4 | -1.5 | |
| 2000 | 735,281,836 | 7,391,238 | 8,404,825 | -1,013,587 | 10.1 | 11.4 | -1.4 | |
| 2001 | 734,479,099 | 7,311,788 | 8,376,261 | -1,064,473 | 10.0 | 11.4 | -1.4 | |
| 2002 | 734,113,675 | 7,363,664 | 8,537,143 | -1,173,479 | 10.0 | 11.6 | -1.6 | |
| 2003 | 734,835,737 | 7,510,105 | 8,676,316 | -1,166,211 | 10.2 | 11.8 | -1.6 | |
| 2004 | 735,580,756 | 7,630,690 | 8,384,784 | -754,094 | 10.4 | 11.4 | -1.0 | |
| 2005 | 736,717,375 | 7,595,806 | 8,521,892 | -926,086 | 10.3 | 11.6 | -1.3 | |
| 2006 | 737,678,808 | 7,742,855 | 8,277,039 | -534,184 | 10.5 | 11.2 | -0.7 | |
| 2007 | 738,915,057 | 7,953,156 | 8,245,072 | -291,916 | 10.8 | 11.2 | -0.4 | |
| 2008 | 740,211,536 | 8,261,791 | 8,274,493 | -12,702 | 11.2 | 11.2 | 0.0 | |
| 2009 | 741,816,205 | 8,272,129 | 8,175,408 | 96,721 | 11.2 | 11.0 | 0.1 | |
| 2010 | 743,090,810 | 8,276,170 | 8,192,169 | 84,001 | 11.1 | 11.0 | 0.1 | |
| 2011 | 742,829,600 | 8,125,121 | 8,011,717 | 113,404 | 10.9 | 10.8 | 0.2 | |
| 2012 | 744,057,815 | 8,225,815 | 8,126,630 | 99,185 | 11.1 | 10.9 | 0.1 | |
| 2013 | 745,572,312 | 8,057,803 | 8,069,336 | -11,533 | 10.8 | 10.8 | 0.0 | |
| 2014 | 746,962,843 | 8,112,733 | 8,016,661 | 96,072 | 10.9 | 10.7 | 0.1 | |
| 2015 | 749,227,345 | 8,006,695 | 8,263,948 | -257,253 | 10.7 | 11.0 | -0.3 | |
| 2016 | 750,610,036 | 7,978,910 | 8,138,734 | -159,824 | 10.6 | 10.8 | -0.2 | |
| 2017 | 751,412,637 | 7,641,610 | 8,200,819 | -559,209 | 10.2 | 10.9 | -0.7 | |
| 2018 | 751,612,093 | 7,401,572 | 8,252,295 | -850,723 | 9.8 | 11.0 | -1.1 | |
| 2019 | ||||||||
| Average population | Live births | Deaths | Natural change | Crude birth rate (per 1000) | Crude death rate (per 1000) | Natural change (per 1000) | Total fertility rate | |
Population by country

According to different definitions, such as consideration of the concept of Central Europe, the following territories and regions may be subject to various other categorisations aside from geographic conventions.
| Country/territory | Area (km2) |
Population | Population density (per km2) |
Capital |
|---|---|---|---|---|
| 28,748 | 2,862,427 | 105.1 | Tirana | |
| 468 | 85,082 | 181.8 | Andorra la Vella | |
| 29,743 | 3,018,854 | 101.5 | Yerevan | |
| 83,879 | 8,504,850 | 101.4 | Vienna | |
| 86,600 | 9,754,830 | 112.6 | Baku | |
| 207,595 | 9,475,100 | 45.6 | Minsk | |
| 30,528 | 11,198,638 | 366.8 | Brussels | |
| 51,197 | 3,301,000 | 75.6 | Sarajevo | |
| 110,994 | 7,364,570 | 66.4 | Sofia | |
| 56,594 | 4,284,889 | 75.7 | Zagreb | |
| 9,251 | 1,117,000 | 120.7 | Nicosia | |
| 78,866 | 10,513,209 | 133.3 | Prague | |
| 42,925 | 5,655,750 | 131.6 | Copenhagen | |
| 45,227 | 1,324,820 | 29.1 | Tallinn | |
| 1,399 | 49,709 | 35.6 | Tórshavn | |
| 338,424 | 5,470,820 | 16.2 | Helsinki | |
| 643,801 | 67,210,000 | 103.7 | Paris | |
| 69,700 | 3,729,000 | 53.5 | Tbilisi | |
| 357,168 | 80,716,000 | 226.0 | Berlin | |
| 6.8 | 30,001 | 4,348.0 | Gibraltar | |
| 131,957 | 10,816,286 | 82.0 | Athens | |
| 78 | 65,345 | 837.8 | St. Peter Port | |
| 93,030 | 9,877,365 | 106.2 | Budapest | |
| 103,001 | 325,671 | 3.2 | Reykjavík | |
| 70,273 | 4,609,600 | 65.6 | Dublin | |
| 572 | 84,497 | 147.8 | Douglas | |
| 301,338 | 60,782,668 | 201.7 | Rome | |
| 118 | 97,857 | 827.9 | Saint Helier | |
| 2,724,900 | 17,987,736 | 6.49 | Nur-Sultan | |
| 10,908 | 1,859,203 | 170.4 | Pristina | |
| 64,589 | 1,990,300 | 30.8 | Riga | |
| 160 | 37,132 | 232.1 | Vaduz | |
| 65,300 | 2,944,459 | 45.1 | Vilnius | |
| 2,586 | 549,680 | 212.6 | Luxembourg | |
| 316 | 446,547 | 1,413.1 | Valletta | |
| 33,846 | 2,681,735 | 79.3 | Chişinău | |
| 2.02 | 36,371 | 18,005.4 | Monaco | |
| 13,812 | 647,905 | 46.9 | Podgorica | |
| 41,543 | 16,856,620 | 405.8 | Amsterdam | |
| 25,713 | 2,058,539 | 80.1 | Skopje | |
| 385,178 | 5,136,700 | 13.3 | Oslo | |
| 312,679 | 38,483,957 | 123.1 | Warsaw | |
| 92,212 | 10,427,301 | 113.1 | Lisbon | |
| 238,391 | 19,942,642 | 83.7 | Bucharest | |
| 17,075,400 | 143,700,000 | 8.5 | Moscow | |
| 61.2 | 32,576 | 532.3 | San Marino | |
| 77,461 | 7,041,599 | 90.9 | Belgrade | |
| 49,035 | 5,415,949 | 110.5 | Bratislava | |
| 20,273 | 2,061,085 | 101.7 | Ljubljana | |
| 504,645 | 47,100,396 | 92.6 | Madrid | |
Mayen Islands (Norway) |
62,049 | 2,868 | 0.046 | Longyearbyen |
| 449,964 | 10,004,962 | 21.6 | Stockholm | |
| 41,285 | 8,183,800 | 198.2 | Bern | |
| 4,163 | 505,000 | 121.3 | Tiraspol | |
| 783,356 | 79,814,871 | 102 | Ankara | |
| 603,628 | 37,541,693 | 73.8 | Kyiv | |
| 243,610 | 64,100,000 | 263.1 | London | |
| 0.44 | 842 | 1,913.6 | Vatican City | |
| 1,580 | 28,666 | 18.1 | Mariehamn | |
| Total[o] |
Age
Mirroring their mostly sub-replacement fertility and high life expectancy, European countries tend to have older populations overall. They had nine of the top ten highest median ages in national populations in 2005. Only Japan had an older population.[10]
Religion
Over the last several centuries, religious practice has been on the decline in a process of secularization. Several European countries have experienced a decline in church attendance as well as a decline in the number of people professing a religious belief. The 2010 Eurobarometer survey found that, on average, 51% of the citizens of the EU member states state that they believe there is a God, 26% believe there is some sort of spirit or life force and 20% don't believe there is any sort of spirit, God or life force. 3% declined to answer.[11] The Eurobarometer survey must be taken with caution, however, as there are discrepancies between it and national census results. For example, in the United Kingdom, the 2001 census revealed that over 70% of the population regarded themselves as "Christians" with only 15% professing to have no religion, though the wording of the question has been criticized as "misleading" by the British Humanist Association.[12] The 2011 census showed a dramatic reduction to less than 60% of the population regarding themselves as "Christians".[13]
Despite its decline, Christianity is still the largest religion in Europe. According to a survey published in 2010, 76.2% of Europeans identified themselves as Christians.[14][15] Catholics were the largest Christian group in Europe, accounting for more than 48% of European Christians.[16] The second-largest Christian group in Europe was the Orthodox, who made up 32% of European Christians.[16] And about 19% of European Christians were part of the Protestant tradition.
According to a 2003 study,[17] 47% of French people declared themselves as agnostics in 2003. This situation is often called "Post-Christian Europe". A decrease in religiousness and church attendance in western Europe (especially in Belgium, the Czech Republic, Finland, France, Germany, the United Kingdom, Norway, the Netherlands and Sweden) has been noted. According to a survey published in 2012 Atheists and Agnostics make up about 18.2% of the European population.[18] According to the same survey the religiously unaffiliated make up the majority of the population only in two European countries: Czech Republic (75%) and Estonia (60%).[18]
According to another survey about Religiosity in the European Union from 2012 by Eurobarometer, Christianity was the largest religion in the European Union (accounting for 72% of the EU population), Catholics were with 48% the largest Christian group in EU, Protestants made up 12%, Eastern Orthodox made up 8% and other Christians accounted for 4% of the EU population.[19] non-believers/agnostics accounted for 16%, atheists accounted for 7% and Muslims accounted for 2%.[20]
- Muslims are younger and have more children than non-Muslims in Europe overall
- Source: Pew Research Center[21]
| Europe | Median age, 2016 | Total fertility rate, 2015–2020[fn 1][21] |
|---|---|---|
| Muslims | 30 yo | 2.6 children/woman |
| Non Muslims | 44 yo | 1.6 children/woman |
- Fertility and migration drove Muslim population growth in Europe between 2010 and 2016
- Source: Pew Research Center[22]
Estimated population change between 2010 and 2016 due to three factors:
| Natural increase | Net migration | Religious switching[22] | |
|---|---|---|---|
| Muslims | +2.92 M | +3.48 M | −160 K |
| Non Muslims | −1.67 M | +1.29 M | +160 K |
Ethnic groups
Pan and Pfeil (2004) count 87 distinct "peoples of Europe", of which 33 form the majority population in at least one sovereign state, while the remaining 54 constitute ethnic minorities. The total number of national minority populations in Europe is estimated at 105 million people, or 14% of 770 million Europeans. (including Europeans in Asian Russia)[23]
The largest ethnic groups are the Russians, of whom 92 million reside in Europe and the Germans, with 72 million. In some countries such as the United Kingdom, France and Spain, the designation of nationality may controversially take on ethnic aspects, subsuming smaller ethnic groups such as Scots, Welsh, Bretons and Basques, making it difficult to quantify a "British" or "French" ethnicity, for example.
Approximately 20 million non-Europeans live in the EU, 4% of the overall population.[24] There are an estimated 10 million Romani people in Europe.[25]
Overview map of the peoples of Europe | |
|---|---|
Size and geographic distribution of the 87 peoples of Europe, according to Pan & Pfeil (2003).[26]
Font size reflects population size (groups smaller than 2 million not to scale) Groups not shown due to lack of geographic concentration: Romani (3.8 million), Jews (1.3 million), Karaim (4,600). Small Baltic Finns, Volga Finns and Caucasian groups (<0.2 million) not shown in map: Votes, Ludes, Setos, Võros; Balkars, Karachays, Laks, Lazs, Nogais, Rutuls, Tabasarans, Tats, Tsakhurs. | |
 [[Galicians<br/>iards]] Faroese Sami |
Language
Most of the languages of Europe belong to the Indo-European language family. This family is divided into a number of branches, including Romance, Germanic, Baltic, Slavic, Albanian, Celtic and Greek. The Uralic languages, which include Hungarian, Finnish, and Estonian, also have a significant presence in Europe. The Turkic and Mongolic families also have several European members, while the North Caucasian and Kartvelian families are important in the southeastern extremity of geographical Europe. The Basque language of the western Pyrenees is an isolate unrelated to any other group, while Maltese is the only Semitic language in Europe with national language status.
The European Union (EU), which currently excludes many European countries (i.e. Norway, Russia and Switzerland), recognises 23 official languages as of 2007.[27] According to the same source, the eight most natively spoken languages in the EU are (percentage of total EU population[27]):
These figures change when foreign language skills are taken into account. The list below shows the top eight European languages ordered by total number of speakers in the EU:[27]
- 49% English
- 35% German
- 26% French
- 16% Italian
- 15% Spanish
- 10% Polish
- 7% Russian
- 6% Dutch
This makes German the most frequently spoken native language and English the most frequently spoken non-native language overall in the European Union, with German the second-most common language overall.
Languages that are not official state languages are protected in many European countries by the European Charter for Regional or Minority Languages. These can include languages spoken by relatively many people, such as Catalan and Basque in Spain, as well as languages spoken by relatively few such as Welsh, Cornish and Scottish Gaelic in the United Kingdom.
Genetic origins
.png)
Homo sapiens appeared in Europe roughly 40,000 years ago, with the settlement of the Cro-magnons. Over the prehistoric period there was continuous settlement in Europe, notably by the immediate descendants of the Proto-Indo-Europeans who migrated west after the advent of the Neolithic revolution.[28]
Mitochondrial DNA and Y-chromosome DNA
Studies of mitochondrial DNA (mtDNA) have suggested substantial genetic homogeneity of European populations,[29] with only a few geographic or linguistic isolates appearing to be genetic isolates as well.[30] On the other hand, analyses of the Y chromosome[31][32] and of autosomal diversity[33] have shown a general gradient of genetic similarity running from the southeast to the northwest of the continent.
Population structure
A study in May 2009[34] that examined 19 populations from Europe using 270,000 single nucleotide polymorphisms (SNPs) highlighted the genetic diversity of European populations corresponding to the northwest to southeast gradient and distinguished "several distinct regions" within Europe:
- Finland
- the Baltic states (Estonia, Latvia and Lithuania), western Russia and Poland.
- Central and Western Europe.
- Italy, South-Eastern Europe, Southern Russia.
In this study, Fst (Fixation index) was found to correlate considerably with geographic distances ranging from ≤0.0010 for neighbouring populations to 0.0230 for Southern Italy and Finland. For comparisons, pair-wise Fst of non-European samples were as follows: Europeans – Yoruba (West Africans) 0.1530; Europeans – Chinese 0.1100; Yoruba (West Africans) – Chinese 0.1900.[35]
See also
- Area and population of European countries
- Classical demography
- European diasporas
- European Union statistics
- Migration from Latin America to Europe
- Largest cities of the European Union by population within city limits
- Largest urban areas of the European Union
- List of European countries by population growth rate
- List of European countries by population
- List of metropolitan areas in Europe
- Medieval demography
- Demographics of the world
- List of countries by fertility rate
Notes
^ a: Continental regions as per UN categorisations/map. Depending on definitions, various territories cited below may be in one or both of Europe and Asia, or Africa.
^ b: Includes Transnistria, a region that has declared, and de facto achieved, independence; however, it is not recognised de jure by sovereign states.
^ c: Russia is considered a transcontinental country in Eastern Europe and Northern Asia. However, the population and area figures include the entire state.
^ d: Guernsey, the Isle of Man and Jersey are Crown dependencies of the United Kingdom. Other Channel Islands legislated by the Bailiwick of Guernsey include Alderney and Sark.
^ e: Cyprus is physiographically entirely in Western Asia, but it has strong historical and sociopolitical connections with Europe. The population and area figures refer to the entire state, including the de facto independent part Northern Cyprus.
^ f: Figures for Portugal include the Azores and Madeira archipelagos, both in Northern Atlantic.
^ g: Area figure for Serbia includes Kosovo, a province that unilaterally declared its independence from Serbia on 17 February 2008, and whose sovereign status is unclear. Population and density figures are 2010 estimates and are given without the disputed territory of Kosovo.
^ h: Figures for France include metropolitan France but not overseas departments and territories as they are not part of the European continent.
^ j: Kazakhstan is physiographically considered a transcontinental country in Central Asia (UN region) and Eastern Europe, with European territory west of the Ural Mountains and both the Ural and Emba rivers. However, area and population figures refer to the entire country.
^ k: Armenia is physiographically entirely in Western Asia, but it has strong historical and sociopolitical connections with Europe. The population and area figures include the entire state respectively.
^ m: Georgia is often considered a transcontinental country in Western Asia and Eastern Europe. However, the population and area figures include the entire state. This also includes Georgian estimates for Abkhazia and South Ossetia, two regions that have declared and de facto achieved independence. The International recognition, however, is limited.
^ o: The total figures for area and population includes the whole of the transcontinental countries. The precision of these figure is compromised by the ambiguous geographical extend of Europe and the lack of references for European portions of transcontinental countries.
^ p: Kosovo unilaterally declared its independence from Serbia on 17 February 2008. Its sovereign status is unclear. Its population is a 2007 estimate.
^ r: Abkhazia and South Ossetia unilaterally declared their independence from Georgia on 25 August 1990 and 28 November 1991 respectively. Their sovereign status is unclear. Population figures stated as of 2003 census and 2000 estimates respectively.
- The total fertility rate is the number of children born per woman
References
- "World Population Prospects: The 2017 Revision". UN – Department of Economic and Social Affairs. Retrieved 27 January 2018.
- "Figure 8: Population by Total Fertility (millions)" in World Population Prospects, the 2010 Revision. United Nations, Department of Economic and Social Affairs, Population Division (2011)
- Angus Maddison, The World Economy: Historical Statistics, Statistical Appendix (2007, ggdc.net). Estimates cited are for the beginning of the 1st millennium ("year 0"), the beginning of the 2nd millennium ("year 1000"), and for the beginning each century since the 16th (years 1820 and 1913 are given for the 19th and 20th century, respectively, as Maddison presents detailed estimates for these years), and a projection for the year 2030.
- Maddison. "Growth of World Population, GDP and GDP Per Capita before 1820" (PDF).
- "Europe Population (LIVE)". worldometers.info.
- Charles Morris, ed. (1916). Winston's Cumulative ...: Encyclopedia; a Comprehensive Reference Book, Volume 4. Winston's Cumulative ...: Encyclopedia; a Comprehensive Reference Book. John C. Winston Company. Retrieved 17 May 2014.
- "Eurostat: Population on 1 January". European Commission. Retrieved 27 January 2018.
- Population in million: Albania 2.9, Belarus 9.5, Bosnia and Herzegovina 3.5, Croatia 4.2, Iceland 0.3, Moldova 4.1, North Macedonia 2.1, Norway 5.2, Serbia and Kosovo 8.9, Switzerland 8.3, Ukraine 44.7.
- Population in million: Armenia 2.9, Georgia 4.0, Kazakhstan 17.8, Russia 144, Turkey 78.3.
- United Nations Population Division, World Population Prospects: The 2004 Revision Highlights. 2005
- "Special Eurobarometer, biotechnology, page 204" (PDF). 2010. Archived from the original (PDF) on 15 December 2010.
- "Census 2011". Humanism.org.uk. 17 September 2012. Retrieved 19 January 2014.
- "BBC News – At-a-glance: Census 2011 findings". Bbc.co.uk. 11 December 2012. Retrieved 19 January 2014.
- "Global Christianity". Pewforum.org. 19 December 2011. Retrieved 19 January 2014.
- "The Global Religious Landscape: Christians". Pewforum.org. 18 December 2012. Retrieved 19 January 2014.
- Christianity in Europe, excluding the Asian part of Russia, including the European part of Turkey
- Dogan, Mattei, Religious Beliefs in Europe: Factors of Accelerated Decline, 2003
- "Religiously Unaffiliated". Pewforum.org. 18 December 2012. Retrieved 11 January 2018.
- "Discrimination in the EU in 2012" (PDF). Special Eurobarometer. 383. European Union: European Commission: 233. 2012. Archived from the original (PDF) on 2 December 2012. Retrieved 14 August 2013.
- "Discrimination in the EU in 2012" (PDF), Special Eurobarometer, 383, European Union: European Commission, p. 233, 2012, archived from the original (PDF) on 2 December 2012, retrieved 14 August 2013 The question asked was "Do you consider yourself to be...?" With a card showing: Catholic, Orthodox, Protestant, Other Christian, Jewish, Muslim, Sikh, Buddhist, Hindu, Atheist, and Non-believer/Agnostic. Space was given for Other (SPONTANEOUS) and DK. Jewish, Sikh, Buddhist, Hindu did not reach the 1% threshold.
- "The Growth of Germany's Muslim Population", Pew Research Center, 29 November 2017
- Conrad Hackett (29 November 2017), "5 facts about the Muslim population in Europe", Pew Research Center
- Christoph Pan, Beate Sibylle Pfeil,Minderheitenrechte in Europa. Handbuch der europäischen Volksgruppen (2002). Living-diversity.eu, English translation 2004.
- "Migration and migrant population statistics". Ec.europa.eu. 1 May 2015. Retrieved 7 September 2015.
- "Roma integration in the EU". European Commission.
- Pan, Christoph; Pfeil, Beate S. (2003). "The Peoples of Europe by Demographic Size, Table 1". National Minorities in Europe: Handbook. Wien: Braumueller. p. 11f. ISBN 978-3-7003-1443-1. (a breakdown by country of these 87 groups is given in Table 5, pp. 17–31.)
- "EUROPA – Education and Training – Languages in Europe". 19 June 2006. Archived from the original on 19 June 2006. Retrieved 11 January 2018.
- Encyclopædia Britannica, s.v. "Europe : The people".
- Torroni A, Achilli A, Macaulay V, Richards M, Bandelt HJ (2006): "Harvesting the fruit of the human mtDNA tree". Trends in Genetics 22: 339–345.
- Simoni L, Calafell F, Pettener D, Bertranpetit J, Barbujani G (2000): "Geographic patterns of mtDNA diversity in Europe". American Journal of Human Genetics 66: 262–278.
- Chikhi L, Nichols RA, Barbujani G, Beaumont MA (2002): "Y genetic data support the Neolithic demic diffusion model". Proceedings of the National Academy of Sciences of the United States of America 99: 11008–11013.
- Roewer L, Croucher PJ, Willuweit S, Lu TT, Kayser M, et al. (2005): "Signature of recent historical events in the European Y-chromosomal STR haplotype distribution". Human Genetics 116: 279–291.
- Barbujani G, Goldstein DB (2004): "Africans and Asians abroad: genetic diversity in Europe". Annual Review of Genomics and Human Genetics 5: 119–150.
- Genetic Structure of Europeans: A View from the North–East, Nelis et al. 2009
- "Pair-wise Fst between European samples". Plosone.org. Retrieved 19 January 2014.
External links
- Eurostat – Population and population change statistics (Note that this only covers present and projected future population.)
- Eurostat – Population projections