Economy of the European Union
The economy of the European Union is the joint economy of the member countries of the European Union (EU). It is the second largest economy in the world in nominal terms, after the United States, and the third one in purchasing power parity (PPP) terms, after China and the United States. The European Union's GDP was estimated to be $18.8 trillion (nominal) in 2018,[24] representing about 22% of the global economy.[25]
_in_EU.svg.png)
.jpg) | |
| Currency | Euro (EUR, €) and 8 others |
|---|---|
| Calendar year | |
Trade organisations | WTO, G20, G7 and others |
| Statistics | |
| Population | |
| GDP | |
GDP growth |
|
GDP per capita | |
GDP by sector |
|
Population below poverty line | |
Labour force | |
Labour force by occupation |
|
| Unemployment | |
Average gross salary | €35,000 (~US$40,000), annual (2015)[11] |
Average net salary | €24,000 (~US$27,000), annual (2015)[11] |
Main industries |
|
| External | |
| Exports | $1.9 trillion (2015 est.)[12] |
Export goods | machinery, motor vehicles, pharmaceuticals and other chemicals, fuels, aircraft, plastics, iron and steel, wood pulp and paper products, alcoholic beverages, furniture |
Main export partners |
|
| Imports | $1.7 trillion (2015 est.)[12] |
Import goods | fuels and crude oil, machinery, vehicles, pharmaceuticals and other chemicals, precious gemstones, textiles, aircraft, plastics, metals, ships |
Main import partners |
|
FDI stock | |
Gross external debt | $13.05 trillion (31 December 2014 est.)[12] |
| Public finances | |
| Revenues | 46.2% of GDP (EU27; 2019)[18] |
| Expenses | 46.7% of GDP (EU27; 2019)[18] |
| Economic aid | donor: ODA, $87.64 billion[20] |
Foreign reserves | $0.6 trillion (2010)[23] |
The euro, used by 19 of its 27 members, is the second largest reserve currency as well as the second most traded currency in the world after the United States dollar.[26][27][28] The euro is the official currency in 25 countries, in the eurozone and in six other European countries, officially or de facto.
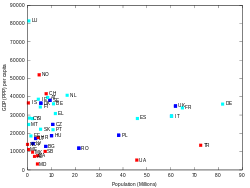
The European Union economy consists of an internal market of mixed economies based on free market and advanced social models. For instance, it includes an internal single market with free movement of goods, services, capital, and labor.[29] The GDP per capita (PPP) was $43,188 in 2018,[30] compared to $62,869 in the United States, $44,246 Japan and $18,116 in China.[31] There are significant disparities in GDP per capita (PPP) between member states ranging from $106,372 in Luxembourg to $23,169 in Bulgaria.[32] With a low Gini coefficient of 31, the European Union has a more egalitarian distribution of income than the world average.[33][34]
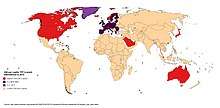
Euronext is the main stock exchange of the Eurozone and the world's sixth largest by market capitalisation.[35] Foreign investments made in the European Union total $5.1 trillion in 2012, while the EU's investments in foreign countries total $9.1 trillion, by far the highest domestic and foreign investments in the world.[36][37] The European Union's largest trading partners are the United States, China, the United Kingdom, Switzerland, Russia, Turkey, Japan, Norway, South Korea, India, and Canada.[38]
Since the beginning of the public debt crisis in 2009, opposite economic situations have emerged between Southern Europe on one hand, and Central and Northern Europe on the other hand: a higher unemployment rate and public debt in the Mediterranean countries with the exception of Malta, and a lower unemployment rate with higher GDP growth rate in the Eastern and in Northern member countries. In 2018, public debt in the European Union was 80% of GDP, with disparities between the lowest rate, Estonia with 8.4%, and the highest, Greece with 181.1%.[39]
Currency

Beginning in the year 1999 with some EU member states, now 19 out of 27 EU states use the euro as official currency in a currency union. The remaining 8 states continued to use their own currency with the possibility to join the euro later. The euro is also the most widely used currency in the EU.
Since 1992 the Maastricht Treaty sets out rigid economic and fiscal convergence criteria for the states joining the euro. Starting 1997, the Stability and Growth Pact has been started to ensure continuing economic and fiscal stability and convergence.
Denmark is not a part of the eurozone due to its special opt-outs concerning the later joining of the euro. In contrast, Sweden can effectively opt out by choosing when or whether to join the European Exchange Rate Mechanism, which is the preliminary step towards joining. The remaining states are committed to join the euro through their Treaties of Accession.
Starting with Greece in 2009, five of the 19 eurozone states have been struggling with a sovereign debt crisis, by many called the European debt crisis. All these states started reforms and got bailout packages (Greece, Ireland, Portugal, Spain, Cyprus). As of 2015, all countries but Greece have recovered from their debt crisis. Other non-eurozone states also experienced a debt crisis and also went through successful bailout programmes, i.e. Hungary, Romania and Latvia (the latter before it joined the eurozone).[40]
Budget
The EU has agreed on a budget of €165.8 billion for the year 2019,[41] representing around 1% of the EU-28's gross national income (GNI). The EU has a long-term budget of €1,082.5 billion for the period 2014–2020, representing 1.02% of the EU-28's GNI.[42] It will eventually be increased drastically, €750 billion are proposed, because of the Coronavirus pandemic in order to boost the post-pandemic economy [43]
Sectors
Services
The services sector is by far the most important sector in the European Union, making up 74.7% of GDP, compared to the manufacturing industry with 23.8% of GDP and agriculture with only 1.5% of GDP.[44]
Financial services are well developed within the Single Market of the Union. Companies have a greater reliance on bank lending than in the United States, although a shift towards companies raising more funding through capital markets is planned through the CMU initiative, the EU plan put forward by the Commission in September 2015 to mobilise the free movement of capital within the EU.[45] The plan aims "to establish the building blocks of an integrated capital market in the EU by 2019".[46] The CMU initiative comprises 33 measures in all.[47] The plan was updated in 2017 and in 2019, since not a single legislation will deliver the CMU.[48] The Commissioner for Financial Stability, Financial Services and Capital Markets Union, Valdis Dombrovskis, former Prime Minister of Latvia, is responsible for delivery of the initiative.[49][50][51][52]
According to the Global Financial Centres Index, the two largest financial centres in Europe, London and Zurich, are outside the European Union.[53] The two largest financial centres remaining within the EU will then be Frankfurt and Luxembourg City.
Agriculture
The agricultural sector is supported by subsidies from the European Union in the form of the Common Agricultural Policy (CAP). In 2013 this represented approximately €45billion (less than 33% of the overall budget of €148billion) of the EU's total spending.[54] It was used originally to guarantee a minimum price for farmers in the EU. This is criticised as a form of protectionism, inhibiting trade, and damaging developing countries; one of the most vocal opponents was the UK, the second largest economy within the bloc until its withdrawal in January 2020, which repeatedly refused to give up the annual UK rebate unless the CAP should undergo significant reform; France, the biggest beneficiary of the CAP and the bloc's third largest (now its second-largest) economy, is its most vocal proponent. The CAP is however witnessing substantial reform. In 1985, around 70% of the EU budget was spent on agriculture. In 2011, direct aid to farmers and market-related expenditure amount to just 30% of the budget, and rural development spending to 11%. By 2011, 90% of direct support had become non-trade-distorting (not linked to production) as reforms have continued to be made to the CAP, its funding and its design.[55]
Tourism
The European Union is a major tourist destination, attracting visitors from outside of the Union and citizens travelling inside it. Internal tourism is made more convenient by the Schengen treaty and the euro. All citizens of the European Union are entitled to travel to any member state without the need of a visa.
France is the world's number one tourist destination for international visitors, followed by Spain, Italy, and Germany. It is worth noting, however, that a significant proportion of international visitors to EU countries are from other member states.
Energy
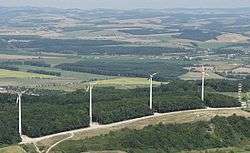
The European Union has uranium, coal, oil, and natural gas reserves. There are six oil producers in the European Union, primarily in North Sea oilfields. The United Kingdom, whilst it was a member of the European Union was by far the largest producer; Denmark, Germany, Italy, Romania and the Netherlands all produce oil. If it is treated as a single unit, which is not conventional in the oil markets, the European Union is the 19th largest producer of oil in the world, producing 1,241,370 (2013) barrels a day.
It is the world's second largest consumer of oil, consuming much more than it can produce, at 12,790,000 (2013) barrels a day. Much of the difference comes from Russia and the Caspian Sea basin. All countries in the EU have committed to the Kyoto Protocol, and the European Union is one of its biggest proponents. The European Commission published proposals for the first comprehensive EU energy policy on 10 January 2007.
Companies
The European Union's member states are the birthplace of many of the world's largest leading multinational companies, and home to its global headquarters. Among these are distinguished companies ranked first in the world within their industry/sector, like Allianz, which is the largest financial service provider in the world by revenue; WPP plc which is the world's largest advertising agency by revenue; Amorim, which is the world's largest cork-processing and cork producer company; ArcelorMittal, which is the largest steel company in the world; Inditex which is the biggest fashion group in the world; Groupe Danone, which has the world leadership in the dairy products market.
Anheuser-Busch InBev is the largest beer company in the world; L'Oréal Group, which is the world's largest cosmetics and beauty company; LVMH, which is the world's largest luxury goods conglomerate; Nokia Corporation, which was the world's largest manufacturer of mobile telephones; Royal Dutch Shell, which is one of the largest energy corporations in the world; and Stora Enso, which is the world's largest pulp and paper manufacturer in terms of production capacity, in terms of banking and finance the EU has some of the world's largest notably HSBC and Grupo Santander, the largest bank in Europe in terms of Market Capitalisation.
Many other European companies rank among the world's largest companies in terms of turnover, profit, market share, number of employees or other major indicators. A considerable number of EU-based companies are ranked among the world's top-ten within their sector of activity. Europe is also home to many prestigious car companies such as Aston Martin, BMW, Ferrari, Jaguar, Lamborghini, Land Rover, Maserati, Mercedes-Benz, Porsche, Volvo, as well as volume manufacturers such as Dacia, Citroën, Fiat, Opel, Peugeot, Renault, Seat, Volkswagen and more.
The following is a list of the largest EU based stock market listed companies in 2016. The ordered by revenue in millions of US Dollars and is based on the Fortune Global 500.
| Rank | Corporation | Stock ticker | Revenue $ millions | Profit $ millions | Employees | Headquarters | Industry |
|---|---|---|---|---|---|---|---|
| 1 | Royal Dutch Shell | RDS.A | 272,156 | 1,939 | 90,000 | Shell Centre, London, UK, and The Hague, Netherlands | Energy |
| 2 | Volkswagen | VLKAY | 236,600 | −1,520 | 610,076 | Wolfsburg, Germany | Motor Vehicles & Parts |
| 3 | BP PLC | BP.L | 183,000 | 4,100 | 74,500 | London, UK | Energy |
| 4 | Daimler | DDAIY | 165,800 | 9,345 | 284,015 | Stuttgart, Germany | Motor Vehicles & Parts |
| 5 | EXOR Group | EXOSF | 152,591 | 825 | 303,247 | Amsterdam, Netherlands | Financials |
| 6 | Total | TOT | 143,421 | 5,087 | 96,019 | Paris, France | Energy |
| 7 | E.ON | EONGY | 129,277 | −7,764 | 56,490 | Essen, Germany | Energy |
| 8 | AXA | AXAHY | 129,250 | 6,231 | 98,279 | Paris, France | Financials |
| 9 | Allianz | AZSEY | 122,948 | 7,339 | 142,459 | Munich, Germany | Financials |
| 10 | BNP Paribas | BNPQY | 111,531 | 7,426 | 181,551 | Paris, France | Financials |
Economies of member states
Wealth
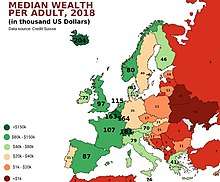
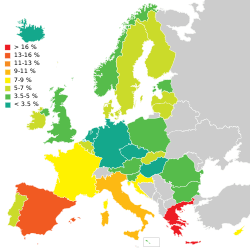
The twelve new member states of the European Union have enjoyed a higher average percentage growth rate than their elder members of the EU. Slovakia has the highest GDP growth in the period 2005–2015 among all countries of the European Union (See Tatra Tiger). Notably the Baltic states have achieved high GDP growth, with Latvia topping 11%, close to China, the world leader at 9% on average for the past 25 years (though these gains have been in great part cancelled by the late-2000s recession).[57]
Reasons for this growth include government commitments to stable monetary policy, export-oriented trade policies, low flat-tax rates and the utilisation of relatively cheap labour. In 2015 Ireland had the highest GDP growth of all the states in EU (25.1%). The current map of EU growth is one of huge regional variation, with the larger economies suffering from stagnant growth and the new nations enjoying sustained, robust economic growth.
Although EU27 GDP is rising, the percentage of gross world product is decreasing because of the emergence of economies such as China, India and Brazil.
In the tables below, colours indicate best and worst performer of the year concerned.
| Member state | 2012 | 2013 | 2014 | 2015 | 2016 | 2017 | 2018 | 2019 | Yearly growth (2012–2019) |
Last available quarter |
|---|---|---|---|---|---|---|---|---|---|---|
| 0.7 | 0.0 | 0.7 | 1.0 | 2.1 | 2.5 | 2.4 | 1.6 | 1.38 | 1.0 | |
| 0.7 | 0.5 | 1.6 | 2.0 | 1.5 | 2.0 | 1.5 | 1.4 | 1.4 | 1.2 | |
| 0.4 | 0.3 | 1.9 | 4.0 | 3.8 | 3.5 | 3.1 | 3.7 | 2.43 | 3.5 | |
| −2.2 | −0.5 | −0.1 | 2.4 | 3.5 | 3.1 | 2.7 | 2.9 | 1.27 | 2.8 | |
| −3.4 | −6.6 | −1.9 | 3.4 | 6.7 | 4.4 | 4.1 | 3.2 | 1.24 | 3.2 | |
| −0.8 | −0.5 | 2.7 | 5.3 | 2.5 | 4.4 | 2.8 | 2.4 | 2.35 | 1.7 | |
| 0.2 | 0.9 | 1.6 | 2.3 | 3.2 | 2.0 | 2.4 | 2.2 | 1.85 | 1.7 | |
| 3.1 | 1.3 | 3.0 | 1.8 | 2.6 | 5.7 | 4.8 | 4.3 | 3.33 | 4.1 | |
| −1.4 | −0.9 | −0.4 | 0.5 | 2.7 | 3.1 | 1.7 | 1.0 | 0.76 | 1.4 | |
| 0.3 | 0.6 | 1.0 | 1.1 | 1.1 | 2.3 | 1.7 | 1.3 | 1.18 | 0.8 | |
| 0.4 | 0.4 | 2.2 | 1.7 | 2.2 | 2.5 | 1.5 | 0.6 | 1.44 | 0.5 | |
| −7.3 | −3.2 | 0.7 | −0.4 | −0.2 | 1.5 | 1.9 | 1.9 | −0.64 | 2.3 | |
| −1.5 | 2.0 | 4.2 | 3.8 | 2.2 | 4.3 | 5.1 | 4.9 | 3.13 | 4.6 | |
| 0.2 | 1.4 | 8.6 | 25.2 | 3.7 | 8.1 | 8.2 | 5.5 | 7.61 | 5.0 | |
| −3.0 | −1.8 | 0.0 | 0.8 | 1.3 | 1.7 | 0.8 | 0.3 | 0.01 | 0.0 | |
| 4.1 | 2.3 | 1.9 | 3.3 | 1.8 | 3.8 | 4.6 | 2.2 | 3 | 1.0 | |
| 3.8 | 3.6 | 3.5 | 2.0 | 2.6 | 4.2 | 3.6 | 3.9 | 3.4 | 3.7 | |
| −0.4 | 3.7 | 4.3 | 4.3 | 4.6 | 1.8 | 3.1 | 2.3 | 3.06 | 3.0 | |
| 2.8 | 4.8 | 8.8 | 10.9 | 5.8 | 6.7 | 7.0 | 4.4 | 6.4 | 4.4 | |
| −1.0 | −0.1 | 1.4 | 2.0 | 2.2 | 2.9 | 2.6 | 1.7 | 1.46 | 1.5 | |
| 1.6 | 1.4 | 3.3 | 3.8 | 3.1 | 4.9 | 5.1 | 4.1 | 3.41 | 3.5 | |
| −4.1 | −0.9 | 0.8 | 1.8 | 2.0 | 3.5 | 2.4 | 2.2 | 0.96 | 2.2 | |
| 2.1 | 3.5 | 3.4 | 3.9 | 4.8 | 7.1 | 4.4 | 4.1 | 4.17 | 4.2 | |
| 1.9 | 0.7 | 2.8 | 4.8 | 2.1 | 3.0 | 4.0 | 2.3 | 2.7 | 1.9 | |
| −2.6 | −1.0 | 2.8 | 2.2 | 3.1 | 4.8 | 4.1 | 2.4 | 1.98 | 2.0 | |
| −3.0 | −1.4 | 1.4 | 3.8 | 3.0 | 2.9 | 2.4 | 2.0 | 1.39 | 1.8 | |
| −0.6 | 1.1 | 2.7 | 4.4 | 2.4 | 2.4 | 2.2 | 1.2 | 1.98 | 1.7 | |
| 1.5 | 2.1 | 2.6 | 2.4 | 1.9 | 1.9 | 1.3 | 1.4 | 1.89 | 1.1 | |
| −0.7 | −0.1 | 1.6 | 2.3 | 2.1 | 2.7 | 2.1 | 1.5 | 1.47 | 1.2 | |
| Eurozone | −0.9 | −0.3 | 1.4 | 2.1 | 1.9 | 2.5 | 1.9 | 1.2 | 1.21 | 0.9 |
| Member state | 2008 | 2012 | 2013 | 2014 | 2015 | 2016 | 2017 | 2018 | 2019 |
|---|---|---|---|---|---|---|---|---|---|
| 293.762 | 318.653 | 323.910 | 333.146 | 344.269 | 357.300 | 370.296 | 385.712 | 398.522 | |
| 351.743 | 386.175 | 392.880 | 403.003 | 416.701 | 430.372 | 446.365 | 459.820 | 473.639 | |
| 37.218 | 42.034 | 41.885 | 42.876 | 45.676 | 48.621 | 52.310 | 56.087 | 60.675 | |
| 47.998 | 43.941 | 43.703 | 43.401 | 44.616 | 46.616 | 49.094 | 51.625 | 53.936 | |
| 19.010 | 19.441 | 17.995 | 17.409 | 17.827 | 18.873 | 20.040 | 21.138 | 21.944 | |
| 161.313 | 161.434 | 157.742 | 156.660 | 168.473 | 176.370 | 191.722 | 207.570 | 219.896 | |
| 241.614 | 254.578 | 258.743 | 265.757 | 273.018 | 283.110 | 292.408 | 301.341 | 310.576 | |
| 16.638 | 18.051 | 19.033 | 20.180 | 20.782 | 21.694 | 23.776 | 26.036 | 28.037 | |
| 194.265 | 201.037 | 204.321 | 206.897 | 211.385 | 217.518 | 225.836 | 234.370 | 240.924 | |
| 1,992.380 | 2,088.804 | 2,117.189 | 2,149.765 | 2,198.432 | 2,234.129 | 2,295.063 | 2,353.090 | 2,418.997 | |
| 2,546.490 | 2,745.310 | 2,811.350 | 2,927.430 | 3,030.070 | 3,134.100 | 3,244.990 | 3,344.370 | 3,435.760 | |
| 241.990 | 191.204 | 180.654 | 178.657 | 177.258 | 176.488 | 180.218 | 184.714 | 187.457 | |
| 108.216 | 99.734 | 102.032 | 105.905 | 112.210 | 115.259 | 125.603 | 133.782 | 143.826 | |
| 187.769 | 175.116 | 179.661 | 194.818 | 262.833 | 271.684 | 297.131 | 324.038 | 347.215 | |
| 1,637.699 | 1,624.359 | 1,612.751 | 1,627.406 | 1,655.355 | 1,695.590 | 1,736.602 | 1,765.421 | 1,787.664 | |
| 24.397 | 22.098 | 22.845 | 23.654 | 24.426 | 25.073 | 26.798 | 29.151 | 30.476 | |
| 32.696 | 33.332 | 34.985 | 36.545 | 37.322 | 38.893 | 42.269 | 45.264 | 48.339 | |
| 38.129 | 44.112 | 46.500 | 49.825 | 52.066 | 54.867 | 56.814 | 60.053 | 63.516 | |
| 6.129 | 7.168 | 7.647 | 8.510 | 9.659 | 10.366 | 11.332 | 12.379 | 13.209 | |
| 647.198 | 652.966 | 660.463 | 671.560 | 690.008 | 708.337 | 738.146 | 774.039 | 810.704 | |
| 366.181 | 389.377 | 394.734 | 411.163 | 430.258 | 426.556 | 467.313 | 496.361 | 527.033 | |
| 179.103 | 168.296 | 170.492 | 173.054 | 179.713 | 186.490 | 195.947 | 204.305 | 212.254 | |
| 146.591 | 133.147 | 143.802 | 150.458 | 160.298 | 170.394 | 187.773 | 204.641 | 223.337 | |
| 66.098 | 73.484 | 74.355 | 76.256 | 79.758 | 81.038 | 84.517 | 89.721 | 94.177 | |
| 37.926 | 36.253 | 36.454 | 37.634 | 38.853 | 40.367 | 42.987 | 45.755 | 48.007 | |
| 1,109.541 | 1,031.099 | 1,020.348 | 1,032.158 | 1,077.590 | 1,113.840 | 1,161.878 | 1,202.193 | 1,244.757 | |
| 353.310 | 428.825 | 440.191 | 437.541 | 454.184 | 466.348 | 479.605 | 471.208 | 474.683 | |
| 1,996.698 | 2,111.708 | 2,098.425 | 2,309.785 | 2,640.934 | 2,435.055 | 2,363.109 | 2,423.736 | 2,523.312 | |
| 13,082.10 | 13,501.734 | 13,615.093 | 14,091.453 | 14,854.107 | 14,985.311 | 15,409.891 | 15,907.594 | 13,918.144 | |
| Eurozone (19) | 9,483.133 | 9,781.526 | 9,876.005 | 10,131.361 | 10,524.439 | 10,816.984 | 11,200.953 | 11,561.243 | 11,905.421 |
| Member state | 2012 | 2013 | 2014 | 2015 | 2016 | 2017 | 2018 | 2019 |
|---|---|---|---|---|---|---|---|---|
| 37,820 | 38,210 | 38,990 | 39,890 | 40,880 | 42,100 | 43,640 | 44,900 | |
| 34,770 | 35,210 | 35,950 | 36,960 | 37,980 | 39,240 | 40,240 | 41,240 | |
| 5,750 | 5,770 | 5,940 | 6,360 | 6,820 | 7,390 | 7,980 | 8,728 | |
| 10,290 | 10,270 | 10,250 | 10,600 | 11,170 | 11,890 | 12,620 | 13,330 | |
| 22,500 | 20,880 | 20,420 | 21,030 | 22,160 | 23,320 | 24,290 | 24,920 | |
| 15,360 | 15,010 | 14,880 | 15,980 | 16,690 | 18,100 | 19,530 | 20,610 | |
| 45,530 | 46,100 | 47,090 | 48,050 | 49,420 | 50,700 | 52,010 | 53,370 | |
| 13,620 | 14,420 | 15,340 | 15,820 | 16,490 | 18,070 | 19,740 | 21,160 | |
| 37,130 | 37,570 | 37,880 | 38,570 | 39,580 | 41,000 | 42,490 | 43,630 | |
| 31,820 | 32,080 | 32,420 | 33,020 | 33,430 | 34,220 | 34,980 | 36,060 | |
| 34,130 | 34,860 | 36,150 | 37,090 | 38,060 | 39,260 | 40,340 | 41,340 | |
| 17,310 | 16,480 | 16,400 | 16,380 | 16,380 | 16,760 | 17,210 | 17,500 | |
| 10,050 | 10,310 | 10,730 | 11,400 | 11,740 | 12,830 | 13,690 | 14,720 | |
| 38,090 | 38,890 | 41,870 | 55,970 | 57,210 | 61,870 | 66,670 | 70,470 | |
| 26,920 | 26,590 | 26,770 | 27,260 | 27,970 | 28,690 | 29,220 | 29,610 | |
| 10,870 | 11,350 | 11,860 | 12,350 | 12,800 | 13,810 | 15,130 | 15,930 | |
| 11,160 | 11,830 | 12,460 | 12,850 | 13,560 | 14,940 | 16,160 | 17,310 | |
| 83,000 | 85,270 | 89,240 | 91,440 | 93,930 | 95,170 | 98,640 | 102,200 | |
| 17,060 | 17,950 | 19,570 | 21,690 | 22,750 | 24,190 | 25,510 | 26,350 | |
| 38,970 | 39,300 | 39,820 | 40,730 | 41,590 | 43,090 | 44,920 | 46,740 | |
| 10,100 | 10,250 | 10,680 | 11,190 | 11,100 | 12,160 | 12,920 | 13,730 | |
| 16,010 | 16,300 | 16,640 | 17,350 | 18,060 | 19,020 | 19,870 | 20,650 | |
| 6,640 | 7,190 | 7,550 | 8,090 | 8,650 | 9,580 | 10,510 | 11,500 | |
| 13,590 | 13,740 | 14,070 | 14,710 | 14,920 | 15,540 | 16,470 | 17,270 | |
| 17,630 | 17,700 | 18,250 | 18,830 | 19,550 | 20,810 | 22,080 | 22,980 | |
| 22,050 | 21,900 | 22,220 | 23,220 | 23,980 | 24,970 | 25,730 | 26,420 | |
| 45,050 | 45,850 | 45,130 | 46,350 | 47,000 | 47,690 | 46,310 | 46,180 | |
| 33,150 | 32,730 | 35,760 | 40,560 | 37,090 | 35,780 | 36,480 | 37,760 | |
| 26,680 | 26,850 | 27,720 | 29,140 | 29,310 | 30,070 | 30,980 | 31,080 | |
| Eurozone | 29,220 | 29,440 | 30,070 | 31,030 | 31,790 | 32,850 | 33,830 | 34,770 |
| 4,680 | 5,080 | 4,970 | 5,030 | 5,200 | 5,580 | 6,140 | 6,590 | |
| 5,130 | 5,410 | 5,560 | 5,870 | 6,350 | 6,910 | 7,490 | ||
| Member state | 2011 | 2012 | 2013 | 2014 | 2015 | 2016 | 2017 | 2018 | 2019 |
|---|---|---|---|---|---|---|---|---|---|
| 27.4 | 27.6 | 27.0 | 27.6 | 27.2 | 27.2 | 27.9 | 26.8 | ||
| 26.3 | 26.5 | 25.9 | 25.9 | 26.2 | 26.3 | 26.0 | 25.6 | ||
| 35.0 | 33.6 | 35.4 | 35.4 | 37.0 | 37.7 | 40.2 | 39.6 | 40.8 | |
| 31.2 | 30.9 | 30.9 | 30.2 | 30.4 | 29.8 | 29.9 | 29.7 | ||
| 29.2 | 31.0 | 32.4 | 34.8 | 33.6 | 32.1 | 30.8 | 29.1 | ||
| 25.2 | 24.9 | 24.6 | 25.1 | 25.0 | 25.1 | 24.5 | 24.0 | ||
| 26.6 | 26.5 | 26.8 | 27.7 | 27.4 | 27.7 | 27.6 | 27.9 | 27.5 | |
| 31.9 | 32.5 | 32.9 | 35.6 | 34.8 | 32.7 | 31.6 | 30.6 | ||
| 25.8 | 25.9 | 25.4 | 25.6 | 25.2 | 25.4 | 25.3 | 25.9 | 26.2 | |
| 30.8 | 30.5 | 30.1 | 29.2 | 29.2 | 29.3 | 29.3 | 28.5 | ||
| 29.0 | 28.3 | 29.7 | 30.7 | 30.1 | 29.5 | 29.1 | 31.1 | ||
| 33.5 | 34.3 | 34.4 | 34.5 | 34.2 | 34.3 | 33.4 | 32.3 | ||
| 26.9 | 27.2 | 28.3 | 28.6 | 28.2 | 28.2 | 28.1 | 28.7 | 28.0 | |
| 29.8 | 30.5 | 30.7 | 31.1 | 29.8 | 29.5 | 30.6 | 28.9 | ||
| 32.5 | 32.4 | 32.8 | 32.4 | 32.4 | 33.1 | 32.7 | 33.4 | ||
| 35.1 | 35.7 | 35.2 | 35.5 | 35.4 | 34.5 | 34.5 | 35.6 | 35.2 | |
| 33.0 | 32.0 | 34.6 | 35.0 | 37.9 | 37.0 | 37.6 | 36.9 | ||
| 27.2 | 28.0 | 30.4 | 28.7 | 28.5 | 31.0 | 30.9 | 33.2 | ||
| 27.2 | 27.1 | 27.9 | 27.7 | 28.1 | 28.5 | 28.3 | 28.7 | ||
| 25.8 | 25.4 | 25.1 | 26.2 | 26.7 | 26.9 | 27.1 | 27.0 | ||
| 31.1 | 30.9 | 30.7 | 30.8 | 30.6 | 29.8 | 29.2 | 27.8 | 28.5 | |
| 34.2 | 34.5 | 34.2 | 34.5 | 34.0 | 33.9 | 33.5 | 32.1 | ||
| 33.5 | 34.0 | 34.6 | 35.0 | 37.4 | 34.7 | 33.1 | 35.1 | 34.8 | |
| 25.7 | 25.3 | 24.2 | 26.1 | 23.7 | 24.3 | 23.2 | 20.9 | ||
| 23.8 | 23.7 | 24.4 | 25.0 | 24.5 | 24.4 | 23.7 | 23.4 | ||
| 34.0 | 34.2 | 33.7 | 34.7 | 34.6 | 34.5 | 34.1 | 33.2 | ||
| 26.0 | 26.0 | 26.0 | 26.9 | 26.7 | 27.6 | 28.0 | 27.0 | ||
| 33.0 | 31.3 | 30.2 | 31.6 | 32.4 | 31.5 | 33.1 | 33.5 | ||
| 30.5 | 30.4 | 30.6 | 30.9 | 30.8 | 30.6 | 30.3 | 30.4 | ||
| Eurozone | 30.6 | 30.5 | 30.7 | 31.0 | 30.7 | 30.7 | 30.4 | 30.6 | |
| — | — | 38.0 | 38.3 | 40.0 | 39.8 | 37.8 | 35.6 | ||
| — | — | 38.5 | 36.5 | 36.5 | 36.5 | 36.7 | |||
Labour market
The EU seasonally adjusted unemployment rate was 6.7% in September 2018.[62] The euro area unemployment rate was 8.1%.[62] Among the member states, the lowest unemployment rates were recorded in the Czech Republic (2.3%), Germany and Poland (both 3.4%), and the highest in Spain (14.9%) and Greece (19.0 in July 2018).[62]
The following table shows the history of the unemployment rate for all European Union member states :
| Member state[62] | 2009 | 2010 | 2011 | 2012 | 2013 | 2014 | 2015 | 2016 | 2017 | 2018 | 2019 | Last available |
|---|---|---|---|---|---|---|---|---|---|---|---|---|
| 5.0 | 4.9 | 4.7 | 4.6 | 5.4 | 5.6 | 5.6 | 5.9 | 5.7 | 5.0 | 4.7 | 4.5 | |
| 8.0 | 8.5 | 6.9 | 7.1 | 8.3 | 8.5 | 8.7 | 8.1 | 7.6 | 6.1 | 5.5 | 5.6 | |
| 6.3 | 9.9 | 11.2 | 12.1 | 13.0 | 11.9 | 10.0 | 8.1 | 6.4 | 5.4 | 4.6 | 4.4 | |
| 8.9 | 10.8 | 13.7 | 15.5 | 16.5 | 17.7 | 16.6 | 13.9 | 11.8 | 9.0 | 7.2 | 7.1 | |
| 4.6 | 6.7 | 6.9 | 10.7 | 14.9 | 16.2 | 16.2 | 13.1 | 12.1 | 8.9 | 7.2 | 6.5 | |
| 5.9 | 7.7 | 6.8 | 6.9 | 7.2 | 6.5 | 5.6 | 4.0 | 3.2 | 2.2 | 2.0 | 1.9 | |
| 5.3 | 7.6 | 7.4 | 7.7 | 7.1 | 6.6 | 6.4 | 6.0 | 5.9 | 4.9 | 5.3 | 4.8 | |
| 4.3 | 11.9 | 19.2 | 14.0 | 11.1 | 9.1 | 7.9 | 6.7 | 6.4 | 5.7 | 4.1 | 5.0 | |
| 7.6 | 8.5 | 7.9 | 7.6 | 8.1 | 8.4 | 9.2 | 9.0 | 8.8 | 7.9 | 6.8 | 6.7 | |
| 8.9 | 9.3 | 9.1 | 9.5 | 10.3 | 10.2 | 10.3 | 10.1 | 9.6 | 9.2 | 8.7 | 8.7 | |
| 7.6 | 7.3 | 6.1 | 5.4 | 5.3 | 5.1 | 4.8 | 4.3 | 3.9 | 3.5 | 3.2 | 3.1 | |
| 9.1 | 11.6 | 16.0 | 22.7 | 27.1 | 26.9 | 26.0 | 23.8 | 22.1 | 20.1 | 18.2 | 17.6 | |
| 9.6 | 11.4 | 11.1 | 11.3 | 10.6 | 7.9 | 7.3 | 5.7 | 4.4 | 3.7 | 3.4 | 3.4 | |
| 11.1 | 13.2 | 14.3 | 15.0 | 13.6 | 12.0 | 9.8 | 8.3 | 7.0 | 5.8 | 5.0 | 5.3 | |
| 7.6 | 8.4 | 8.0 | 10.5 | 11.9 | 12.7 | 12.4 | 11.5 | 11.5 | 10.8 | 10.1 | 9.7 | |
| 14.8 | 20.4 | 16.7 | 15.9 | 11.9 | 11.1 | 9.8 | 8.6 | 8.8 | 7.7 | 6.5 | 6.5 | |
| 11.6 | 17.8 | 16.5 | 14.0 | 12.1 | 11.5 | 9.3 | 8.4 | 7.5 | 6.5 | 6.0 | 5.7 | |
| 5.4 | 4.6 | 4.7 | 5.1 | 5.7 | 6.0 | 6.4 | 6.4 | 5.8 | 5.3 | 5.7 | 5.8 | |
| 6.6 | 6.9 | 6.5 | 6.5 | 6.2 | 5.9 | 5.7 | 4.9 | 4.2 | 3.9 | 3.4 | 3.4 | |
| 3.9 | 5.1 | 4.8 | 5.5 | 6.9 | 7.8 | 7.0 | 6.4 | 5.1 | 3.9 | 3.3 | 3.4 | |
| 7.9 | 10.0 | 9.4 | 9.8 | 10.6 | 9.7 | 7.8 | 6.4 | 5.1 | 3.9 | 3.7 | 3.8 | |
| 10.1 | 11.6 | 12.5 | 15.0 | 17.2 | 14.7 | 13.2 | 12.0 | 9.7 | 7.5 | 6.5 | 6.7 | |
| 6.0 | 7.3 | 6.8 | 7.0 | 6.9 | 7.0 | 6.7 | 6.4 | 5.2 | 4.4 | 3.9 | 4.0 | |
| 10.7 | 14.9 | 13.6 | 13.7 | 14.1 | 13.6 | 11.9 | 10.1 | 8.5 | 7.0 | 5.6 | 5.4 | |
| 5.3 | 6.9 | 8.1 | 7.9 | 10.8 | 10.1 | 9.2 | 8.3 | 6.9 | 5.5 | 4.5 | 4.4 | |
| 17.4 | 19.5 | 20.7 | 23.9 | 26.3 | 25.2 | 23.0 | 20.3 | 18.0 | 16.0 | 14.2 | 14.0 | |
| 7.8 | 8.8 | 7.9 | 7.5 | 8.3 | 8.0 | 7.5 | 7.2 | 6.4 | 6.2 | 6.7 | 7.1 | |
| 8.6 | 9.7 | 9.5 | 10.3 | 10.9 | 10.5 | 9.7 | 8.8 | 7.9 | 7.1 | 6.4 | 6.3 |
| Member state | 2016[63] | 2017[64] | 2018[65] |
|---|---|---|---|
| 71.2 | 72.3 | 71.8 | |
| 68.8 | 67.8 | 67.5 | |
| 75.3 | 75.1 | 76.6 | |
| 73.4 | 74.0 | 74.1 | |
| 62.5 | 63.3 | 63.9 | |
| 73.8 | 73.8 | 74.2 | |
| 54.0 | 55.0 | 57.3 | |
| 77.3 | 76.7 | 80.4 | |
| 61.7 | 62.5 | 62.5 | |
| 73.2 | 75.9 | 76.4 | |
| 73.7 | 75.8 | 76.2 | |
| 65.3 | 62.6 | 63.4 | |
| 67.6 | 63.6 | 65.1 | |
| 72.7 | 74.9 | 76.3 | |
| 66.8 | 67.9 | 68.3 | |
| 61.5 | 59.4 | 61.0 | |
| 67.9 | 67.9 | 67.8 | |
| 72.5 | 73.3 | 74.2 | |
| 77.2 | 79.1 | 78.8 | |
| 66.8 | 65.8 | 66.7 | |
| 69.7 | 74.8 | 73.6 | |
| 75.2 | 75.8 | 75.3 | |
| 66.5 | 67.7 | 68.5 | |
| 68.6 | 68.3 | 68.5 | |
| 66.6 | 69.7 | 69.4 | |
| 67.2 | 65.7 | 65.3 | |
| 60.3 | 59.2 | 64.8 | |
| 69.1 | 69.4 |
Public finance
| Member state | Public deficit as % of GDP (2018) (E.U. limit : -3%)[66] |
Public debt as % of GDP (2018) (E.U. limit : 60%)[67] |
HICP inflation rate (2018) Max. 1.9% (as of 22 May 2018)[68][69] |
Long-term interest rate (03/18) Max. 3.2% (as of 22 May 2018)[68][70] |
|---|---|---|---|---|
| 0.1 | 73.8 | 2.1 | 0.81 | |
| −0.7 | 102.0 | 2.3 | 0.87 | |
| 2.0 | 22.6 | 2.6 | 1.05 | |
| 0.2 | 74.6 | 1.6 | 2.19 | |
| -4.8 | 102.5 | 0.8 | 1.83 | |
| 0.9 | 32.7 | 2.0 | 1.81 | |
| 0.5 | 34.1 | 0.7 | 0.64 | |
| −0.6 | 8.4 | 3.4 | (n/a) | |
| −0.7 | 58.9 | 1.2 | 0.72 | |
| −2.5 | 98.4 | 2.1 | 0.84 | |
| 1.7 | 60.9 | 1.9 | 0.53 | |
| 1.1 | 181.1 | 0.8 | 4.27 | |
| −2.2 | 70.8 | 2.9 | 2.60 | |
| 0.0 | 64.8 | 0.7 | 1.01 | |
| −2.1 | 132.2 | 1.2 | 1.97 | |
| −1.0 | 35.9 | 2.6 | 0.83 | |
| 0.7 | 34.2 | 2.5 | 0.31 | |
| 2.4 | 21.4 | 2.0 | 0.68 | |
| 2.0 | 46.0 | 1.7 | 1.23 | |
| 1.5 | 52.4 | 1.6 | 0.63 | |
| −0.4 | 48.9 | 1.2 | 3.27 | |
| −0.5 | 121.5 | 1.2 | 1.79 | |
| −3.0 | 35.0 | 4.1 | 4.53 | |
| −0.7 | 48.9 | 2.5 | 0.80 | |
| 0.7 | 70.1 | 1.9 | 1.11 | |
| −2.5 | 97.1 | 1.7 | 1.33 | |
| 0.9 | 38.8 | 2.0 | 0.77 | |
| −0.6 | 80.0 | 1.9 | 1.34 | |
| Eurozone | −0.5 | 85.1 | 1.8 | 1.07 |
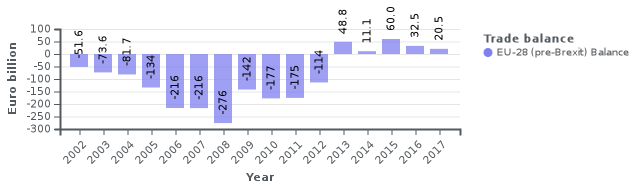
Trade
The European Union is the largest exporter in the world[71] and as of 2008 the largest importer of goods and services.[72][73] Internal trade between the member states is aided by the removal of barriers to trade such as tariffs and border controls. In the eurozone, trade is helped by not having any currency differences to deal with amongst most members.[74]
The European Union Association Agreement does something similar for a much larger range of countries, partly as a so-called soft approach ('a carrot instead of a stick') to influence the politics in those countries. The European Union represents all its members at the World Trade Organization (WTO), and acts on behalf of member states in any disputes. When the EU negotiates trade related agreement outside the WTO framework, the subsequent agreement must be approved by each individual EU member state government.[74]
.jpg)
| Rank | Partners | Imports (million euro) | % (of total) | Exports (million euro) | % (of total) | Total trade (million euro) | % (of total) |
|---|---|---|---|---|---|---|---|
| - | 1,706,413 | 100% | 1,745,730 | 100% | 3,452,143 | 100% | |
| 1 | 246,774 | 14,5% | 362,043 | 20,7% | 608,817 | 17,6% | |
| 2 | 344,642 | 20,2% | 170,136 | 9,7% | 514,779 | 14,9% | |
| 3 | 121,608 | 7,1% | 142,432 | 8,2% | 264,040 | 7,6% | |
| 4 | 118,661 | 7,0% | 72,428 | 4,1% | 191,089 | 5,5% | |
| 5 | 66,652 | 3,9% | 78,030 | 4,5% | 144,681 | 4,2% | |
| 6 | 66,383 | 3,9% | 58,136 | 3,3% | 124,519 | 3,6% | |
| 7 | 62,935 | 3,7% | 48,371 | 2,8% | 111,306 | 3,2% | |
| 8 | 41,433 | 2,4% | 44,518 | 2,6% | 85,951 | 2,5% | |
| 9 | 39,265 | 2,3% | 37,800 | 2,2% | 77,065 | 2,2% | |
| 10 | 29,094 | 1,7% | 35,200 | 2,0% | 64,294 | 1,9% | |
| 11 | 29,334 | 1,7% | 30,909 | 1,8% | 60,243 | 1,7% | |
| 12 | 9,201 | 0,5% | 45,847 | 2,6% | 55,048 | 1,6% | |
| 13 | 19,800 | 1,2% | 33,928 | 1,9% | 53,728 | 1,6% | |
| 14 | 18,212 | 1,1% | 34,989 | 2,0% | 53,201 | 1,5% | |
| 15 | 19,010 | 1,1% | 33,925 | 1,9% | 52,935 | 1,5% | |
| 16 | 19,436 | 1,1% | 31,423 | 1,8% | 50,859 | 1,5% | |
| 17 | 22,853 | 1,3% | 22,986 | 1,3% | 45,839 | 1,3% | |
| 18 | 26,057 | 1,5% | 19,631 | 1,1% | 45,688 | 1,3% | |
| 19 | 13,070 | 0,8% | 32,437 | 1,9% | 45,507 | 1,3% | |
| 20 | 33,064 | 1,0% | 9,332 | 0,5% | 42,396 | 1,2% | |
| 21 | 16,500 | 1,0% | 20,908 | 1,2% | 37,408 | 1,1% | |
| 22 | 22,177 | 1,3% | 13,232 | 0,8% | 35,409 | 1,0% | |
| 23 | 13,809 | 0,8% | 20,791 | 1,2% | 34,599 | 1,0% | |
| 24 | 13,197 | 0,8% | 21,142 | 1,2% | 34,339 | 1,0% | |
| 25 | 20,339 | 1,2% | 13,595 | 0,8% | 33,934 | 1,0% | |
| 26 | 13,080 | 0,8% | 16,505 | 0,9% | 29,586 | 0,9% | |
| 27 | 6,691 | 0,4% | 20,644 | 1,2% | 27,335 | 0,8% | |
| 28 | 14,618 | 0,9% | 10,461 | 0,6% | 25,079 | 0,7% | |
| 29 | 8,724 | 0,5% | 11,698 | 0,7% | 20,422 | 0,6% | |
| 30 | 10,937 | 0,6% | 8,961 | 0,5% | 19,898 | 0,6% |
| Trade with partner country groupings (2012)[75] | ||||||||||||||||||||||||||||||||||||||||||||||||||||||||||||||||||||||||||||||||||||||||||||||||||||||||||||||||
|---|---|---|---|---|---|---|---|---|---|---|---|---|---|---|---|---|---|---|---|---|---|---|---|---|---|---|---|---|---|---|---|---|---|---|---|---|---|---|---|---|---|---|---|---|---|---|---|---|---|---|---|---|---|---|---|---|---|---|---|---|---|---|---|---|---|---|---|---|---|---|---|---|---|---|---|---|---|---|---|---|---|---|---|---|---|---|---|---|---|---|---|---|---|---|---|---|---|---|---|---|---|---|---|---|---|---|---|---|---|---|---|---|
|
| Main trade partners[76] | 2008 | 2009 | 2010 | 2011 | ||||||||
|---|---|---|---|---|---|---|---|---|---|---|---|---|
| Exports (million euro) | Imports (million euro) | Total Trade (million euro) | Exports | Imports | Total Trade | Exports | Imports | Total Trade | Exports | Imports | Total Trade | |
| Total EU | 1,319,819 | 1,582,932 | 2,902,751 | 1,101,746 | 1,234,317 | 2,336,063 | 1,360,059 | 1,531,043 | 2,891,102 | 1,561,890 | 1,726,514 | 3,288,404 |
| 247,818 | 182,351 | 430,169 | 203,587 | 154,862 | 358,449 | 242,451 | 173,067 | 415,518 | 263,791 | 191,555 | 455,346 | |
| 78,276 | 247,815 | 326,091 | 82,391 | 214,238 | 296,629 | 113,426 | 282,509 | 395,935 | 136,372 | 293,693 | 430,065 | |
| 104,843 | 178,294 | 283,137 | 65,587 | 118,122 | 183,709 | 86,134 | 160,709 | 246,843 | 108,355 | 199,922 | 308,277 | |
| 100,537 | 82,348 | 182,885 | 88,693 | 80,570 | 169,263 | 110,401 | 85,228 | 195,629 | 142,022 | 93,202 | 235,224 | |
| 43,698 | 95,888 | 139,586 | 37,476 | 68,864 | 106,340 | 41,914 | 78,981 | 120,895 | 46,678 | 93,813 | 140,491 | |
| 42,347 | 76,177 | 118,524 | 35,932 | 58,233 | 94,165 | 43,948 | 67,258 | 111,206 | 49,018 | 69,549 | 118,567 | |
| 54,415 | 45,963 | 100,378 | 44,385 | 36,228 | 80,613 | 61,747 | 42,397 | 104,144 | 73,096 | 48,143 | 121,239 | |
| 31,349 | 29,540 | 60,889 | 27,477 | 25,414 | 52,891 | 34,866 | 33,308 | 68,112 | 40,558 | 39,906 | 80,464 | |
| 25,491 | 39,565 | 65,056 | 21,596 | 32,370 | 53,966 | 27,957 | 39,391 | 67,348 | 32,510 | 36,175 | 68,685 | |
| 26,302 | 35,855 | 62,157 | 21,574 | 25,926 | 47,500 | 31,466 | 33,238 | 64,704 | 35,752 | 38,939 | 74,691 | |
| 25,468 | 25,043 | 50,511 | 21,934 | 19,285 | 41,219 | 26,758 | 24,697 | 51,455 | 29,885 | 30,708 | 60,593 | |
| 22,213 | 16,137 | 38,350 | 20,404 | 14,579 | 34,983 | 24,550 | 18,760 | 43,310 | 27,256 | 19,184 | 46,440 | |
| 20,800 | 24,597 | 45,397 | 16,083 | 19,229 | 35,312 | 21,755 | 20,406 | 42,161 | 26,212 | 21,807 | 48,019 | |
| 21,081 | 22,001 | 43,082 | 19,068 | 11,766 | 30,834 | 23,216 | 16,300 | 39,516 | 26,401 | 28,440 | 54,841 | |
| 11,595 | 24,069 | 35,660 | 10,021 | 17,875 | 27,896 | 14,782 | 24,138 | 38,920 | 16,212 | 24,230 | 40,532 | |
| 21,786 | 12,258 | 34,044 | 19,667 | 13,277 | 32,944 | 27,250 | 14,302 | 41,552 | 30,763 | 10,969 | 41,732 | |
| 26,689 | 13,785 | 40,474 | 21,930 | 9,923 | 31,853 | 26,955 | 12,454 | 39,409 | 31,159 | 14,944 | 46,103 | |
| 15,391 | 28,259 | 43,650 | 14,807 | 17,410 | 32,217 | 15,584 | 21,069 | 36,653 | 17,279 | 27,844 | 45,123 | |
| 5,836 | 35,308 | 41,144 | 6,484 | 20,870 | 27,354 | 7,087 | 29,230 | 36,317 | 2,093 | 10,444 | 12,537 | |
| 21,976 | 13,981 | 35,597 | 15,988 | 10,135 | 26,123 | 21,342 | 13,748 | 35,090 | 23,908 | 16,985 | 40,893 | |
 |
| Sources: Eurostat [ext_lt_intertrd][77] |
 |
| Sources: Eurostat, December 2019
Euro area international trade in goods surplus €23.1 bn €23.4 bn surplus for EU27 |
Regional variation
Comparing the richest areas of the EU can be a difficult task. This is because the NUTS 1 & 2 regions are not homogenous, some of them being very large regions, such as NUTS-1 Hesse (21,100 km2) or NUTS-1 Île-de-France (12,011 km2), whilst other NUTS regions are much smaller, for example NUTS-1 Hamburg (755 km2). An extreme example is Finland, which is divided for historical reasons into mainland Finland with 5.3 million inhabitants and Åland, an autonomous archipelago with a population of 27,000, or about the population of a small Finnish city.
One problem with this data is that some areas are subject to a large number of commuters coming into the area, thereby artificially inflating the figures. It has the effect of raising GDP but not altering the number of people living in the area, inflating the GDP per capita figure. Similar problems can be produced by a large number of tourists visiting the area. The data is used to define regions that are supported with financial aid in programs such as the European Regional Development Fund. The decision to delineate a Nomenclature of Territorial Units for Statistics (NUTS) region is to a large extent arbitrary (i.e. not based on objective and uniform criteria across Europe), and is decided at European level (See also: Regions of the European Union).
NUTS-1 and NUTS-2 regions
The 10 NUTS-1 and NUTS-2 regions with the highest GDP per capita are almost all, except two, in the first fifteen-member states: Prague and Bratislava are the only ones in the 13 new member states that joined in May 2004, January 2007 and July 2013. The leading regions in the ranking of NUTS-2 regional GDP per inhabitant in 2018 were the Grand Duchy of Luxembourg (263%), Southern Ireland (225%), and Eastern and Midland Ireland (210%). Figures for these three regions, however, were artificially inflated by the commuters who do not reside in these regions ("Net commuter inflows in these regions push up production to a level that could not be achieved by the resident active population on its own. The result is that GDP per inhabitant appears to be overestimated in these regions and underestimated in regions with commuter outflows.".[78] Another example of artificial inflation is Groningen. The calculated GDP per capita is very high because of the large natural gas reserves in this region, but Groningen is one of the poorest parts in the Netherlands.
Among the 19 NUTS-2 regions exceeding the 150% level, five were in Germany, two in each Ireland, Austria and the Netherlands and one each in Belgium, the Czech Republic, Denmark, France, Italy, Poland, Romania, Slovakia, and Sweden, as well as in the single region Grand Duchy of Luxembourg.
The NUTS Regulation lays down a minimum population size of 3 million and a maximum size of 7 million for the average NUTS-1 region, whereas a minimum of 800,000 and a maximum of 3 million for NUTS-2 regions.¹[79] This definition, however, is not respected by Eurostat. E.g.: the région of Île-de-France, with 11.6 million inhabitants, is treated as a NUTS-2 region, while the state Free Hanseatic City of Bremen, with only 664,000 inhabitants, is treated as a NUTS-1 region.
|
|
| ||||||||||||||||||||||||||||||||||||||||||||||||||||||||||||||||||||||||||||||||||||||||||||||||||||||||||||||||||
Source: Eurostat[78]
Among the ten lowest regions in the ranking in 2017 most were in Bulgaria, with the lowest figure recorded in Severozapaden. Among the 20 regions below the 50% level, five were in Bulgaria, four each in Greece and Hungary, three in Poland and two each in France and Romania.
|
|
| |||||||||||||||||||||||||||||||||||||||||||||||||||||||||||||||||||||||||||||||||||||||||||||||||||||||||||||||||||||||
Source: Eurostat[78]
See also
- Citizenship of the European Union
- Currencies of the European Union
- European Central Bank
- Economic and Monetary Union
- Capital Markets Union
- Banking Union
- European Investment Bank
- European Union value added tax
- List of largest European companies by revenue
- Central banks and currencies of Europe
- Euro convergence criteria
- Currency
- List of European stock exchanges
- List of currencies in Europe
Notes
- Serbia is a negotiating candidate to the EU.
- Montenegro is a negotiating candidate to the EU.
References
- "Population change - Demographic balance and crude rates at national level". ec.europa.eu/eurostat. Eurostat. Retrieved 1 February 2020.
- "World Economic Outlook Database, October 2019". IMF.org. International Monetary Fund. Retrieved 13 January 2020.
- "World Economic Outlook Database, April 2020". IMF.org. International Monetary Fund. Retrieved 16 April 2020.
- "The World Factbook – Central Intelligence Agency". www.cia.gov. Retrieved 13 October 2016.
- "People at risk of poverty or social exclusion". ec.europa.eu/eurostat. Eurostat. Retrieved 2 February 2020.
- "Gini coefficient of equivalised disposable income – EU-SILC survey". ec.europa.eu/eurostat. Eurostat. Retrieved 9 May 2020.
- "Labor force, total - European Union". data.worldbank.org. World Bank. Retrieved 13 January 2020.
- "Employment rate by sex, age group 20-64". ec.europa.eu/eurostat. Eurostat. Retrieved 15 May 2020.
- "Unemployment by sex and age - monthly average". appsso.eurostat.ec.europa.eu. Eurostat. Retrieved 4 June 2020.
- "Unemployment statistics". ec.europa.eu/eurostat. Eurostat. Retrieved 20 August 2019.
- "Database – Eurostat". ec.europa.eu.
- "Export and Import Partners of European Union". The World Factbook. CIA. 2015. Retrieved 10 July 2016.
- "Client and Supplier Countries of the EU27 in Merchandise Trade (value %) (2019, excluding intra-EU trade)" (PDF). European Commission. 19 March 2020.
- "Eurostat – Tables, Graphs and Maps Interface (TGM) table". ec.europa.eu. Retrieved 15 October 2016.
- "Eurostat – Tables, Graphs and Maps Interface (TGM) table". ec.europa.eu. Retrieved 15 October 2016.
- "Balance of payment statistics – Statistics Explained". ec.europa.eu. Retrieved 15 October 2016.
- "International investment position statistics – Statistics Explained". ec.europa.eu.
- "Euro area and EU27 government deficit both at 0.6% of GDP" (PDF). ec.europa.eu. Eurostat. Retrieved 28 April 2020.
- Source: http://www.oecd.org/dac/stats/ODA-2015-detailed-summary.pdf; Table 1, page 6. Quote, page 3: "In 2015, total net ODA from the 28 EU member states was USD 74 billion, representing 0.47% of their GNI. Net disbursements by EU Institutions were USD 13.8 billion, a slight fall of 0.5% in real terms compared to 2014."
- EU Institutions $13.85 billion, EU member states $73.80 billion.[19]
- "The EU as a borrower – European Commission". ec.europa.eu. Retrieved 15 October 2016.
- "Scope assigns European Union and Euratom first-time credit rating of AAA with Stable Outlook". Scope Ratings. Retrieved 1 February 2019.
- Bank, European Central. "Foreign reserves and own funds". European Central Bank. Retrieved 15 October 2016.
- "Eurostat – Tables, Graphs and Maps Interface (TGM) table". ec.europa.eu.
- "Report for Selected Country Groups and Subjects". www.imf.org. Retrieved 12 October 2016.
- "Triennial Central Bank Survey 2007" (PDF). BIS. 19 December 2007. Retrieved 25 July 2009.
- Aristovnik, Aleksander; Čeč, Tanja (30 March 2010). "Compositional Analysis of Foreign Currency Reserves in the 1999–2007 Period. The Euro vs. The Dollar As Leading Reserve Currency" (PDF). Munich Personal RePEc Archive, Paper No. 14350. Retrieved 27 December 2010.
- Boesler, Matthew (11 November 2013). "There Are Only Two Real Threats to the US Dollar's Status As The International Reserve Currency". Business Insider. Retrieved 8 December 2013.
- https://www.cia.gov/library/publications/the-world-factbook/geos/ee.html
- "World Economic Outlook Database, October 2019". IMF.org. International Monetary Fund. Retrieved 30 January 2020.
- "World Economic Outlook Database, October 2019". www.imf.org. Retrieved 31 January 2020.
- "World Economic Outlook Database, October 2019". IMF.org. International Monetary Fund. Retrieved 13 January 2020.
- "Eurostat – Tables, Graphs and Maps Interface (TGM) table". ec.europa.eu. Retrieved 14 October 2016.
- "GINI index (World Bank estimate) | Data". data.worldbank.org. Retrieved 14 October 2016.
- "Monthly Reports". www.world-exchanges.org. Retrieved 12 October 2016.
- "The World Factbook – Central Intelligence Agency". www.cia.gov. Retrieved 12 October 2016.
- "The World Factbook – Central Intelligence Agency". www.cia.gov. Retrieved 12 October 2016.
- Top Trading Partners Client and Supplier Countries of the EU28 in Merchandise Trade (value %) (2015, excluding intra-EU trade). Accessed 29 October 2018
- "Eurostat – Tables, Graphs and Maps Interface (TGM) table". ec.europa.eu. Retrieved 13 October 2016.
- "Romania becomes third eastern European EU country to be bailed out". The Guardian. 25 March 2009.
- The EU Budget for 2019: growth, solidarity and security in Europe and beyond - provisional agreement reached. European Commission press release. 5 December 2018. https://europa.eu/!bX78Ht
- © European Union, Integrated Financial Reporting Package Overview, Financial year 2017. 2018. https://europa.eu/!hK34QQ
- The proposal to borrow money from the markets. https://euobserver.com/coronavirus/148714
- "Europäische Union: Anteile der Wirtschaftssektoren am Bruttoinlandsprodukt (BIP) von 2004 bis 2014". statista.de (in German). World Bank. Retrieved 22 March 2016.
- European Commission, Overview of the Capital Markets Union, accessed 9 May 2018
- European Commission, Capital markets union action plan, accessed 9 May 2018
- Conference Report: European Financial Market Integration, 6 June 2016, accessed 20 September 2018
- Vértesy, László (2019). "The legal and regulatory aspects of the free movement of capital - towards the Capital Markets Union". Journal of Legal Theory HU.
- "EU's capital markets union 2.0, explained". POLITICO. 8 June 2017. Retrieved 7 March 2018.
- "What is the capital markets union?". European Commission – European Commission. Retrieved 7 March 2018.
- "EU Capital Markets Union". Financial Times. Retrieved 7 March 2018.
- White, Lucy (24 April 2018). "EU's Dombrovskis ignites fresh row over City's market access post-Brexit". Archived from the original on 26 April 2018. Retrieved 25 April 2018.
Regarding Capital Markets Union, the European Commission's plan to improve access to non-bank financing across the EU, he said the "departure of the UK makes this project even more important and even more urgent. It will have to compensate for the EU's largest financial centre not being in the EU and not being in the single market any more"
- "The Global Financial Centres Index 22" (PDF). Long Finance. September 2017.
- "EU expenditure and revenue". Financial Programming and Budget. European Commission. Retrieved 15 September 2014.
- "EU budget myths". EC Europa. European Commission. Retrieved 15 September 2014.
- "Fortune Global 500 List 2017: See Who Made It". Fortune.
- Vértesy, László (2018). "Macroeconomic Legal Trends in the EU11 Countries" (PDF). Public Governance, Administration and Finances Law Review. 3 (1). Archived from the original (PDF) on 12 August 2019. Retrieved 12 August 2019.
- "Eurostat – Tables, Graphs and Maps Interface (TGM) table". Epp.eurostat.ec.europa.eu. Retrieved 14 February 2020.
- "GDP and employment flash estimates for the fourth quarter of 2019". ec.europa.eu. Retrieved 16 May 2020.
- "Gross domestic product at market prices (Current prices and per capita)". Eurostat. Retrieved 28 July 2016.
- "GINI Index for Montenegro". 18 January 2018.
- "Eurostat – Tables, Graphs and Maps Interface (TGM) table". ec.europa.eu.
- "2016 IEF (XLS) table download". The Heritage Foundation. Retrieved 1 February 2016.
- "2017 IEF (XLS) table download". The Heritage Foundation. Retrieved 1 February 2017.
- "2018 IEF (XLS) table download". The Heritage Foundation. Retrieved 1 August 2019.
- "Government deficit, excluding support for financial institutions". Eurostat. Retrieved 28 April 2018.
- "General government gross debt – annual data". Eurostat. Retrieved 4 February 2017.
- "Convergence Report 2018". European Central Bank. 22 May 2018. Retrieved 6 November 2018.
- "Annual Inflation". Eurostat. Retrieved 4 February 2017.
- "Long term government bond yields". Eurostat. 24 October 2018. Retrieved 6 November 2018.
- "Central Intelligence Agency". Cia.gov. Retrieved 26 April 2011.
- "World trade report 2009" (PDF). WTO information website.
- "EU position in world trade". European Commission. Retrieved 24 May 2015.
- Se-jeong, Kim (19 July 2009). "EU-Korea FTA Will Be a Long Process: Greek Ambassador". The Korea Times. Retrieved 15 August 2009.
- "Top Trading Partners 2017 – Trade Statistics". trade.ec.europa.eu.
- "Extra-EU27 trade, by main partners, total product". Epp.eurostat.ec.europa.eu. 17 October 2013. Retrieved 20 May 2014.
- http://appsso.eurostat.ec.europa.eu/nui/show.do?query=BOOKMARK_DS-063317_QID_-63BADB2E_UID_-3F171EB0&layout=TIME,C,X,0;GEO,L,Y,0;INDIC_ET,L,Z,0;SITC06,L,Z,1;PARTNER,L,Z,2;INDICATORS,C,Z,3;&zSelection=DS-063317INDIC_ET,MIO_BAL_VAL;DS-063317PARTNER,EXT_EU28;DS-063317INDICATORS,OBS_FLAG;DS-063317SITC06,TOTAL;&rankName1=PARTNER_1_2_-1_2&rankName2=SITC06_1_2_-1_2&rankName3=INDIC-ET_1_2_-1_2&rankName4=INDICATORS_1_2_-1_2&rankName5=TIME_1_0_0_0&rankName6=GEO_1_2_0_1&sortC=ASC_-1_FIRST&rStp=&cStp=&rDCh=&cDCh=&rDM=true&cDM=true&footnes=false&empty=false&wai=false&time_mode=NONE&time_most_recent=false&lang=EN&cfo=%23%23%23%2C%23%23%23.%23%23%23
- Eurostat (5 March 2020). "Regional GDP per capita ranged from 30% to 263% of the EU average in 2018". Europa web portal. Retrieved 15 May 2020.
- http://epp.eurostat.ec.europa.eu/extraction/retrieve/en/theme1/reg/reg_e3gdp?OutputDir=EJOutputDir_349&user=unknown&clientsessionid=19A1061DE7EB55F2E04BD008A91F53DF.extraction-worker-1&OutputFile=reg_e3gdp.htm&OutputMode=U&NumberOfCells=3868&Language=en&OutputMime=text%2Fhtml&
- ^ Cells shaded in green indicate forecast figure
- ^ One region may be classified by Eurostat as a NUTS-1, NUTS-2 as well as a NUTS-3 region. Several NUTS-1 regions are also classified as NUTS-2 regions such as Brussels-Capital or Ile-de-France. Many countries are only classified as a single NUTS-1 and a single NUTS-2 region such as Latvia, Lithuania, Luxemburg and (although over 3 million inhabitants) Denmark.
- "Euro-indicators News release" (PDF). June 2005 inflation data. Archived from the original (PDF) on 25 June 2006. Retrieved 18 July 2005.
- "Euro-indicators News release" (PDF). May 2005 unemployment data. Archived from the original (PDF) on 25 June 2006. Retrieved 18 July 2005.
- "World Bank". GNI data (July 2005). Retrieved 4 August 2005.
The following links are used for the GDP growth and GDP totals (IMF):
External links
- European Commission – Economic and Financial Affairs
- Eurostat – Statistics Explained – All articles on economy and finance
Update needed?