Immigration to Europe
Immigration to Europe has a long history, but increased substantially in the later 20th century. Western Europe countries, especially, saw high growth in immigration after World War II and many European nations today (particularly those of the EU-15) have sizeable immigrant populations, both of European and non-European origin. In contemporary globalization, migrations to Europe have accelerated in speed and scale. Over the last decades, there has been an increase in negative attitudes towards immigration, and many studies have emphasized marked differences in the strength of anti-immigrant attitudes among European countries.[1]
Beginning in 2004, the European Union has granted EU citizens a freedom of movement and residence within the EU, and the term "immigrant" has since been used to refer to non-EU citizens, meaning that EU citizens are not to be defined as immigrants within the EU territory. The European Commission defines "immigration" as the action by which a person from a non-EU country establishes his or her usual residence in the territory of an EU country for a period that is or is expected to be at least twelve months. Between 2010 and 2013, around 1.4 million non-EU nationals, excluding asylum seekers and refugees, immigrated into the EU each year using regular means, with a slight decrease since 2010.[2]
History
Historical migration into or within Europe has mostly taken the form of military invasion, but there have been exceptions; this concerns notably population movements within the Roman Empire under the Pax Romana; the Jewish diaspora in Europe was the result of the First Jewish–Roman War of AD 66–73.
With the collapse of the Roman Empire, migration was again mostly coupled with warlike invasion, not least during the so-called Migration period (Germanic), the Slavic migrations, the Hungarian conquest of the Carpathian Basin, the Islamic conquests and the Turkic expansion into Eastern Europe (Kipchaks, Tatars, Cumans). The Ottomans once again established a multi-ethnic imperial structure across Western Asia and Southeastern Europe, but Turkification in Southeastern Europe was due more to cultural assimilation than to mass immigration. In the late medieval period, the Romani people moved into Europe both via Anatolia and the Maghreb.
There were substantial population movements within Europe throughout the Early Modern period, mostly in the context of the Reformation and the European wars of religion, and again as a result of World War II.
From the late 15th century until the late 1960s and early 1970s, Greece, Ireland, Italy, Germany, Norway,[3] Sweden,[4] Denmark, Belgium, Portugal, Spain and the United Kingdom[5] were primarily sources of emigration, sending large numbers of emigrants to the Americas, Australia, Siberia and Southern Africa. A number also went to other European countries (notably France, Switzerland, Germany and Belgium). As living standards in these countries have risen, the trend has reversed and they were a magnet for immigration (most notably from Morocco, Somalia, Egypt to Italy and Greece; from Morocco, Algeria and Latin America to Spain and Portugal; and from Ireland, India, Pakistan, Germany, the United States, Bangladesh, and Jamaica to the United Kingdom).
Migration within Europe after the 1985 Schengen Agreement
As a result of the 1985 Schengen Agreement, there is free travel within Europe. Citizens of European Union member states and their families have the right to live and work anywhere within the EU because of EU citizenship but citizens of non-EU or non-EEA states do not have those rights unless they possess the EU Long Term Residence Permit or are family members of EU citizens. Nevertheless, all holders of valid residence permits of a Schengen State have the unrestricted right to travel within the Schengen Area for tourist purposes only, and for up to three months.
A large proportion of immigrants in western European states have come from former eastern bloc states in the 1990s, especially in Spain, Greece, Germany, Italy, Portugal and the United Kingdom. There are frequently specific migration patterns, with geography, language and culture playing a role. For example, there are large numbers of Poles who have moved to the United Kingdom and Ireland and Iceland, while Romanians and also Bulgarians have chosen Spain and Italy.[6][7] In fact, with the earlier of the two recent enlargements of the EU, although most countries restricted free movement by nationals of the acceding countries, the United Kingdom did not restrict for the 2004 enlargement of the European Union and received Polish, Latvian and other citizens of the new EU states. Spain was not restricted for the 2007 enlargement of the European Union and received many Romanians and Bulgarians as well other citizens of the new EU states.[8]
Many of these Polish immigrants to the UK have since returned to Poland, after the serious economic crisis in the UK. Nevertheless, free movement of EU nationals is now an important aspect of migration within the EU, since there are now 27 member states, and has resulted in serious political tensions between Italy and Romania, since Italy has expressed the intention of restricting free movement of EU nationals (contrary to Treaty obligations and the clear jurisprudence of the European Court of Justice).
Another migration trend has been that of Northern Europeans moving toward Southern Europe. Citizens from the European Union make up a growing proportion of immigrants in Spain, coming chiefly from the United Kingdom and Germany, but also from Italy, France, Portugal, The Netherlands, Belgium, etc. British authorities estimate that the population of UK citizens living in Spain is much larger than Spanish official figures suggest, establishing them at about 1,000,000, with 800,000 being permanent residents. According to the Financial Times, Spain is the most favoured destination for Western Europeans considering to move from their own country and seek jobs elsewhere in the EU.[9][10][11][12][13][14][15]
Immigration from outside Europe since the 1980s
While most immigrant populations in European countries are dominated by other Europeans, many immigrants and their descendants have ancestral origins outside the continent. For the former colonial powers France, Britain, the Netherlands, Belgium, Spain, and Portugal, most immigrants, and their descendants have ties to former colonies in Africa, the Americas, and Asia. In addition, Germany, Austria, Switzerland, the Netherlands, and Belgium recruited Turkish and Moroccan guest workers beginning in the 1960s, and many current immigrants in those countries today have ties to such recruitment programs.
Moroccan immigrants also began migrating substantially to Spain and Italy for work opportunities in the 1980s. In the Scandinavian countries of Sweden, Denmark, Norway, and Finland, the bulk of non-Western immigrants are refugees and asylum seekers from the Middle East, East Africa, and other regions of the world arriving since the 1980s and 1990s. Increasing globalization has brought a population of students, professionals, and workers from all over the world into major European cities, most notably London, Paris, and Frankfurt. The introduction of the EU Blue Card in May 2009 has further increased the number of skilled professional immigrants from outside of the continent.
Illegal immigration and asylum-seeking in Europe from outside the continent have been occurring since at least the 1990s. While the number of migrants was relatively small for years, it began to rise in 2013. In 2015, the number of asylum seekers arriving from outside Europe increased substantially during the European migrant crisis (see timeline). However, the EU-Turkey deal enacted in March 2016 dramatically reduced this number, and anti-immigrant measures starting in 2017 by the Italian government further cut illegal immigration from the Mediterranean route.
Some scholars claim that the increase in immigration flows from the 1980s is due to global inequalities between poor and rich countries.[16] In 2017, approximately 825,000 persons acquired citizenship of a member state of the European Union, down from 995,000 in 2016.[17] The largest groups were nationals of Morocco, Albania, India, Turkey and Pakistan.[18] 2.4 million non-EU migrants entered the EU in 2017.[19][20] In addition, cheaper transportation and more advanced technology have further aided migration.
Immigrants in the Nordic countries in 2000–2017
While Norway and Sweden used to have a generous immigration policy, Denmark and Finland used to have more restricted immigration. Though Denmark and Finland have experienced an increase in their immigrant populations between 2000 and 2017 (5.8 percentage points in Denmark and 4.1 in Finland), Norway (10.5) and Sweden (8.7) have seen greater relative increases.
The table below shows the percentage of the total population in the Nordic countries that are either (1) immigrants or (2) children of two immigrant parents:
| Nr | Country | 2000 | 2010 | 2015 | 2016 | 2017 |
|---|---|---|---|---|---|---|
| 1 | 14.5% | 19.1% | 21.5% | 22.2% | 23.2% | |
| 2 | 6.3% | 11.4% | 15.6% | 16.3% | 16.8% | |
| 3 | 7.1% | 9.8% | 11.6% | 12.3% | 12.9% | |
| 4 | 3.2% | 8.9% | 10.0% | 10.8% | 12.0% | |
| 5 | 2.9% | 4.4% | 6.2% | 6.6% | 7.0% |
Denmark
For decades, Danish immigration and integration policy were built upon the assumption that with the right kind of help, immigrants and their descendants will eventually tend to the same levels of education and employment as Danes. This assumption was disproved by a 2019 study by the Danish Immigration Service and the Ministry of Education, while the second generation non-Western immigrants do better than the first generation, the third generation of immigrants with non-Western background do no better education and employment wise than the second generation. One of the reasons was that second-generation immigrants from non-Western countries marry someone from their country of origin and so Danish is not spoken at home which disadvantages children in school. Thereby the process of integration has to start from the beginning for each generation.[30]
According to the Danish Ministry of Finance, non-Western immigration will cost the public expenses 33 billion DKK annually (about 4.4 billion euro) for the foreseeable future due to the low levels of employment. Therefore, they result in higher expenses for social benefits and pay less tax. Western immigrants and their descendants contributed 14 billion DKK annually due to their high level of employment.[31]
France
As of 2008, the French national institute of statistics (INSEE) estimated that 5.3 million foreign-born immigrants and 6.5 million direct descendants of immigrants (born in France with at least one immigrant parent) lived in France. This represents a total of 11.8 million, or 19% of the population. In terms of origin, about 5.5 million are European, four million Maghrebi, one million Sub-Saharan African, and 400,000 Turkish. Among the 5.3 million foreign-born immigrants, 38% are from Europe, 30% from Maghreb, 12.5% from Sub-Saharan Africa, 14.2% from Asia and 5.3% from America and Oceania[32][33] The most significant countries of origin as of 2008 were Algeria (713,000), Morocco (653,000), Portugal (580,000), Italy (317,000), Spain (257,000), Turkey (238,000) and Tunisia (234,000). However, immigration from Asia (especially China, as well as the former French colonies of Vietnam, Cambodia and Laos), and from Sub-Saharan Africa (Senegal, Mali, Nigeria and others), is gaining in importance.
The region with the largest proportion of immigrants is the Île-de-France (Greater Paris), where 40% of immigrants live. Other important regions are Rhône-Alpes (Lyon) and Provence-Alpes-Côte d’Azur (Marseille).
Among the 802,000 newborns in metropolitan France in 2010, 27.3% had at least one foreign-born parent and about one quarter (23.9%) had at least one parent born outside Europe.[34][35] Including grandparents; almost 40% of newborns in France between 2006 and 2008 had at least one foreign-born grandparent. (11% were born in another European country, 16% in Maghreb, and 12% in another region of the world.)[36]
Norway
In January 2015 the "immigrant population" in Norway consisted of approximately 805,000 people, including 669,000 foreign-born and 136,000 born in Norway to two immigrant parents. This corresponds to 15.6% of the total population.[37] The cities with the highest share of immigrants are Oslo (32%) and Drammen (27%). The six largest immigrant groups in Norway are Poles, Swedes, Somalis, Lithuanians, Pakistanis and Iraqis.
In the years since 1970, the largest increase in the immigrant population has come from countries in Asia (including Turkey), Africa and South America, increasing from about 3500 in 1970 to about 300,000 in 2011. In the same period, the immigrant population from other Nordic countries and Western Europe has increased modestly from around 42,000 to around 130,000.
United Kingdom
In 2014 the number of people who became naturalised British citizens rose to a record 140,795 - a 12% increase from the previous year, and a dramatic increase since 2009. Most new citizens came from Asia (40%) or Africa (32%); the largest three countries of origin were India, Pakistan and Bangladesh[39] with Indians making the largest group. In 2005, an estimated 565,000 migrants arrived to live in the United Kingdom for at least a year, primarily from Asia and Africa,[40] while 380,000 people emigrated from the country for a year or more, chiefly to Australia, Spain and the United States.[41]
In 2014 the net increase was 318,000: immigration was 641,000, up from 526,000 in 2013, while the number of people emigrating (for more than 12 months) was 323,000.[42]
Italy
The total immigrant population of the country is now of 5 million and 73 thousand, about 8.3 percent of the population (2014). However, over 6 million people residing in Italy have an immigration background. Since the expansion of the European Union, the most recent wave of migration has been from surrounding European nations, particularly Eastern Europe, and increasingly Asia, replacing North Africa as the major immigration area. Some 1,200,000 Romanians are officially registered as living in Italy, replacing Albanians (500,000) and Moroccans (520,000) as the largest ethnic minority group.[43] Others immigrants from Central-Eastern Europe are Ukrainians (230,000), Polish (110,000), Moldovans (150,000), Macedonians (100,000), Serbs (110,000), Bulgarians (54,000) Germany (41,000), Bosnians (40,000), Russians (39,600), Croatians (25,000), Slovaks (9,000), Hungarians (8,600). Other major countries of origin are China (300,000), Philippines (180,000), India (150,000), Bangladesh (120,000), Egypt (110,000), Perù (105,000), Tunisia (105,000), Sri Lanka (100.000), Pakistan (100,000), Ecuador (90,000) and Nigeria (80,000). In addition, around 1 million people live in Italy illegally. (As of 2014, the distribution of foreign born population is largely uneven in Italy: 84.9% of immigrants live in the northern and central parts of the country (the most economically developed areas), while only 15.1% live in the southern half of the peninsula.)[44][45][46][47]
Spain

Since 2000, Spain has absorbed around six million immigrants, adding 12% to its population. The total immigrant population of the country now exceeds 5,730,677 (12.2% of the total population). According to residence permit data for 2011, more than 710,000 were Moroccan, another 410,000 were Ecuadorian, 300,000 were Colombian, 230,000 were Bolivian and 150,000 were Chinese; from the EU around 800,000 were Romanian, 370,000 (though estimates place the true figure significantly higher, ranging from 700,000 to more than 1,000,000) were British,[48][49][50][51] 190,000 were German, 170,000 were Italian and 160,000 were Bulgarian. A 2005 regularisation programme increased the legal immigrant population by 700,000 people that year.[52][53][54][55][56] By world regions, in 2006 there were around 2,300,000 from the EU-27, 1,600,000 from South America, 1,000,000 from Africa, 300,000 from Asia, 200,000 from Central America & Caribbean, 200,000 from the rest of Europe, while 50,000 from North America and 3,000 from the rest of the world.[57]
Portugal
Portugal, long a country of emigration,[58] has now become a country of net immigration, from both its former colonies and other sources. By the end of 2003, legal immigrants represented about 4% of the population, and the largest communities were from Cape Verde, Brazil, Angola, Guinea-Bissau, the United Kingdom, Spain, France, China and Ukraine.[59]
Sweden
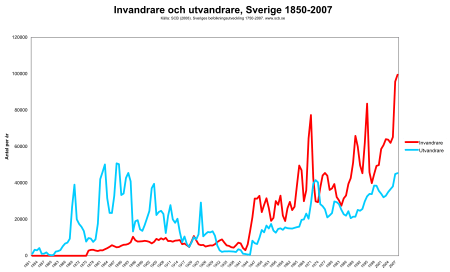
In 2014 the "immigrant population" in Sweden consisted of approximately 2.09 million people, including 1.60 million foreign-born and 489,000 born in Sweden to two immigrant parents. This corresponds to 21.5% of the total population.[60]
Of the major cities Malmö has the largest immigrant population, estimated to be 41.7% in 2014.[61] However, the smaller municipalities Botkyrka (56.2%), Haparanda (55.5%) and Södertälje (49.4%) all have a higher share of immigrants. In the Swedish capital Stockholm 31.1% (in 2014) of the population are either foreign-born or born in Sweden by two foreign-born parents.[62]
In 2014 127,000 people immigrated to Sweden, while 51,000 left the country. Net immigration was 76,000.[60][63]
Sweden has been transformed from a nation of emigration ending after World War I to a nation of immigration from World War II onwards. In 2009, Sweden had the fourth largest number of asylum applications in the EU and the largest number per capita after Cyprus and Malta.[64][65] Immigrants in Sweden are mostly concentrated in the urban areas of Svealand and Götaland and the five largest foreign born populations in Sweden come from Finland, Yugoslavia, Iraq, Poland and Iran.[66]
Finland
Immigration has been a major source of population growth and cultural change throughout much of the history of Finland.[67] The economic, social, and political aspects of immigration have caused controversy regarding ethnicity, economic benefits, jobs for non-immigrants, settlement patterns, impact on upward social mobility, crime, and voting behavior.
At the end of 2017, there were 372,802 foreign born people residing in Finland, which corresponds to 6.8% of the population, while there are 384,123 people with a foreign background, corresponding to 7.0% of the population.[68] Proportionally speaking, Finland has had one of the fastest increases in its foreign-born population between 2000 and 2010 in all of Europe. The majority of immigrants in Finland settle in the Helsinki area, although Tampere, Turku and Kuopio have had their share of immigrants in recent years.
Slovenia
On 1 January 2011 there were almost 229,000 people (11.1%) living in Slovenia with foreign country of birth. At the end of March 2002 when data on the country of birth for total population were for the first and last time collected by a conventional (field) census, the number was almost 170,000 (8.6%). Immigration from abroad, mostly from republics of former Yugoslavia, was the deciding factor for demographic and socioeconomic development of Slovenia in the last fifty years. Also after independence of Slovenia the direction of migration flows between Slovenia and abroad did not change significantly. Migration topics remain closely connected with the territory of former Yugoslavia. Slovenia was and still is the destination country for numerous people from the territory of former Yugoslavia. The share of residents of Slovenia with countries of birth from the territory of former Yugoslavia among all foreign-born residents was 88.9% at the 2002 Census and on 1 January 2011 despite new migration flows from EU Member States and from non-European countries still 86.7%.
Other countries
- Immigration to Austria
- Immigration to Belgium
- Immigration to Bulgaria
- Immigration to Denmark
- Immigration to Germany
- Immigration to Greece
- Immigration to Iceland
- Immigration to the Netherlands
- Integration law for new immigrants to the Netherlands
- Immigration to Romania
- Immigration to Switzerland
Opposition
According to a Yougov poll in 2018, majorities in all seven polled countries were opposed to accepting more migrants: Germany (72%), Denmark (65%), Finland (64%), Sweden (60%), United Kingdom (58%), France (58%) and Norway (52%).[69]
A February 2017 poll of 10 000 people in 10 European countries by Chatham House found on average a majority (55%) were opposed to further Muslim immigration, with opposition especially pronounced in a number of countries: Austria (65%), Poland (71%), Hungary (64%), France (61%) and Belgium (64%). Except for Poland, all of those had recently suffered jihadist terror attacks or been at the centre of a refugee crisis. Of those opposed to further Muslim immigration, 3/4 classify themselves as on the right of the political spectrum. Of those self-classifying as on the left of the political spectrum, 1/3 supported a halt.[70]
Denmark
In Denmark, the parliamentary party most strongly associated with anti-immigration policies is the Danish People's Party.
According to a Gallup poll in 2017, two out of three (64%) wished for limiting immigration from Muslim countries which was an increase from 2015 (54%).[71]
According to a 2018 Yougov poll, 65% of Danes opposed accepting more migrants into the country.[72]
Finland
According to a 2018 Yougov poll, 64% of Finns opposed accepting more migrants into the country.[72]
France
In France, the National Front seeks to limit immigration. Major media, political parties, and a large share of the public believe that anti-immigration sentiment has increased since the country's riots of 2005.
According to a 2018 Yougov poll, 58% of the French opposed accepting more migrants into the country.[72]
Germany
In Germany, the National Democratic Party and the Alternative for Germany oppose immigration.
In 2018, a poll by Pew Research found that a majority (58%) wanted fewer immigrants to be allowed into the country, 30% wanted to keep the current level and 10% wanted to increase immigration.[73]
According to a 2018 Yougov poll, 72% of Germans opposed accepting more migrants into the country.[72]
Greece
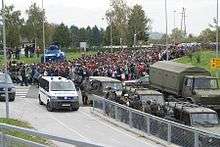
In February 2020, more than 10 000 individuals attempted to cross the border between Greece and Turkey after Turkish president Recep Tayyip Erdoğan opened its border to Europe, but they were blocked by Greek army and police forces. Hundreds of Greek soldiers and armed police resisted the trespassers and fired tear gas at them. Among those who attempted to cross were individuals from Africa, Iran and Afghanistan. Greece responded by refusing to accept asylum applications for a month.[74][75]
In March 2020, migrants set fires and threw Molotov cocktail firebombs over to the Greek side in order to break down the border fence. Greek and European forces responded with tear gas and by trying to keep the fence intact. By 11 March, 348 people had been arrested and 44.353 cases of unlawful entry had been prevented.[76]
Italy
Public anti-immigrant discourse started in Italy in 1985 by the Bettino Craxi government, which in a public speech drew a direct link between the high number of clandestine immigrants and some terrorist incidents.[77][78][79][80] Public discourse by the media hold that the phenomenon of immigration is uncontrollable and of undefined proportions.[81]
According to poll published by Corriere della Sera, one of two respondents (51%) approved closing Italy's ports to further boat migrants arriving via the Mediterranean, while 19% welcomed further boat migrants.[82]
In 2018, a poll by Pew Research found that a majority (71%) wanted fewer immigrants to be allowed into the country, 18% wanted to keep the current level and 5% wanted to increase immigration.[73]
Norway
In Norway, the only parliamentary party that seeks to limit immigration is the Progress Party. Minor Norwegian parties seeking to limit immigration are the Democrats in Norway, the Christian Unity Party, the Pensioners' Party and the Coastal Party.
According to a 2018 Yougov poll, 52% of Norwegians opposed accepting more migrants into the country.[72]
Poland
A 2015 opinion poll conducted by the Centre for Public Opinion Research (CBOS) found that 14% thought that Poland should let asylum-seekers enter and settle in Poland, 58% thought Poland should let asylum-seekers stay in Poland until they can return to their home country, and 21% thought Poland should not accept asylum-seekers at all. Furthermore, 53% thought Poland should not accept asylum-seekers from the Middle East and North Africa, with only 33% thinking Poland should accept them.[83]
Another opinion poll conducted by the same organisation found that 86% of Poles think that Poland does not need more immigrants, with only 7% thinking Poland needs more immigrants.[84]
Despite above in year 2017, 683 000 immigrants from outside of EU arrived to Poland. 87.4% out of them immigrated for work. "Among the EU Member States, Poland issued the highest number (683 thousand) of first residence permits in 2017, followed by Germany (535 thousand) and the United Kingdom (517 thousand)." [85]
Sweden
In response to the high immigration of 2015, the anti-immigration party Sweden Democrats rose to 19.9% in the Statistics Sweden poll.[86]
In late 2015, Sweden introduced temporary border checks on the Øresund Bridge between Denmark and Sweden and public transport operators were instructed to only let people with residence in Sweden board trains or buses. The measures reduced the number of asylum seekers from 163 000 in 2015 to 29 000 in 2016.[87]
In 2018, a poll by Pew Research found that a small majority (52%) wanted fewer immigrants to be allowed into the country, 33% wanted to keep the current level and 14% wanted to increase immigration.[88]
According to a 2018 Yougov poll, 60% of Swedes opposed accepting more migrants into the country.[72]
In February 2020 finance minister Magdalena Andersson encouraged migrants to head for other countries than Sweden. Andersson stated in an interview that integration of immigrants in Sweden wasn't working since neither before nor after 2015 and that Sweden cannot accept more immigration than it is able to integrate.[89]
Switzerland
Switzerland has a history of anti-immigration which dates to the early 1970s and the campaigns of James Schwarzenbach. Since the 1990s, the topic has been dominated by the conservative-liberal Swiss People's Party, led by Christoph Blocher.
United Kingdom
Anti-immigration sentiment in the United Kingdom has historically focused on African, Afro-Caribbean and especially South Asian migrants, all of whom began to arrive from the Commonwealth of Nations in greater numbers following World War II. Since the fall of the Soviet Union and the enlargement of the European Union, the increased movement of people out of countries such as Poland, Romania and Lithuania has shifted much of this attention towards migrants from Eastern Europe. While working-class migrants tend to be the focus of anti-immigration sentiment, there is also some discontent about Russian, Chinese, Singaporean and Gulf Arab multimillionaires resident in the UK, particularly in London and South East England. These residents often invest in property and business, and are perceived as living extravagant "jet-set" lifestyles marked by conspicuous consumption while simultaneously taking advantage of tax loopholes connected to non-dom status.
Policies of reduced immigration, particularly from the European Union, are central to the manifestos of parties such as the UK Independence Party. Such policies have also been discussed by some members of the largest parties in Parliament, most significantly the Conservatives.
Statistics
By host country
2013 data
This is a list of European countries by immigrant population, based on the United Nations report Trends in International Migrant Stock: The 2013 Revision.[90]
| Country | Number of immigrants | Percentage of total number of immigrants in the world | Immigrants as percentage of national population |
|---|---|---|---|
| 11,048,064 | 4.8 | 7.7 | |
| 9,845,244 | 4.3 | 11.9 | |
| 7,824,131 | 3.4 | 12.4 | |
| 7,439,086 | 3.2 | 11.6 | |
| 5,891,208 | 2.8 | 9.6 (2016) | |
| 5,721,457 | 2.5 | 9.4 | |
| 5,151,378 | 2.2 | 11.4 | |
| 2,335,059 | 1.0 | 28.9 | |
| 1,964,922 | 0.9 | 11.7 | |
| 1,130,025 | 0.7 | 15.9 | |
| 1,333,807 | 0.6 | 15.7 | |
| 1,159,801 | 0.5 | 10.4 | |
| 1,085,396 | 0.5 | 11.6 | |
| 988,245 | 0.4 | 8.9 | |
| 893,847 | 0.4 | 8.4 | |
| 756,980 | 0.3 | 17.6 | |
| 735,535 | 0.3 | 15.9 | |
| 694,508 | 0.3 | 13.8 | |
| 663,755 | 0.3 | 0.9 | |
| 556,825 | 0.3 | 9.9 | |
| 532,457 | 0.3 | 5.6 | |
| 449,632 | 0.3 | 4.7 | |
| 446,434 | 0.3 | 8.1 | |
| 439,116 | 0.2 | 4.0 | |
| 391,508 | 0.2 | 11.2 | |
| 323,843 | 0.2 | 3.4 | |
| 317,001 | 0.2 | 10.6 | |
| 282,887 | 0.2 | 13.8 | |
| 233,293 | 0.2 | 11.3 | |
| 229,409 | 0.1 | 43.3 | |
| 209,984 | 0.1 | 16.4 | |
| 207,313 | 0.1 | 18.2 | |
| 198,839 | 0.1 | 0.9 | |
| 189,893 | 0.1 | 4.4 | |
| 147,781 | 0.1 | 4.9 | |
| 139,751 | 0.1 | 6.6 | |
| 96,798 | 0.1 | 3.1 | |
| 84,101 | 0.1 | 1.2 | |
| 45,086 | 0.1 | 56.9 | |
| 44,688 | 0.1 | 52.0 | |
| 34,377 | 0.1 | 10.7 | |
| 24,299 | 0.1 | 64.2 | |
| 23,197 | 0.1 | 0.6 | |
| 12,208 | 0.1 | 33.1 | |
| 9,662 | 0.1 | 33.0 | |
| 4,399 | 0.1 | 15.4 | |
| 799 | 0.1 | 100.0 | |
2010 data for European Union
In 2010, 47.3 million people lived in the EU, who were born outside their resident country. This corresponds to 9.4% of the total EU population. Of these, 31.4 million (6.3%) were born outside the EU and 16.0 million (3.2%) were born in another EU member state. The largest absolute numbers of people born outside the EU were in Germany (6.4 million), France (5.1 million), the United Kingdom (4.7 million), Spain (4.1 million), Italy (3.2 million), and The Netherlands (1.4 million).[91][92]
| Country | Total population (millions) | Total Foreign-born (millions) | % | Born in other EU state (millions) | % | Born in a non-EU state (millions) | % |
|---|---|---|---|---|---|---|---|
| 81.802 | 9.812 | 12.0 | 3.396 | 4.2 | 6.415 | 7.8 | |
| 64.716 | 7.196 | 11.1 | 2.118 | 3.3 | 5.078 | 7.8 | |
| 62.008 | 7.012 | 11.3 | 2.245 | 3.6 | 4.767 | 7.7 | |
| 46.000 | 6.422 | 14.0 | 2.328 | 5.1 | 4.094 | 8.9 | |
| 61.000 | 4.798 | 8.5 | 1.592 | 2.6 | 3.205 | 5.3 | |
| 16.575 | 1.832 | 11.1 | 0.428 | 2.6 | 1.404 | 8.5 | |
| 11.305 | 0.960 | 9.6 | 0.320 | 2.3 | 0.640 | 6.3 | |
| 3.758 | 0.766 | 20.0 | 0.555 | 14.8 | 0.211 | 5.6 | |
| 9.340 | 1.337 | 14.3 | 0.477 | 5.1 | 0.859 | 9.2 | |
| 8.367 | 1.276 | 15.2 | 0.512 | 6.1 | 0.764 | 9.1 | |
| 10.666 | 1.380 | 12.9 | 0.695 | 6.5 | 0.685 | 6.4 | |
| 10.637 | 0.793 | 7.5 | 0.191 | 1.8 | 0.602 | 5.7 | |
| 5.534 | 0.500 | 9.0 | 0.152 | 2.8 | 0.348 | 6.3 | |
| 2.050 | 0.228 | 11.1 | 0.021 | 1.8 | 0.207 | 9.3 | |
| EU 28 | 501.098 | 47.348 | 9.4 | 15.980 | 3.2 | 31.368 | 6.3 |
2005 data
According to the list of countries by immigrant population, based on the United Nations report World Population Policies 2005. The European countries that have the highest net foreign populations are:
| Country | Population | Percentage | Notes |
|---|---|---|---|
| 12,080,000 | 8.5 | ||
| 10,144,000 | 12.3 | ||
| 6,833,000 | 14.7 | ||
| 6,471,000 | 10.2 | ||
| 5,408,000 | 9 | ||
| 5,000,000 | 8.2 | ||
| 4,790,000 | 10.8 | ||
| 1,660,000 | 23 | ||
| 1,638,000 | 10 | ||
| 1,234,000 | 15 |
The European countries with the highest proportion or percentage of non-native residents are small nations or microstates. Andorra is the country in Europe with the highest percentage of immigrants, 77% of the country's 82,000 inhabitants. Monaco is the second with the highest percentage of immigrants, they make up 70% of the total population of 32,000; and Luxembourg is the third, immigrants are 37% of the total of 480,000; in Liechtenstein they are 35% of the 34,000 people; and in San Marino they comprise 32% of the country's population of 29,000.
Countries in which immigrants form between 25% and 10% of the population are: Switzerland (23%), Latvia (19%), Estonia (15%), Austria (15%), Croatia (15%), Ukraine (14.7%), Cyprus (14.3%), Ireland (14%), Moldova (13%), Germany (12.3%), Sweden (12.3%), Belarus (12%), Slovenia (11.1%), Spain (10.8%, 12.2% in 2010), France (10.2%), and the Netherlands (10%).[93] The United Kingdom (9%), Greece (8.6%), Russia (8.5%), Finland (8.1%), Iceland (7.6%), Norway (7.4%), Portugal (7.2%), Denmark (7.1%), Belgium (6.9%) and the Czech Republic (6.7%),[94] each have a proportion of immigrants between 10% and 5% of the total population.
2006 data
Eurostat data[95] reported in 2006 that some EU member states as receiving "large-scale" immigration. The EU in 2005 had an overall net gain from international migration of 1.8 million people, which accounted for almost 85% of Europe's total population growth that year.[96] In 2004, a total of 140,033 people immigrated to France. Of them, 90,250 were from Africa and 13,710 from elsewhere in Europe.[97] In 2005, the total number of immigrants fell slightly, to 135,890.[98]
By origin
This is a breakdown by major area of origin of the 72.4 million migrants residing in Europe (out of a population of 742 million) at mid-2013, based on the United Nations report Trends in International Migrant Stock: The 2013 Revision.[99]
| Area of origin | Number of immigrants to Europe (millions) | Percentage of total number of immigrants to Europe |
|---|---|---|
| Africa | 8.9 | 12 |
| Middle east | 8.9 | 18.75 |
| Asia | 18.6 | 27 |
| Europe | 37.8 | 52 |
| Latin America and the Caribbean | 4.5 | 6 |
| Northern America | 0.9 | 1 |
| Oceania | 0.3 | 0.4 |
| Various | 1.3 | 2 |
| TOTAL | 72.4 | 100 |
Approximate populations of non-European origin in Europe (about 20 - 30+ millions, or 3 - 4% (depending on the definition of non-European origin), out of a total population of approx. 831 million):
- Turks (including Turks from Turkey and Northern Cyprus): approx. 9 million (this estimate does not include the 10 million Turks within the European portion of Turkey);[100] of whom about 4 million in Germany and the rest in the Netherlands, Austria, the United Kingdom, France, Belgium, Sweden, Switzerland, Denmark, Italy, Bulgaria, Macedonia, Greece, Romania, Finland, Serbia and Norway. (see Turks in Europe)
- Arabs (including North African and Middle Eastern Arabs): approx. 5 million; mostly in France, Italy, Spain, Germany, the United Kingdom, Greece, Sweden, the Netherlands, Denmark, Belgium, Norway, Switzerland, Finland and Russia. (see Arabs in Europe) Many Arabs in Europe are Lebanese and Syrian.
- Black Africans (including Afro-Caribbeans and others by descent): approx. 5 million; mostly in France, the United Kingdom, Italy, Germany, Spain, Belgium, the Netherlands and Portugal. (in Spain and Portugal Afro-Caribbean and Afro-Latin American are included in Latin Americans)[101]
- Indians: approx. 2.5 million; mostly in the United Kingdom, Italy, the Netherlands, Germany, Ireland and Portugal.
- Tamils: approx. 130,000 in the United Kingdom, France, Germany, Switzerland, Italy, the Netherlands, Norway and Denmark.
- Pakistanis: approx. 1.1 million in the United Kingdom, but also 60,000 in Italy, Spain, and Norway.
- Bengali: approx. 600,000 mostly in United Kingdom, but also 85,000 in Italy, 35,000 in France, Spain, Sweden, Finland and Greece.
- Latin Americans (includes Afro-Latin Americans, Afro-Caribbeans, Native Americans, White Latin Americans, miscegenation, etc.): approx. 2.2 million; mostly in Spain (c. 1.8 million) but also in Italy, Portugal, the United Kingdom and some in Germany.[102]
- Armenians: approx. 2 million; mostly in Russia, but also in France, Ukraine, Greece, Bulgaria, Spain, Germany, Poland, the United Kingdom and Belgium.
- Berbers: approx. 2 million; mostly in France, Italy, the Netherlands, Belgium and Spain.
- Kurds: approx. 2 million; mostly in Germany, France, Sweden, Russia, the Netherlands, Belgium and the United Kingdom.
- Chinese: approx. 1 million; mostly in France, the United Kingdom, Russia, Italy, Spain, Germany and the Netherlands.
- Vietnamese: approx. 800,000; mostly in France, Germany, the United Kingdom, Poland, Norway, the Netherlands, Finland, Sweden, Denmark and Russia.
- Filipinos: approx. 600,000; mostly in the United Kingdom, Italy, Spain, France, Germany, the Netherlands, Sweden, Austria and Ireland.[103]
- Iranians: approx. 250,000; mostly in Germany, Sweden, the United Kingdom, Russia, the Netherlands, France, Austria, Norway, Spain and Denmark.
- Somalis: approx. 200,000;[104] mostly in the United Kingdom, Sweden, the Netherlands, Norway, Germany, Finland, Denmark and Italy.
- Assyrians/Chaldeans/Syriacs: approx. 200,000; mostly in Sweden, Germany, Russia and The Netherlands.
- Japanese: approx. 100,000; mostly in the United Kingdom and Germany.
Studies
Gallup has published a study estimating potential migrants in 2010.[105] The study estimated that 700 million adults worldwide would prefer to migrate to another country. Potential migrants were asked for their country of preference if they were given free choice.
The total number of potential migrants to the European Union is estimated at 200 million, comparable to the number for North America (USA and Canada). In addition, an estimated 40 million potential migrants within the EU desire to move to another country within the EU, giving the EU the highest intra-regional potential migration rate.[106]
The study estimates that about 500 million out of the 700 million potential migrants would be attracted by fifteen countries (the United States being most popular, attracting 166 million). Apart from the United States and Canada, the top desired target countries were predominantly European: the United Kingdom (46 million), France (39 million), Spain (31 million), Germany (26 million).[107]
The study also compared the number of potential migrants to their desired destination's population, resulting in a Net Migration Index expressing potential population growth. This list is headed by Singapore, which would experience population growth by +219%. Among European countries, Switzerland would experience the highest growth, by +150%, followed by Sweden (+78%), Spain (+74%), Ireland (+66%), the United Kingdom (+62%) and France (+60%). The European countries with highest potential population loss are Kosovo and North Macedonia, with -28% each.[108]
See also
- Demographics of Europe
- Emigration from Europe
- Free movement protocol
- European migrant crisis
- List of countries by immigrant population
- List of countries by foreign-born population
- List of sovereign states and dependent territories by fertility rate
- Migration from Latin America to Europe
- Threats facing illegal immigrants
References
- Marozzi, Marco (2015). "Construction, Robustness Assessment and Application of an Index of Perceived Level of Socio-economic Threat from Immigrants: A Study of 47 European Countries and Regions". Social Indicators Research. 128: 413–437. doi:10.1007/s11205-015-1037-z.
- "Immigration in the EU" (PDF). European Commission.
- "International Migration 2009-2010: SOPEMI-report for Norway" (PDF). Regjeringen.no. December 2010. Retrieved 11 January 2018.
- "Archived copy". Archived from the original on 2018-07-02. Retrieved 2018-07-01.CS1 maint: archived copy as title (link)
- Johnston, Philip (15 November 2007). "Emigration soars as Britons desert the UK". The Daily Telegraph. London.
- Okólski, Marek (24 May 2014). "Polish Emigration to the UK after 2004; Why Did So Many Come?". Central and Eastern European Migration Review. Retrieved 13 March 2018.
- Kivisto, Peter; Faist, Thomas (2009). Beyond a Border: The Causes and Consequences of Contemporary Immigration. SAGE Publishing. pp. 75–76. ISBN 978-1-41292-495-5.CS1 maint: multiple names: authors list (link)
- "Migration in an enlarged EU: A challenging solution?" (PDF). ec.europa.eu. 28 March 2009. Retrieved 20 June 2015.
- "BBC NEWS - Special Reports - Brits Abroad". News.bbc.co.uk. Retrieved 13 May 2016.
- "BBC NEWS - UK - Brits Abroad: Country-by-country". News.bbc.co.uk. 2006-12-11. Retrieved 13 May 2016.
- Giles Tremlett (2006-07-26). "Spain attracts record levels of immigrants seeking jobs and sun". the Guardian. Retrieved 13 May 2016.
- "Bye Bye Blighty article: British Immigrants Swamping Spanish Villages?". Archived from the original on December 23, 2010.
- Jason Burke (2005-10-09). "An Englishman's home is his casa as thousands go south". the Guardian. Retrieved 13 May 2016.
- "BBC NEWS - UK - 5.5m Britons 'opt to live abroad'". News.bbc.co.uk. 2006-12-11. Retrieved 13 May 2016.
- "BBC NEWS - UK - More Britons consider move abroad". News.bbc.co.uk. 2006-08-02. Retrieved 13 May 2016.
- Calefato (1994) pp.80-1 quote:
La presenza di questi immigrati in Europa non e' semplicemente finalizzata alla ricerca di un lavoro, (per lo piu' come camerieri, venditori ambulanti, braccianti stagionali, ecc.). Le migrazioni del nostro tempo pongono con forza una "domanda di accoglienza" (v. Ponzio 1993), cioe' una domanda non contenibile nel mercato e nell'"integrazione", che evidenzia, anche inconsapevolmente, le divaricazioni crescenti sul nostro pianeta tra poverta' e ricchezza.
- "Acquisition of citizenship in the EU". www.europa.eu. European Commission.
- "Acquisition of citizenship statistics". www.ec.europa.eu. Eurostat.
- "Migration and migrant population statistics". Eurostat. March 2019.
- "Migration and migrant population statistics" (PDF). Eurostat. March 2019.
- "Summary of Population Statistics 1960-2015". SCB Statistics Sweden. Retrieved 11 January 2018.
- "Many new Syrian immigrants". Ssb.no. Retrieved 11 January 2018.
- "Nearly 100 000 with Polish background in Norway". Ssb.no. Retrieved 11 January 2018.
- "Innvandring og innvandrere 2004" (PDF). Ssb.no. Retrieved 11 January 2018.
- "Kristina Kvarv Andreassen og Minja Tea Dzamarija : 2. Befolkning" (PDF). Ssb.no. Retrieved 11 January 2018.
- "Statistikbanken". Statistikbanken.dk. Retrieved 11 January 2018.
- "Population by origin, sex and age 1996-2019". PX-Web.
- "Error". Hagstofa. Archived from the original on October 29, 2007.
- "Statistics Finland - Population Structure 2017". Stat.fi. Retrieved 9 February 2019.
- "Opråb fra ministre: Problemer med integration af børn af ikkevestlige indvandrere". Berlingske.dk (in Danish). 2018-12-16. Retrieved 2019-01-29.
- "Ikke-vestlig indvandring og efterkommere koster varigt 33 mia. kr. om året frem til år 2100". Finansministeriet (in Danish). Retrieved 2019-01-29.
- Être né en France d’un parent immigré, Insee Première, n°1287, mars 2010, Catherine Borrel et Bertrand Lhommeau, Insee
- "Résultats de la recherche - Insee". Insee.fr. Retrieved 11 January 2018.
- Naissances selon le pays de naissance des parents 2010, Insee, September 2011
- Parents born in overseas territories are considered to have been born in France.
- Les immigrés, les descendants d'immigrés et leurs enfantslink=, Pascale Breuil-Genier, Catherine Borrel, Bertrand Lhommeau, Insee 2011
- "Key figures". Ssb.no. Retrieved 11 January 2018.
- "Ethnic English people a minority in London". Financial Times. December 11, 2012.
- "Thousands in UK citizenship queue". BBC News. Retrieved 13 May 2016.
- "News". The Telegraph. 2016-03-15. Retrieved 13 May 2016.
- "Home Page - Welcome to WWW.AOL.IN". AOL.IN. Retrieved 13 May 2016.
- "Migration Statistics Quarterly Report May 2015". Office for National Statistics. 21 May 2015.
- "Bilancio demografico nazionale". Italian National Institute of Statistics (in Italian). 31 December 2014. Retrieved 10 June 2016.
- "Indicatori demografici". Istat.it. 30 November 2014. Retrieved 11 January 2018.
- "CITTADINI NON COMUNITARI REGOLARMENTE SOGGIORNANTI : Anni 2013-2014" (PDF). Istat.it. Retrieved 11 January 2018.
- "Cittadini Stranieri. Popolazione residente per sesso e cittadinanza al 31 Dicembre 2012 Italia - Tutti i Paesi". Demo.istat.it. Retrieved 11 January 2018.
- "Италианските българи" (in Bulgarian). 24 Chasa. Archived from the original on 2015-06-08.
- "Brits Abroad: Country-by-country". BBC News. 11 December 2006.
- Tremlett, Giles (26 July 2006). "Spain attracts record levels of immigrants seeking jobs and sun". The Guardian. London.
- "British Immigrants Swamping Spanish Villages?". Archived from the original on December 23, 2010.
- Burke, Jason (9 October 2005). "An Englishman's home is his casa as thousands go south". The Guardian. London.
- Instituto Nacional de Estadística: Avance del Padrón Municipal a 1 de enero de 2006. Datos provisionaleslink= Archived 2008-07-26 at the Wayback Machinelink= 2008-07-26 at the Wayback Machine
- "IMDiversity - Careers, Opportunities, and Diversity Connect". Imdiversity.com. Retrieved 13 May 2016.
- Spain: Immigrants Welcome Archived 2008-10-06 at the Wayback Machine
- "Immigrants Fuel Europe's Civilization Clash". Msnbc.msn.com. Retrieved 11 January 2018.
- "Breaking News, World News & Multimedia". Nytimes.com. Retrieved 11 January 2018.
- 5,598,691 foreign population in Spain (2009)link=, Spanish National Statistic Institute press report, INE (Spain). June 3, 2009. (Spanish)
- "Portugal - Emigration". Countrystudies.us. Retrieved 13 May 2016.
- Charis Dunn-Chan, Portugal sees integration progress, BBC
- Archived 2015-06-07 at the Wayback Machine
- "Andel personer med utländsk bakgrund, 2015 jämfört med 2014". Statistiska Centralbyrån. Retrieved 13 May 2016.
- "Folkmängd den 31 december 2016" (PDF). Statistikomstockholm.se. Archived from the original (PDF) on 30 June 2015. Retrieved 11 January 2018.
- "Preliminary Population Statistics 2016". Statistiska Centralbyrån. Archived from the original on 2016-06-04. Retrieved 13 May 2016.
- Allied Newspapers Ltd. "Malta has highest per capita rate of asylum applications". Times of Malta. Retrieved 13 May 2016.
- Archived 2013-10-23 at the Wayback Machine
- "Visa detaljerad information". Statistiska Centralbyrån. Archived from the original on 12 August 2011. Retrieved 13 May 2016.
- Mayo-Smith, Richmond (1890). Emigration and Immigration: A Study in Social Science. C. Scribner's sons. pp. 157–162.
- "Immigrants in the population". stat.fi (in Finnish). Retrieved 29 September 2018.
- "YouGov | Eurotrack: UK, Denmark, Finland and Norway not pulling their weight on migrants". YouGov: What the world thinks. Retrieved 2018-09-28.
- "What Do Europeans Think About Muslim Immigration?". Chatham House. Retrieved 2018-09-28.
- "To ud af tre vil begrænse muslimsk indvandring". Berlingske.dk (in Danish). 2017-03-14. Retrieved 2019-05-25.
- "Eurotrack: UK, Denmark, Finland and Norway not pulling their weight on migrants | YouGov". yougov.co.uk. Retrieved 2019-05-25.
- Connor, Phillip; Krogstad, Jens Manuel. "Many worldwide oppose more migration – both into and out of their countries". Pew Research Center. Retrieved 2019-01-29.
- "'Are we in Greece?': Migrants seize their chance in Europe quest". news.yahoo.com. Retrieved 2020-03-03.
- "Greece blocks thousands of migrants trying to enter from Turkey". France 24. 2020-03-01. Retrieved 2020-03-03.
- Kampouris, Nick. "New Clashes Erupt in Evros; Migrants Throw Petrol Bombs Over to Greek Side | GreekReporter.com". Retrieved 2020-03-13.
- Guild and Minderhoud (2006) p.173
- Dal Lago p.122
- Ministero degli Interni (1985) Relazione al Parlamento sull'attività delle Forze di Polizia e sullo stato dell'ordine e della sicurezza pubblíca nel territorio nazionale
- Palidda, S. (1996) Verso il fascismo democratico? Note su emigrazione, immigrazione e società dominanti', Aut Aut 275: 143–68
- Marazziti and Riccardi (2005) pp.40-1 quote:
La "vulgata" difunde la idea de que el fenomeno es de dimensiones incontrolables e indefinibles, y se llega a formular la afirmacion comun de que hay tantos, o mas, extranjeros clandestinos como extranjeros visibles y regulares.
[...] la inmigracion [...] ha entrado en el imaginario de los miedos o de las extrañezas. Progresivamente, el lenguaje que se utilizara sera el de orden publico, de las varias "tolerancia cero".
[...] Se evocan banalmente los choques de civilizaciones para dar dignidad al prejuicio. El mecanismo es antiguo, pero la sociedades no estan vacunadas contra ellos. - Pagnoncelli, Nando (2019-11-01). "Le colpe dell'emergenza migranti? Il 60% punta il dito contro l'Europa". Corriere della Sera (in Italian). Retrieved 2019-01-12.
- Katarzyna Kowalczuk (June 2015). "POLACY WOBEC PROBLEMU UCHODŹSTWA" (PDF). Cbos.pl (in Polish). Retrieved 23 July 2015.
- "Sondaż CBOS: Polacy nie potrzebują imigrantów". Interia.pl (in Polish). 30 June 2015. Retrieved 23 July 2015.
- https://ec.europa.eu/eurostat/statistics-explained/index.php/Residence_permits_statistics#First_residence_permits:_an_overview
- "Sweden Democrats far-right anti-immigration party surging". Businessinsider.com. 1 December 2015.
- Parusel, Bernd. "Der schwedische Umschwung in der Flüchtlingspolitik | bpb". bpb.de (in German). Retrieved 2019-09-26.
- Connor, Phillip; Krogstad, Jens Manuel. "Many worldwide oppose more migration – both into and out of their countries". Pew Research Center. Retrieved 2019-01-24.
- "Magdalena Andersson: Sök er till annat land". Aftonbladet (in Swedish). Retrieved 2020-03-06.
- "International Migration and Development". Esa.un.org. Retrieved 13 May 2016.
- 6.5% of the EU population are foreigners and 9.4% are born abroad Archived January 28, 2012, at the Wayback Machinelink= January 28, 2012, at the Wayback Machine , Eurostat, Katya VASILEVA, 34/2011.
- MoveEurope - immigration to Europe process research team, Artis Zelmenis, 2/2014.
- UN statistics as of 2005, see list of countries by immigrant population.
- "Archived copy". Archived from the original on 2013-01-28. Retrieved 2013-10-01.CS1 maint: archived copy as title (link)
- Eurostat News Release on Immigration in EU Archived 2008-03-07 at the Wayback Machinelink= 2008-03-07 at the Wayback Machine
- "Europe: Population and Migration in 2005". migrationpolicy.org. June 2006. Archived from the original on 9 June 2008. Retrieved 13 May 2016.
- "Migration Data Hub". migrationpolicy.org. Retrieved 13 May 2016.
- "Immigration and the 2007 French Presidential Elections" (PDF). Migrationpolicy.org. Retrieved 11 January 2018.
- "International migrant stock: By destination and origin". United Nations.
- Cole, Jeffrey (2011), Ethnic Groups of Europe: An Encyclopedia, ABC-CLIO, p. 367, ISBN 978-1-59884-302-6
- "France's blacks stand up to be counted". Archived from the original on September 6, 2008.
- "Latin American Immigration to Southern Europe". migrationpolicy.org. 2007-06-28. Retrieved 13 May 2016.
- "Commission on Filipinos Overseas : STOCK ESTIMATE OF OVERSEAS FILIPINOS" (PDF). Cfo.gov.ph. December 2013. Retrieved 11 January 2018.
- "News". The Telegraph. 2016-03-15. Retrieved 13 May 2016.
- Neli Esipova, Julie Ray, and Rajesh Srinivasan, The World’s Potential Migrants, Gallup, 2010."Archived copy". Archived from the original on 2014-09-10. Retrieved 2014-09-10.CS1 maint: archived copy as title (link)
- Esipova, Ray and Srinivasan (2010), p. 8.
- Esipova, Ray and Srinivasan (2010), p. 3.
- Esipova, Ray and Srinivasan (2010), Appendix A, pp. 21–22.
Bibliography
- Calefato, Patrizia (1994) Europa fenicia: identità linguistica, comunità, linguaggio come pratica sociale
- Pieter C. Emmer / Leo Lucassen: Migration from the Colonies to Western Europe since 1800, European History Online, Mainz: Institute of European History, 2010, retrieved: December 17, 2012.
- Elspeth Guild, Paul Minderhoud (2006) Immigration and criminal law in the European Union: the legal measures and social consequences of criminal law in member states on trafficking and smuggling in human beings
- Dal Lago, Alessandro (2005) Non-persone: l'esclusione dei migranti in una società globale
External links
- Eurostat - Migration and migrant population statistics
- Migration in the Mediterranean Region
- Legal Guide to Germany
- Applying for Asylum in the UK - Overview
- How to Ask for Asylum in the Netherlands, Denmark, Germany and elsewhere in Europe
- Eurostat - Statistics Explained: Migration and migrant population statistics (data October 2011)
- Claros, Eulalia. "Migration in the EU" (PDF). Library statistical spotlight. Library of the European Parliament. Retrieved 14 June 2013.